
Nov 2022, daniel@footprint.network
If your organization has a website or app that deals with NFTs or blockchain, you can show data to users directly on your platform to keep them engaged rather than linking to somewhere else.
By having charts showing blockchain data on your website (like Coinmarketcap or DappRadar), you can illustrate trends while making your platform more valuable for users. While this functionality used to involve significant developer resources to build, it now takes minutes.
Footprint Analytics has made it incredibly easy to embed our robust, flexible visualizations on any website. Furthermore, anybody can build their custom Web3 infrastructure with the Footprint Analytics Data API.
Our vision is blockchain analytics made easy; everyone can build analysis and analytics using Footprint tools.
There are three ways to do it:
-
iFrame
-
widget
-
API
In the future, we plan to create even more infrastructure tools for analytics developers/analysts to build apps.
1. iFrame Integration
Developers use iFrame (or inline frame) to load an HTML document from a website inside their own. This document may also contain JavaScript or CSS.
To integrate a Footprint Analytics dashboard using iFrame, choose some charts and create your own dashboard, or, you can choose an ideal dashboard created by the community. Then click on the share button to copy the codes for embedment. Insert the single line of codes into your website.
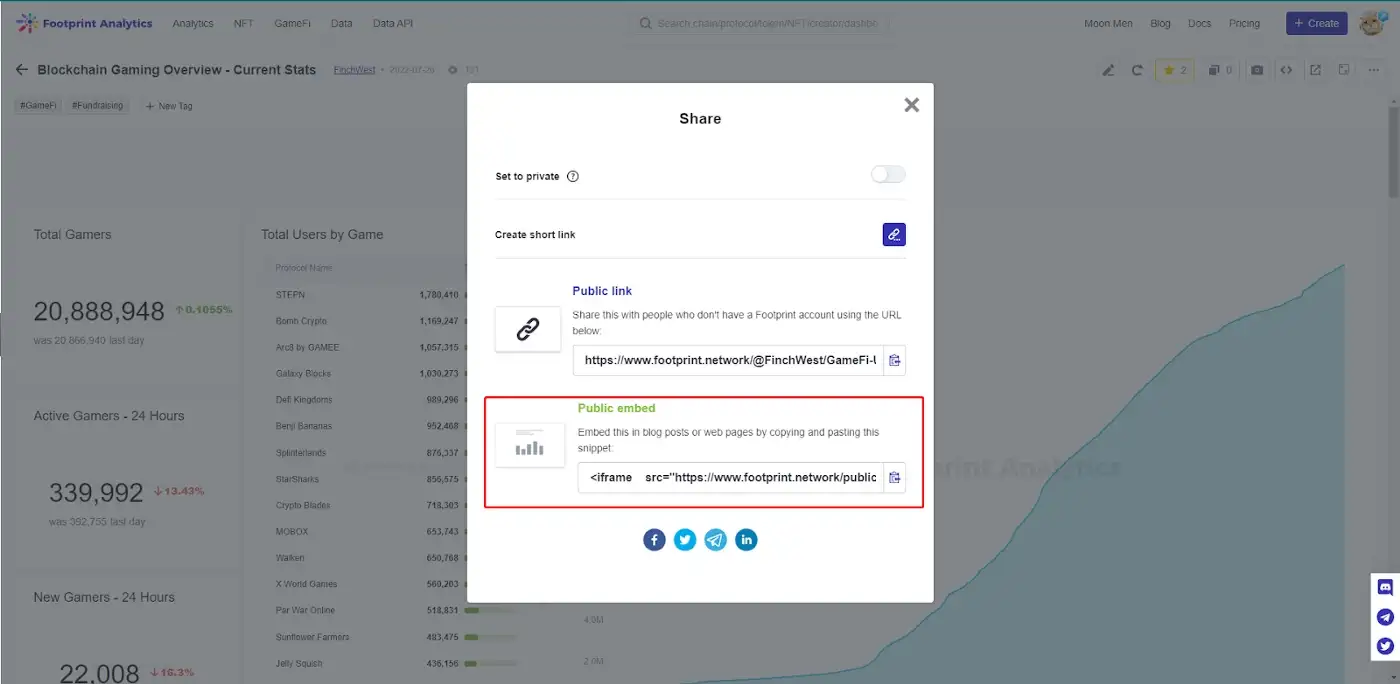
Here’s an example of iFrame combined with Footprint Analytics.
Footprint Analytics Widget
The Footprint Analytics Widget for NFTs allows any platform to display data about the top collections by choosing the indicator you need from the Footprint Analytics Widget and simply inserting code into your website**.**

Currently, the widget can show the top 6 or the top 12 NFT collections and one of three metrics for each — volume (7D), floor price (7D), or market cap. Users can also choose between light or dark modes.
To ensure that the data shown by the widget is meaningful, Footprint filters out wash trading from the 7-day volume metric. The top collections reflect actual on-chain market activity.
2. Footprint Analytics Data API
Footprint Analytics has the most comprehensive warehouse of indexed on-chain data, covering 22 chains, 14 NFT marketplaces, over 1,900 GameFi projects, and over 100,000 NFT collections.
Now, Footprint Analytics puts all this data at the world’s fingertips with the unified data API. It allows developers to make calls from a database of structured data encompassing all of these protocols with a single query or easily customize the data API when needed. Because the API is cross-domain, users get access to NFT, GameFi, and address data all with one tool. The wash trade filter provides users the option to filter out meaningless and fraudulent data.
The flexible API, which has SQL and REST versions, is an enterprise-grade Web3 tool that connects any tech stack to blockchain networks.
To find out more about the Footprint Analytics Data API, click here.
3. Blockchain analytics, made accessible.
As we wrote in an article last week, on-chain data showed FTX in trouble before it collapsed. If more people, not just professional analysts, could explore blockchain data, maybe problems could have been spotted sooner.
With blockchain developers continuing to build despite the negative market sentiment, we believe that the industry will grow. But easy-to-use data platforms will be critical for rebuilding trust in crypto and NFTs.
Thanks to our iFrame, widget, and API integration, developers can quickly and easily tap into historical data from 22 different chains, thousands of protocols, and over 100,000 NFT collections. Footprint aims to be the infrastructure for developers to build apps upon our platform, providing data insights without further development on the front end. Use the data API to customize a better UX & UI according to your own product design.
This piece is contributed by Footprint Analytics community.
Footprint Analytics is building blockchain’s most comprehensive data analysis infrastructure with tools to help developers, analysts, and investors get unrivaled GameFi, DeFi, and NFT insights.
The engine indexes, cleans and abstracts data from 20+ chains and counting — letting users build charts and dashboards without code using a drag-and-drop interface as well as with SQL or Python.
Footprint Analytics also provides a unified data API for NFTs, GameFi, and DeFi across all major chain ecosystems.
*Footprint Website: *https://www.footprint.network
*Discord: *https://discord.gg/3HYaR6USM7
*Twitter: *https://twitter.com/Footprint_Data