“Our aim is to help market participants with professional skill and greater focus to better understand the market and make wiser decisions.”

Recap of this week
This week from May 23 to May 29, The highest point of BTC reached near 30640, the lowest close to 28000, concussion range reached about 8.60%.
Observe the recent chip distribution map, around 28800 there are intensive chip transactions, will be some support or pressure.
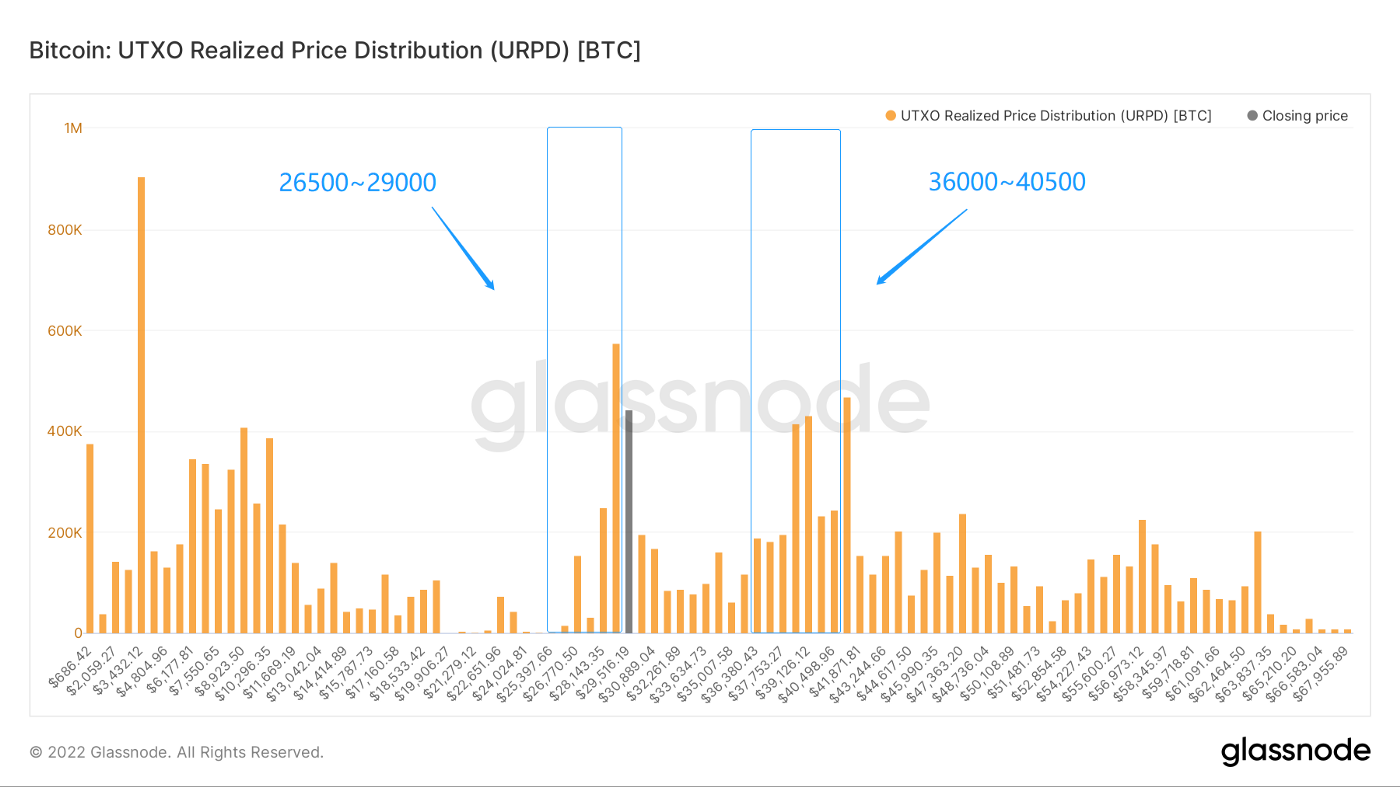
Analysis:
1. About 1,750,000 chips, 26500–29500
2. About 1,890,000 chips, 36000–40500
- There is an 82.5% chance the price will stay between 26,500 and 40,500
Weekly Important News
Macro news:
International situation:
1. Russian forces say they have captured the strategic town of Hopiman in eastern Ukraine. Mr Zelensky said the situation in eastern Ukraine was “very difficult”
2. The EU says it wants to restart free trade talks with India.
3. Biden announced the launch of the Indo-Pacific Economic Framework (IPEF) in Tokyo on May 23.
Analysis:
EU is trying to include India in its trade ‘circle of friends’
The new Indo-Pacific Economic Framework, similar to the previous US-EU Trade and Technology Council (IPEF), aims to bring the US and its Allies closer together in an effort to tighten industrial control and wean them off industrial dependence on countries such as China and Russia.
For some time to come, economic efficiency may no longer be the main driver of trade and investment relations, and the geostrategic needs of international technology will have an increasing impact on trade and investment.
Us macroeconomic indicators:
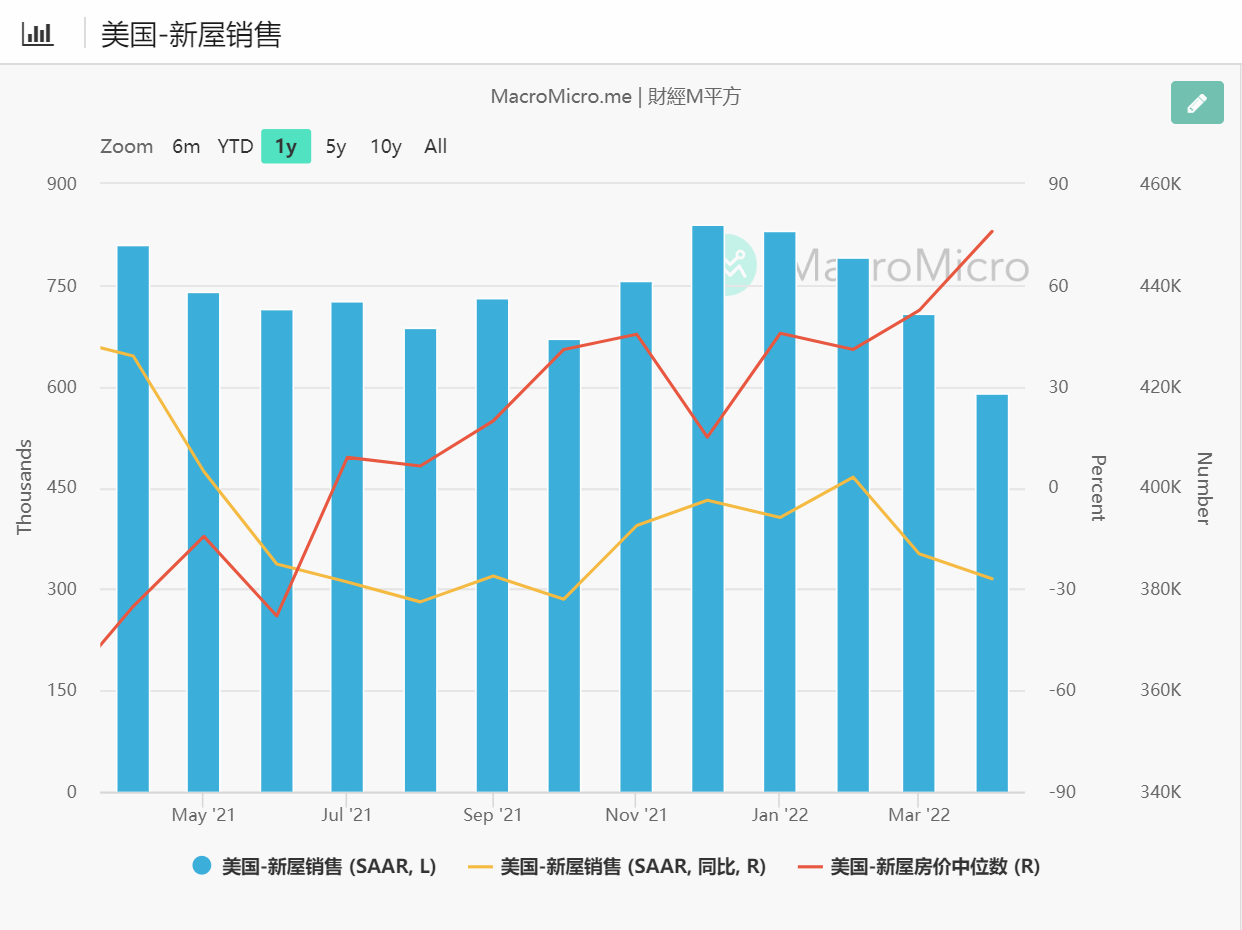
April home sales volume
Us housing transactions fell 3.9% in April, beating expectations (-2.1%).
(Below: US new home sales, source: MacroMicro)
April PCE data
PCE rose 0.3% month-on-month in April vs. +0.3% exp. -4.9% y-o-y vs. +5.2% exp. 4.9% y-o-y last month.
May CPI data (Forecast)
May CPI inflation data will be released on June 10.
Since oil prices were higher in May compared to last month, the current forecast is +0.7% m/m, +0.3% m/m, and core inflation is +0.5% m/m, +0.6% m/m, little changed.
Year-over-year forecasts show broad inflation +8.2% and core inflation +5.9%, compared with +8.3% and +6.2% last month.
Employment in the United States
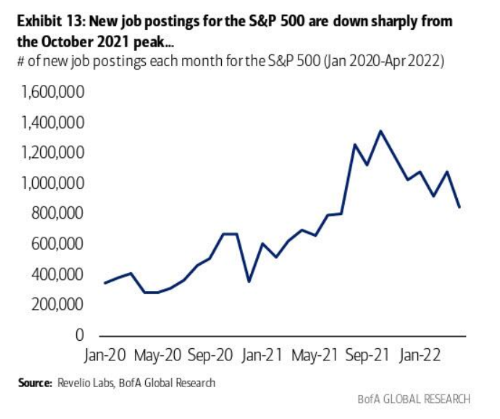
Total S&P 500 job postings have fallen since peaking in October and are now back at mid-year levels.
(New JOB totals from S&P 500 companies, source: Revelio)
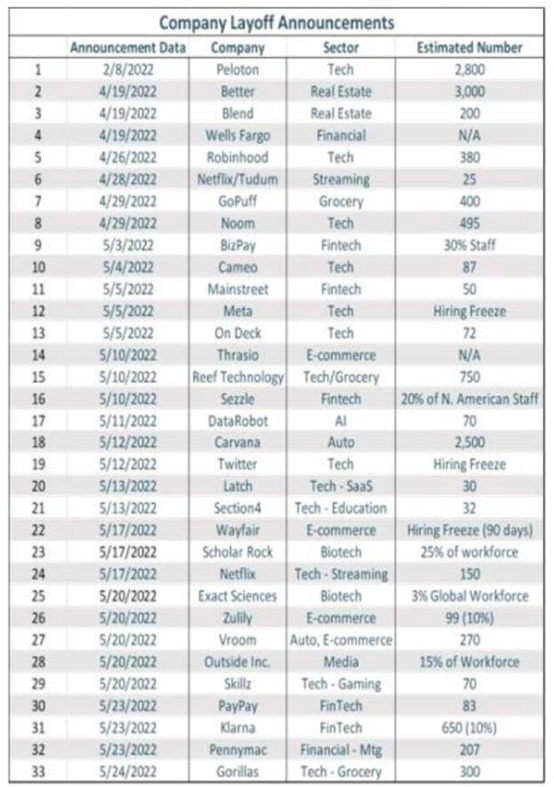
Recent layoffs at large companies
(Number of layoffs at large companies, source: Revelio)
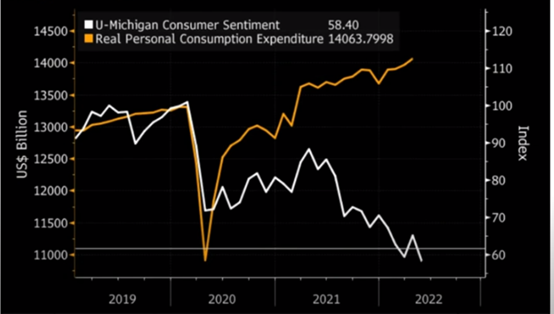
Consumption data
Despite the decline in consumer sentiment, the Michigan consumer index cited earlier has actually fallen to 50.4.
But total consumer spending is still rising.
(Total consumer spending, Consumer confidence index, source: Bloomberg)
Federal Reserve Policy
Fed official Bostic:
If inflation falls back some, it makes sense for the Fed to stop raising rates in September. That is, if inflation falls significantly.
Analysis:
1. The house price component of inflation may have fallen earlier than expected, or since June.
2. As we previously predicted, the overall inflation growth rate is still falling relatively slowly from the PCE forecast released in April and CPI forecast released in May.
It is still difficult to tell when inflation will fall significantly.
1. The labor market is starting to decline tentatively, but it hasn’t caught the Fed’s attention yet.
2. In terms of consumption, the continued increase in consumption is mainly reflected in the recovery of tourism, which is related to the reopening of the overall economy after the epidemic.
But first-quarter results from Wal-mart (WMT) and Target (TGT) show that food consumption has been hit hard by inflation.
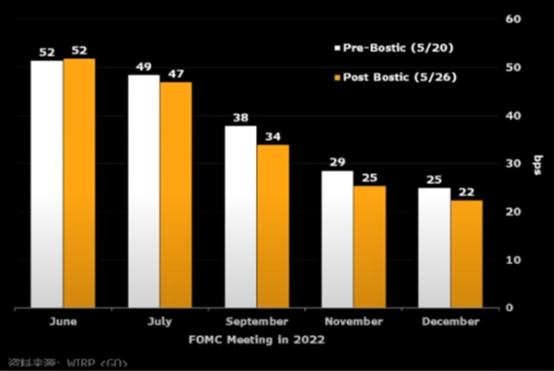
Predictions of interest rate hikes
Market expectations for fed rate hikes have been tempered after Bostic said he may slow rates in September.
(Market expectations for Fed rate hike, source:Bloomberg)
But we think:
Bostic said a slower rate hike would require a significant drop in inflation. With inflation showing no signs of falling sharply, there is little reason to expect the Fed to slow rates in September.
At the current fed rate, maturity spreads will narrow rapidly in the coming months, signaling recession at the bond level.
The market may be a little too optimistic about what the Fed is saying.
There are two drivers most likely to stop the Fed from raising rates in the future,
1. Inflation has fallen significantly, easing interest rate hikes;
2. Employment has deteriorated significantly, and further rate hikes could lead to an even bigger recession.
We need to watch for these two signals to determine the turning point in the overall financial market.
Main Market Performance:
1. The S&P ended the week up 6.58% at 4158.24. The Dow gained 6.24% to end the week at 33212.96, while the Nasdaq gained 6.84% to end the week at 12131.13.
2. WTI Crude futures for July delivery ended the week up 1.62 percent at $115.07 a barrel.
3. Gold futures for June delivery rose 0.45% to $1,851.30 an ounce on the COMEX exchange.
4. The dollar index closed around 101.7, down about 1.4 percent for the week.
5. The benchmark 10-year Treasury fell 4% to 2.74%.
Analysis:
In the retail sector this week, better-than-expected first-quarter earnings from Macy’s, Nordstrom, Dollar Tree and Dollar General may have contributed to some of the gains on Wall Street.
In addition, there was a large net inflow of funds into the U.S. stock market this week.
(Net weekly inflows into U.S. stocks, source: BOA Global Research)
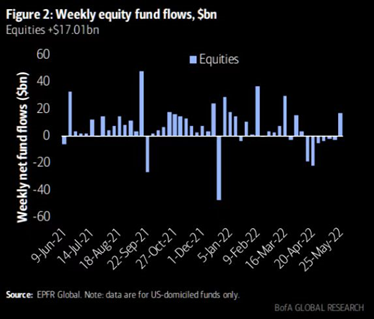
Net inflows into U.S. stocks topped $20 billion this week, the largest in 10 weeks.
Retail net buying.
(Net retail buying, source: Bloomberg)
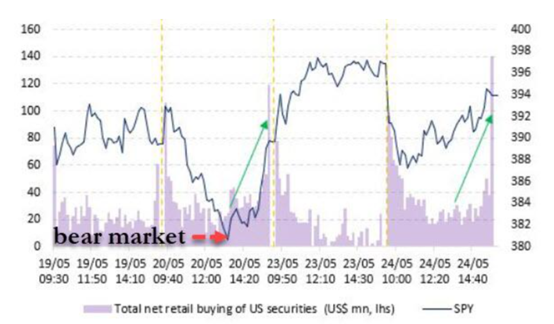
According to Vanda’s analysis, net retail buying since May 20 has shown a high correlation with intraday price movements in the S&P 500.
In the short term, if the market capital inflow has a certain persistence, then the us stock market is likely to continue to rebound.
A lot of retail buying is not a good signal.
Overall, the extent of the rebound is difficult to estimate, be cautions to after high.
Capital News:
1. Ark again bought over 10W shares of Coinbase.
2. Standard Crypto raised $500 million to invest in Crypto stocks and cryptocurrencies.
3. A16z launches $4.5 billion crypto fund.
Other news
1. Brazil’s tax office requires citizens to pay taxes on crypto transactions.
2. Portugal has introduced a new law to regulate the taxation of crypto assets.
3. Redshirt Capital advised its 250 portfolio companies on “adaptation guidelines,” instructing founders to take immediate action to reduce production and save money by eliminating/scaling back projects, r&d, etc.
4. More USDC addresses holding $100W on ethereum chain than USDT
5. Twitter changed its name to Twitter Create, aiming to build the WEB3 creator economy.
**Long-term Insights: **To see how we’re doing in the long run; Bull/bear/structural change/neutral.
**Mid-term probe: **To analyze where we are now, how long we are in this phase, what will happen.
**Short-term Watch: **used to analyze short-term market conditions; And the likelihood of certain directions and certain events occurring under certain conditions.
Long-term Watch
- No. of Active Addresses
- UTXO Price Distribution
- Loss Transfer
- Globale Profit/Loss Distribution
This time, the formation of the bottom in early 2019 is discussed from a few simple perspectives on the chain.
This is for internal research, we specially display a part, welcome to exchange and discussion.
(Number of active addresses below)
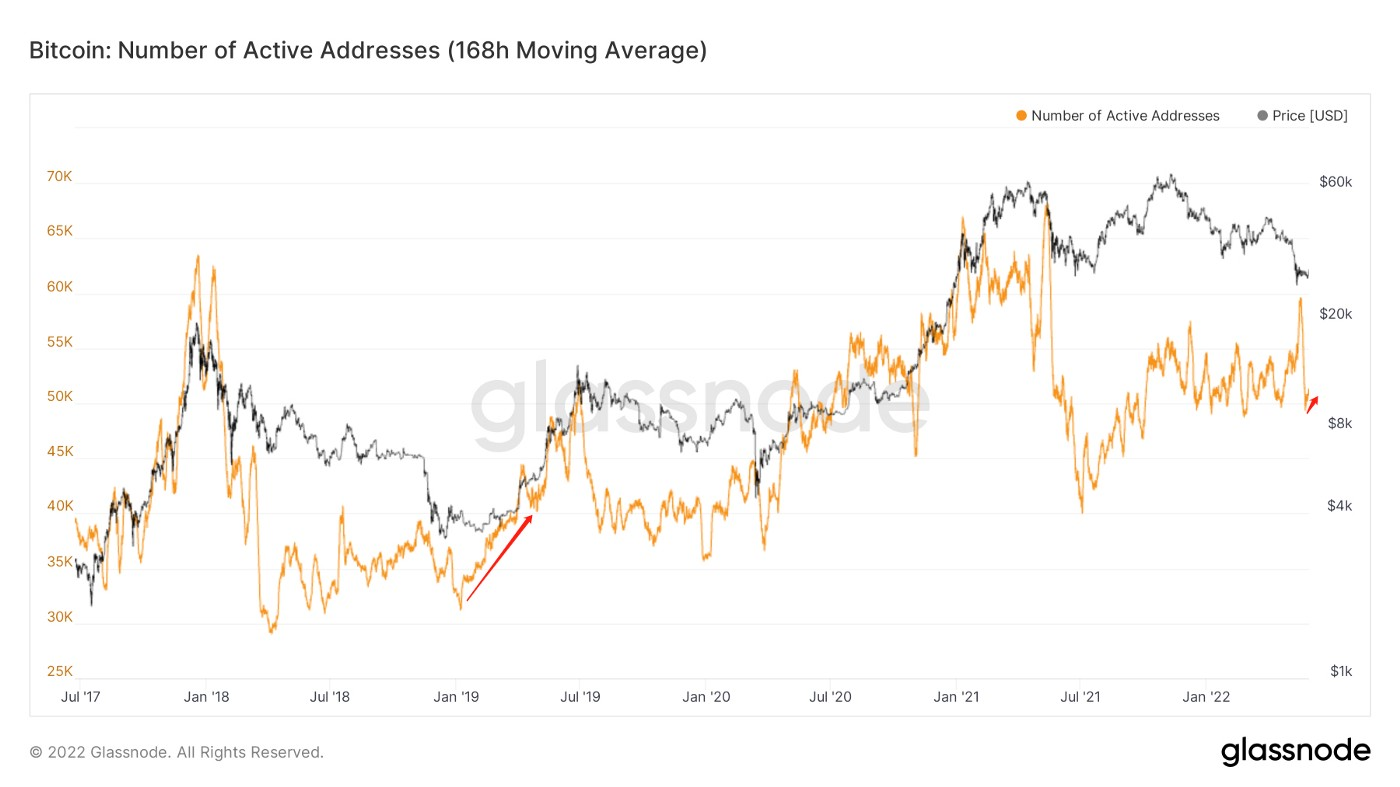
At that time, the market was slowly changing hands and grinding stage.
The active address on the chain, which has been quietly changing, may also be evidence of some internal ecological rise or early consolidation of the chain wallet.
(Figure below: Chip Distribition on 11.16th, 2018)
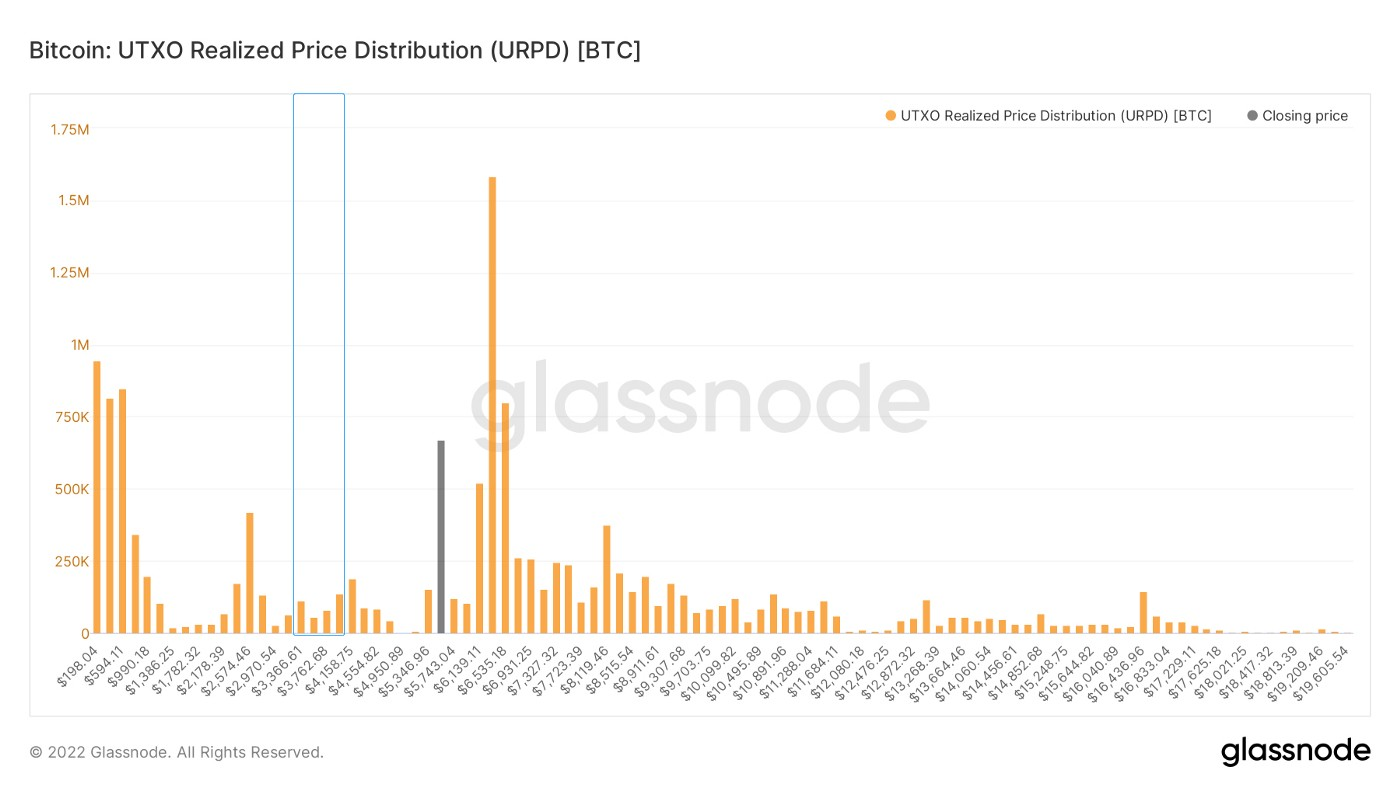
At that time close to drop, the chip distribution is the closest to the original state.
The bottom at $3,000 to $4,000,there was 385,000 chip.
It can be seen that at that time the following chips are not concentrated, and the formation of top-heavy situation.
(Below: the chip on April 6, 2019)
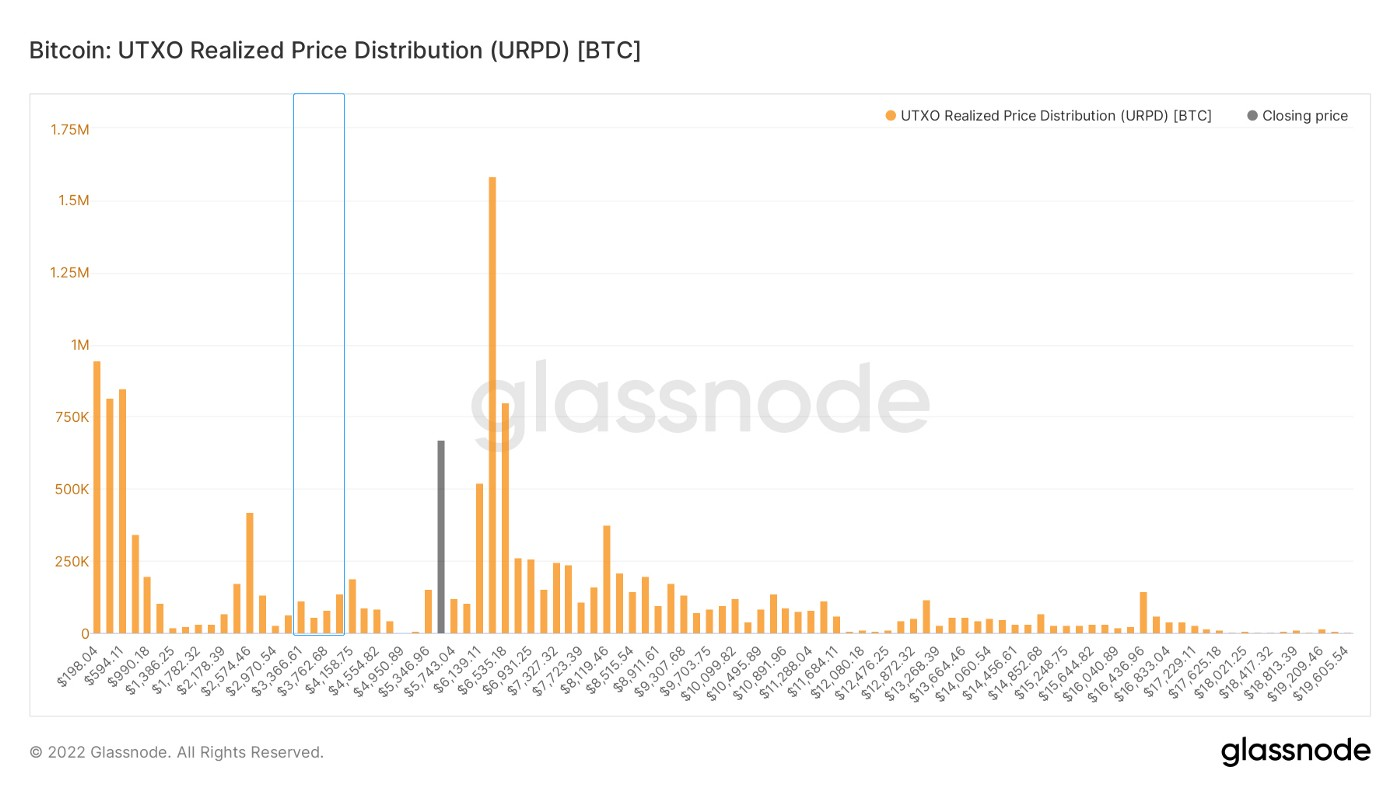
When the price just climbed above $4000, the bottom chip was 4.795 million.
After 135 days of increasing holdings, a total of 4.41 million holdings.
The bottom chips totaled 4.795 million, while BTC totaled 17.61 million.
Accounting for 27.2% of the total.
Of course, it’s important to note that the chips on the chain, cannot catch not all of the chip structure, 20% of them are off the chain.
At the same time, there were more balances on the exchange, so there may have been fewer potential purchases, but the total is now about 19 million. And of course the market cap is much bigger.
So now we need more chips on the chain
However, we still need to pay attention to the above proportion and total concentration.
(Figure below: loss transfer)
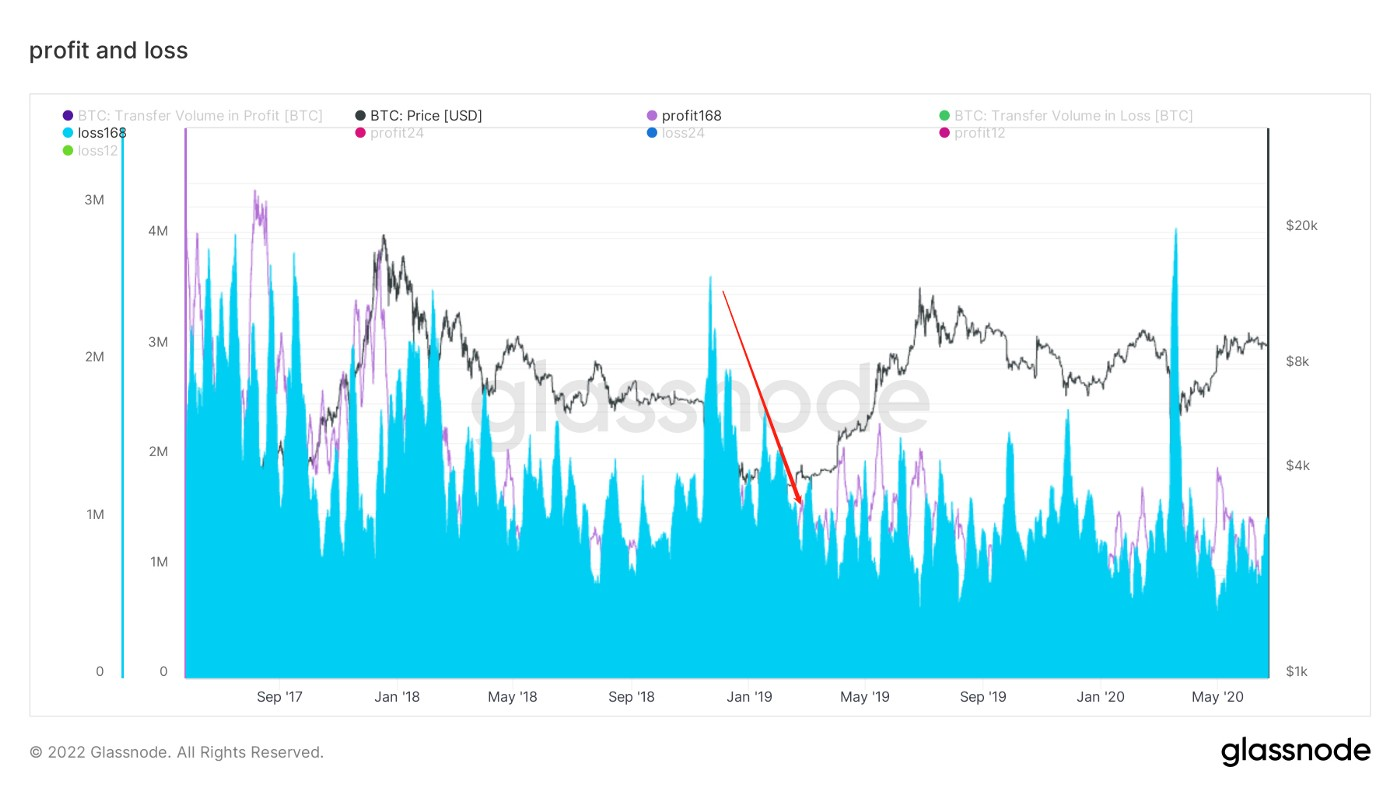
Heavy selling at a loss tends to signal low sentiment.
At that time, the loss selling began to decrease, and from the point of view of real money on the chain, the market’s confidence was improving again.
(Figure below: Global time zone profit and loss)
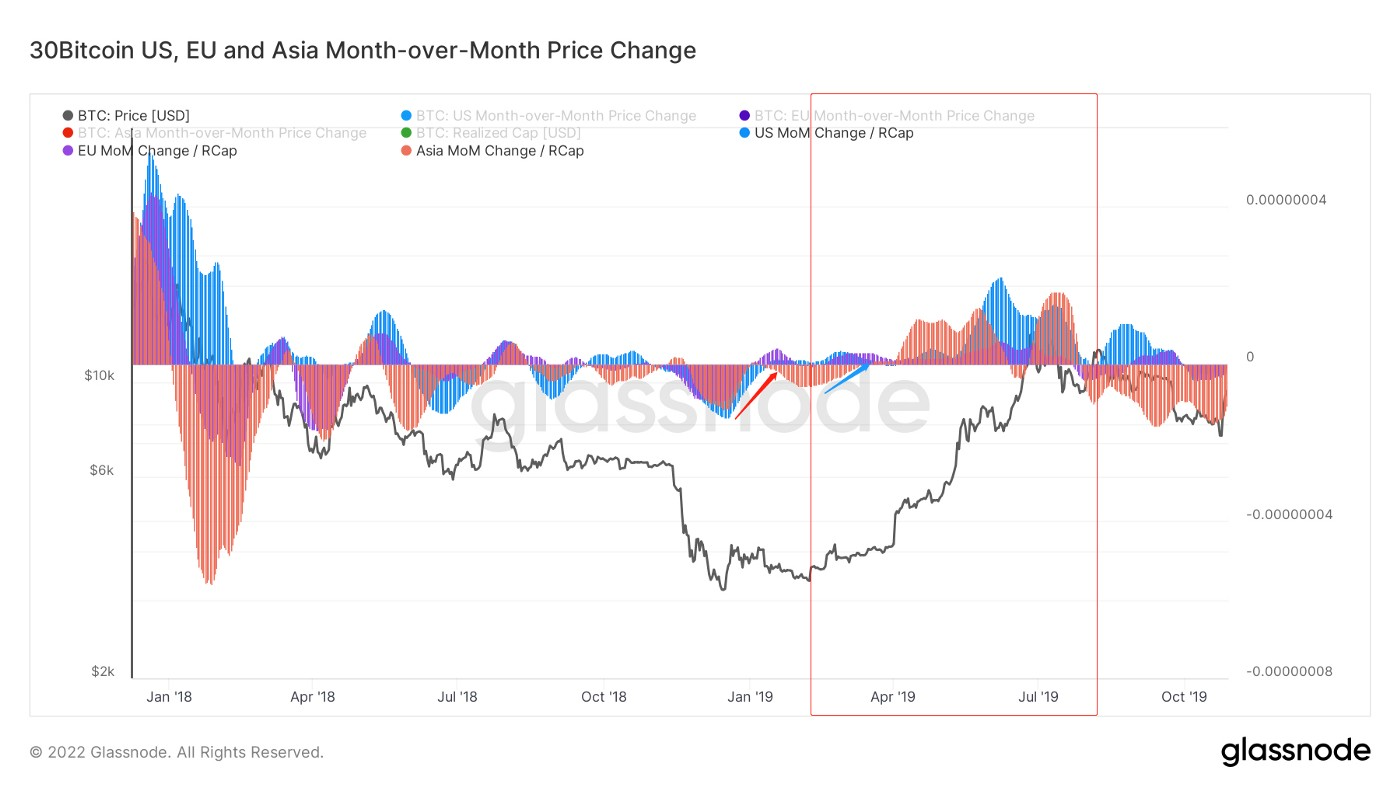
European and American time zones and Asian time zones at the same time resonance buy.
As you can see from the red box, the market then entered a right side up phase.
(Figure below: Global time zone profit and loss)
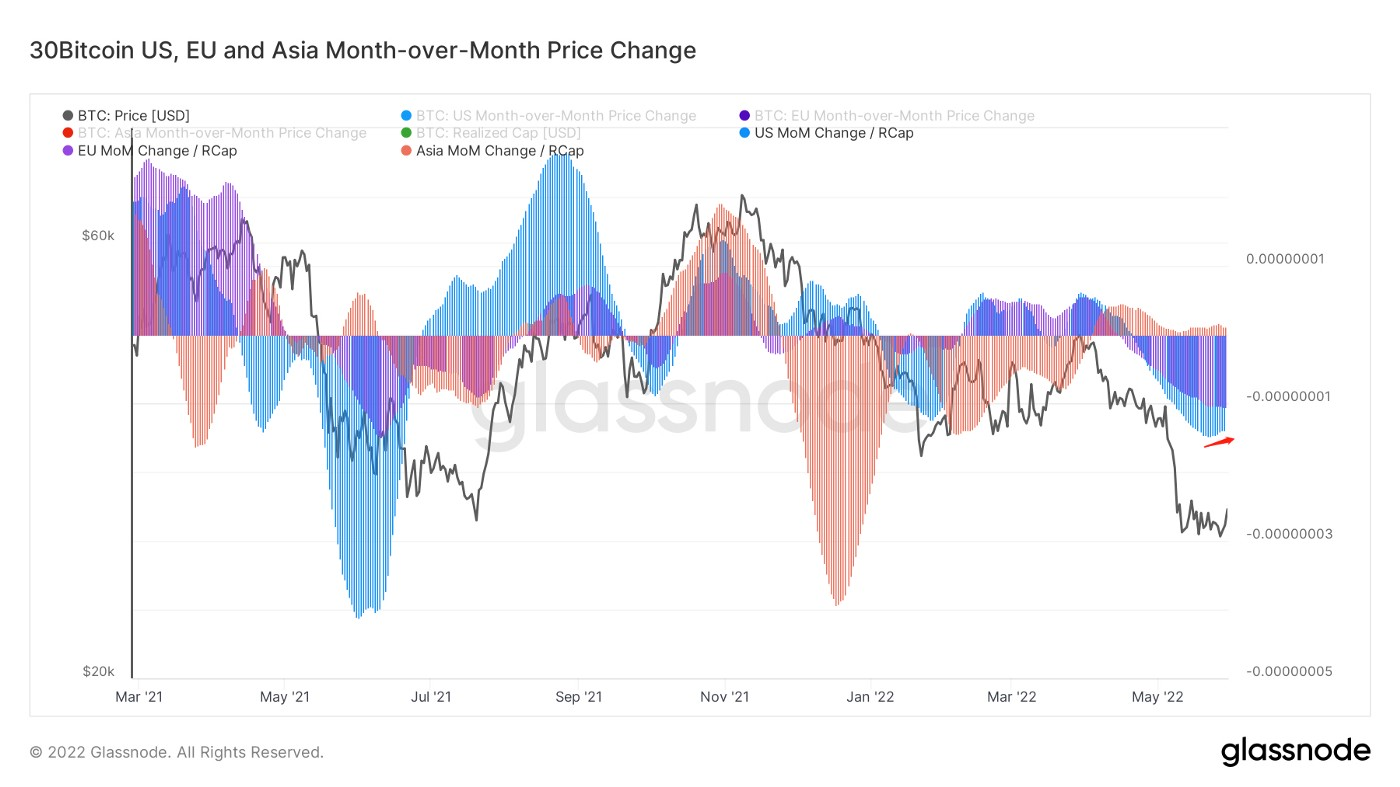
Currently, Asian purchasing power is still increasing.
Europe and the United States time zone purchasing power, began to slow the pace of selling.
Mid-term Probe
- No. of Active Addresses
- NVT Price Model
- Stablecoin/Bitcoin Market Cap
- Stablecoin Supply
- Long-term Inflation
- Age Matuation Bands
- Illiquid Supply Ratio
- Address with Balance >=1BTC
- Address with Non Zero balance 30day Change
- Wales’Unspent Supply
- Miner Net Position Change
- Hodler Net Position Change
- Long-term Holder Net Position Change
Let’s look at the basic state on the chain.
(Below : number of active addresses)
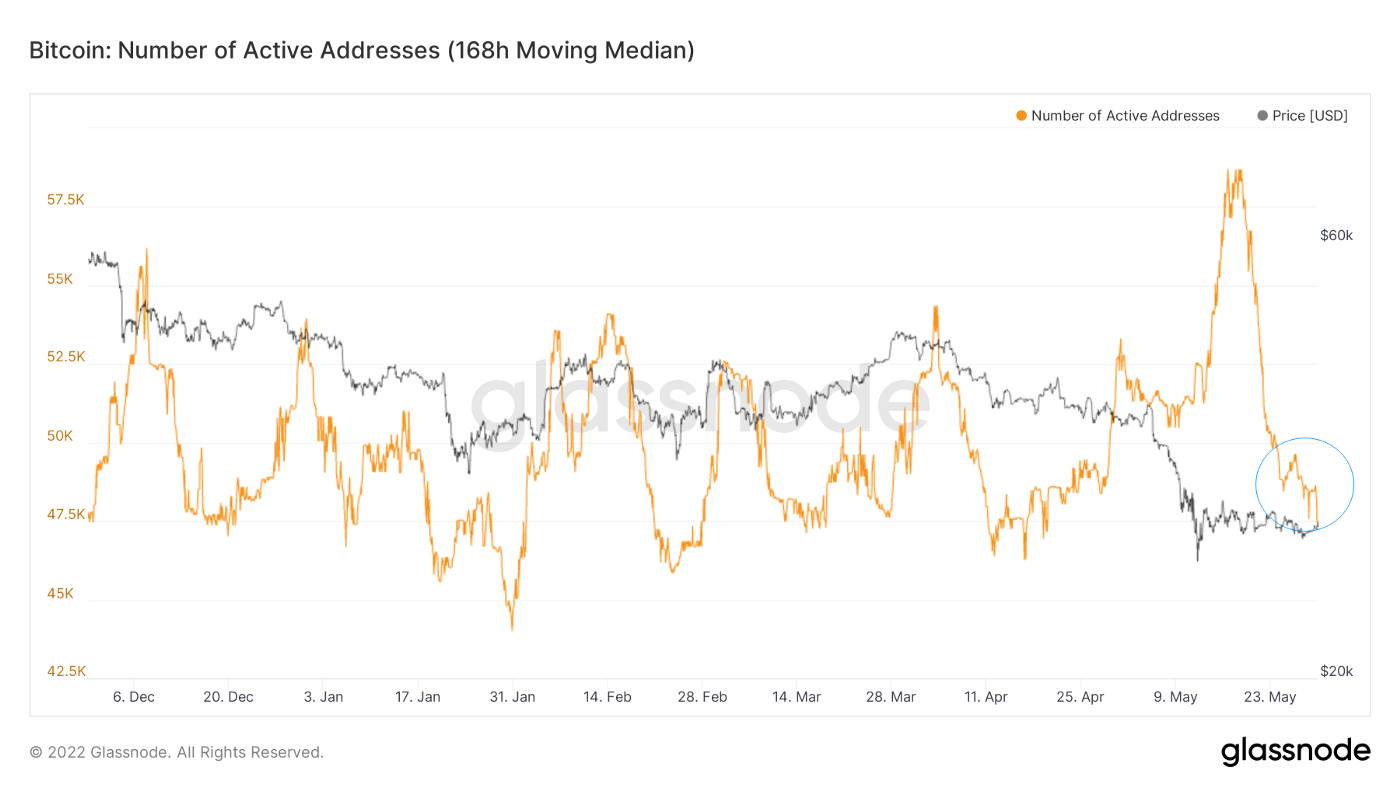
The number of active addresses is currently hovering at a low level.
Overall activity on the chain still needs to be fixed.
Take a closer look at activity.
(Figure below: network initiative)
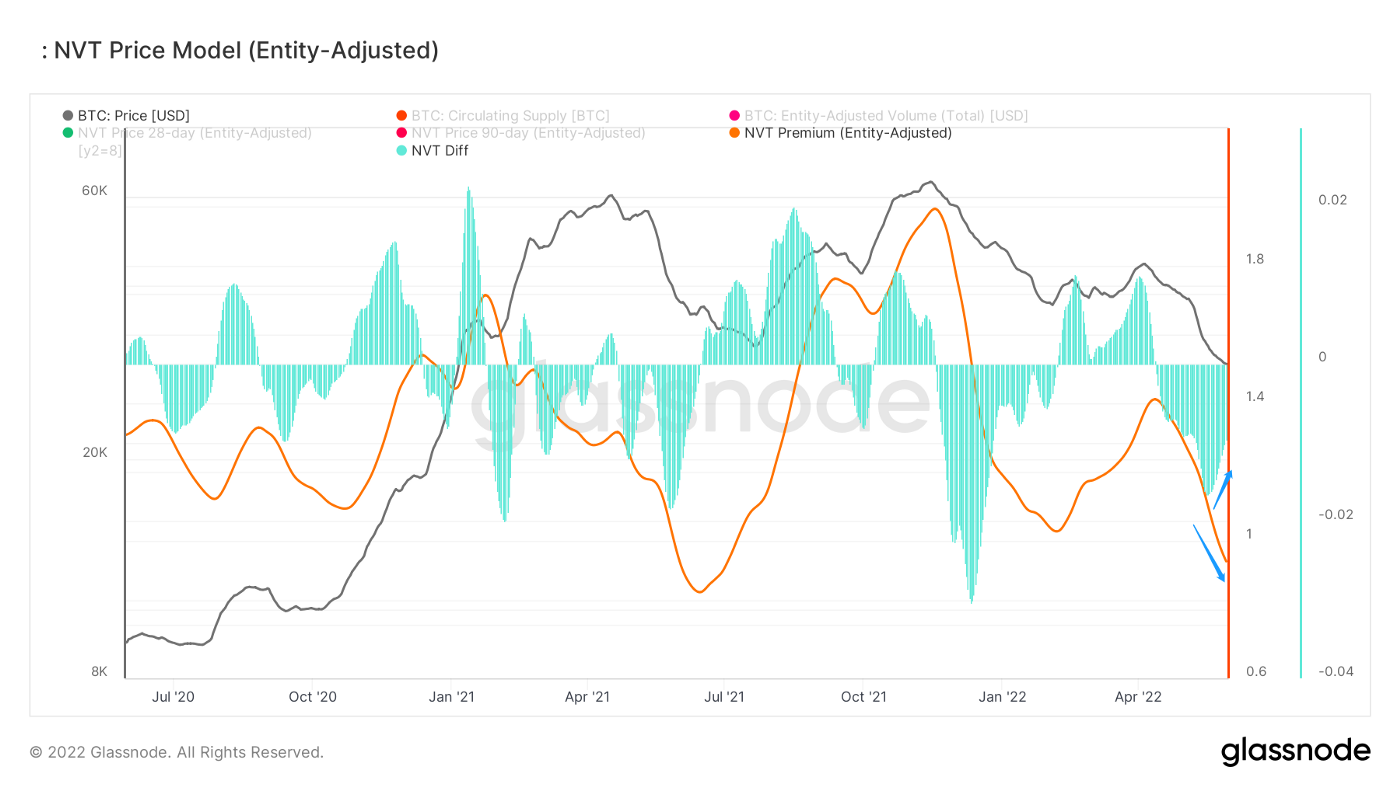
Present as network initiative.
The blue line is the change in slope.
Measure active activity on the chain as a reference to active status.
Network enthusiasm is still in the downward channel, but the slope changes slightly narrow.
Means that the current activity of the market risk has slowed down.
Now look at the stablecoin.
(Figure below: ratio of stablecoin to BTC market value)
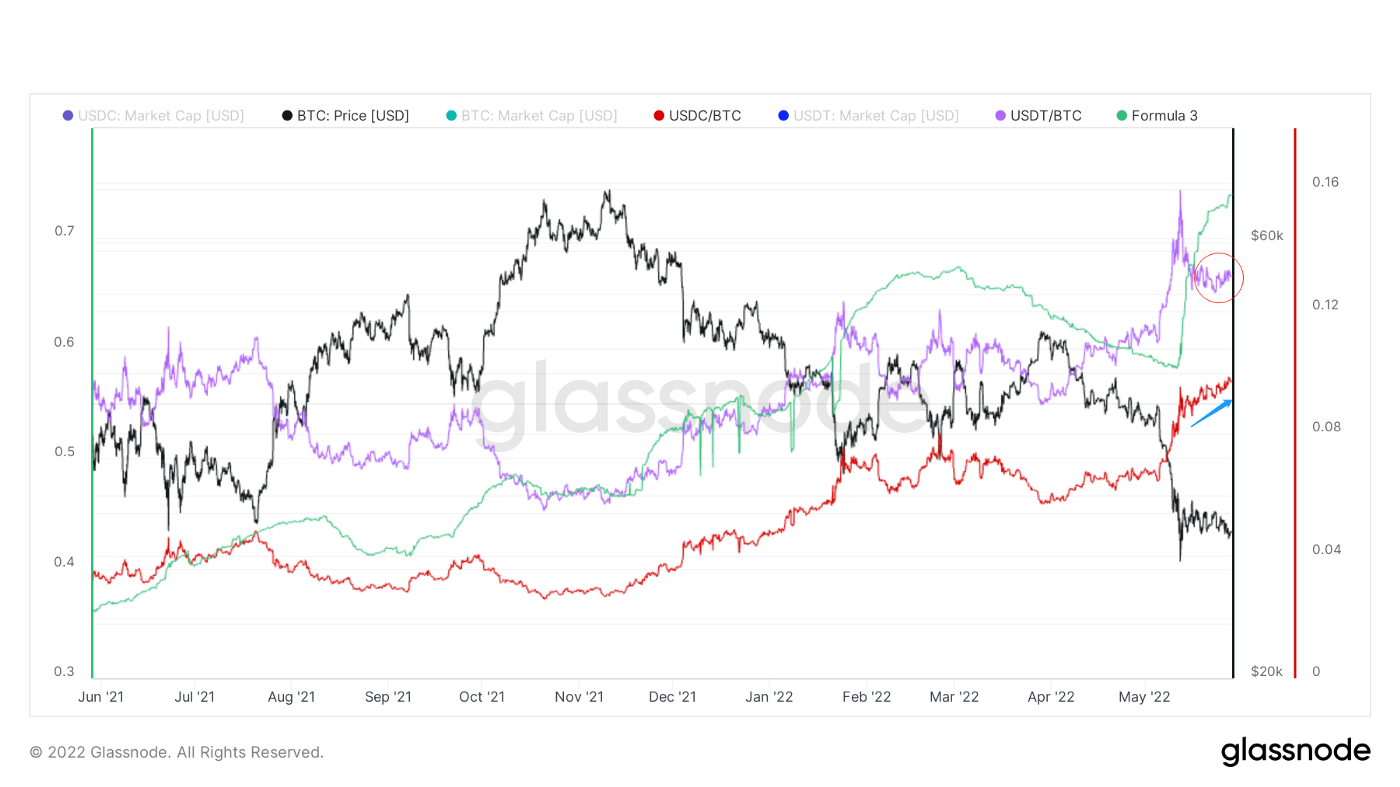
All activities in the market are inseparable from stablesoin, so it is extremely important to observe the change trend of stablesoin.
Recent observations:
1. The market value ratio of USDC to BTC is gradually rising; The market value ratio of USDT and BTC, however, shows a declining trend.
2. The blue line is the market cap ratio of USDC to USDT, which is showing slight signs of slowing down but still rising slightly.
(Figure below: stable currency circulation supply)
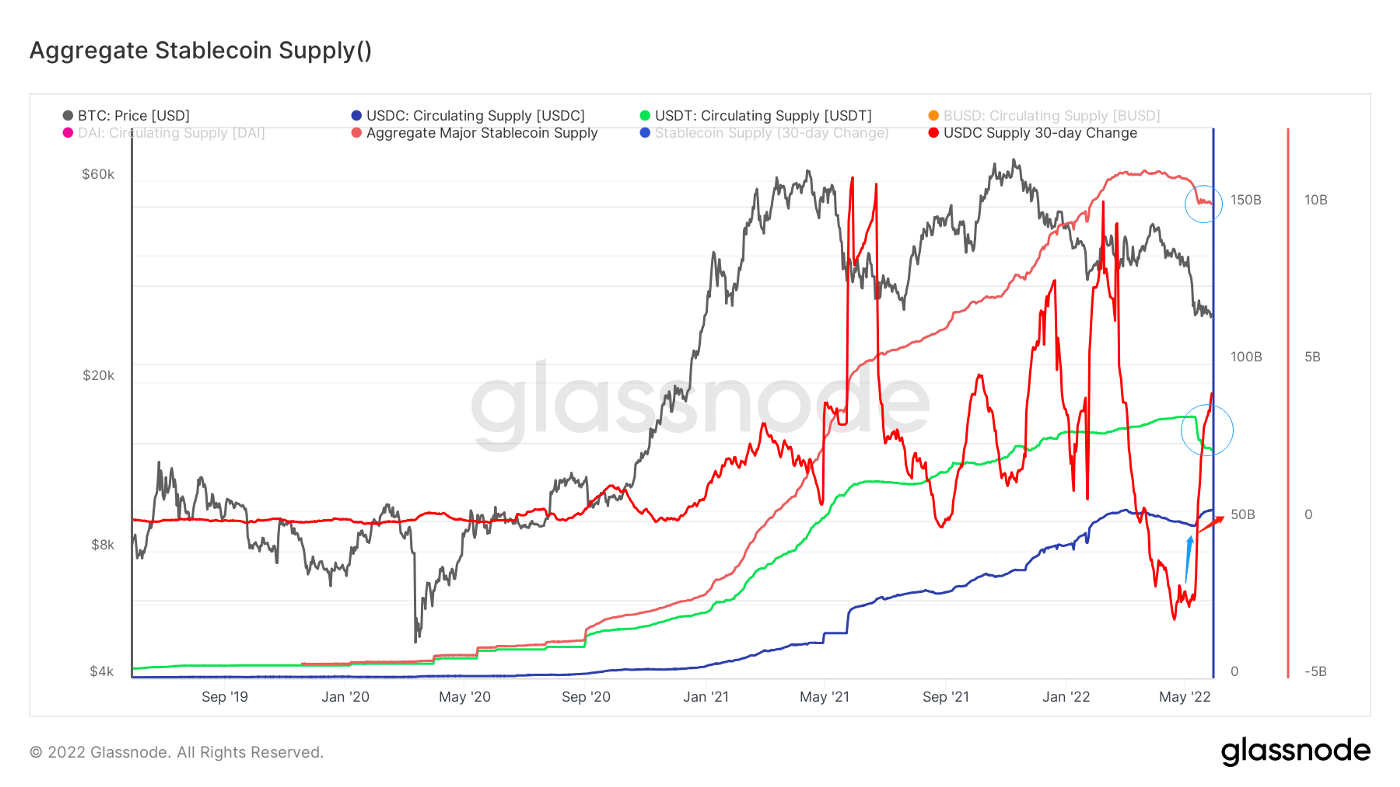
Stablecoin circulation indicates that the previous capital outflow is now on hold.
Combined with the net position of stablesoin (jump to “short-term observation” in the data graph on the detailed chain) :
USDC circulation increased, there is also a certain amount of inflow to the exchange, may be the market to catch the bottom of the fund.
USDT circulation is down, and fewer coins are flowing into exchanges.
(Long-term inflation chart)
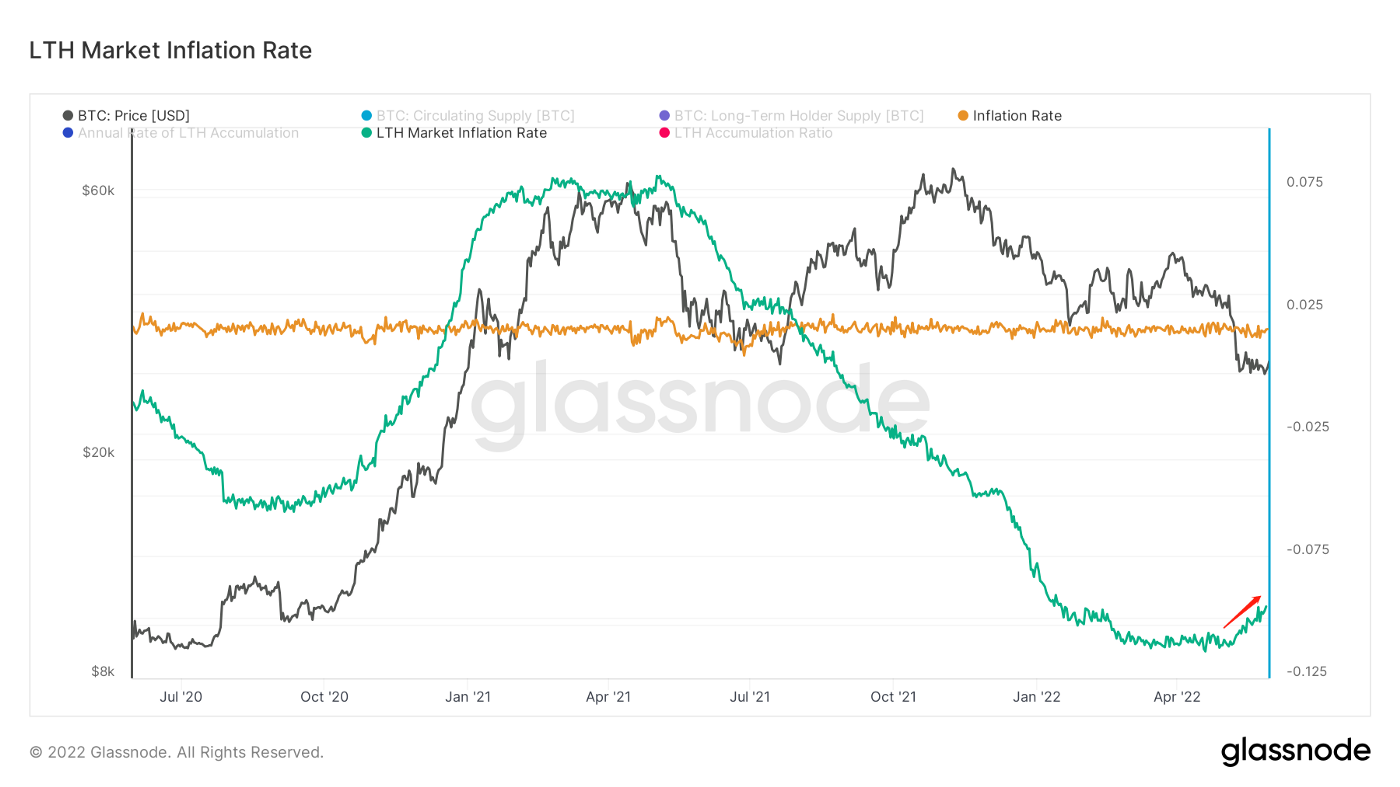
Long-term inflation is still rising.
There are some signs of rising inflation in the market.
(Below: age and maturity zone)
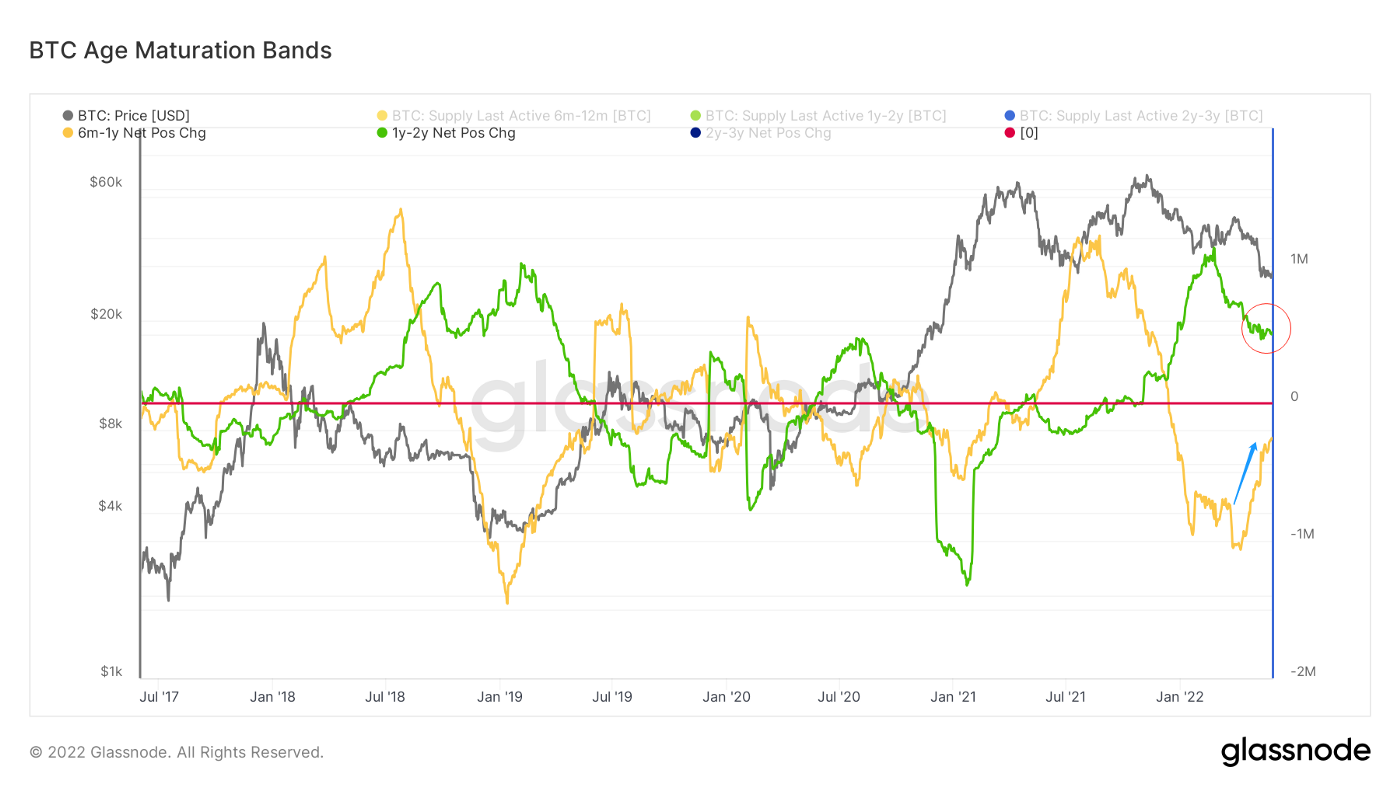
In terms of age maturity zones,
The 6 — month — to 1-year bear builders are still adding quickly.
1–2 year traders are leaving at a slower rate.
Ease market pressure slightly.
(Figure below: illiquid supply share)
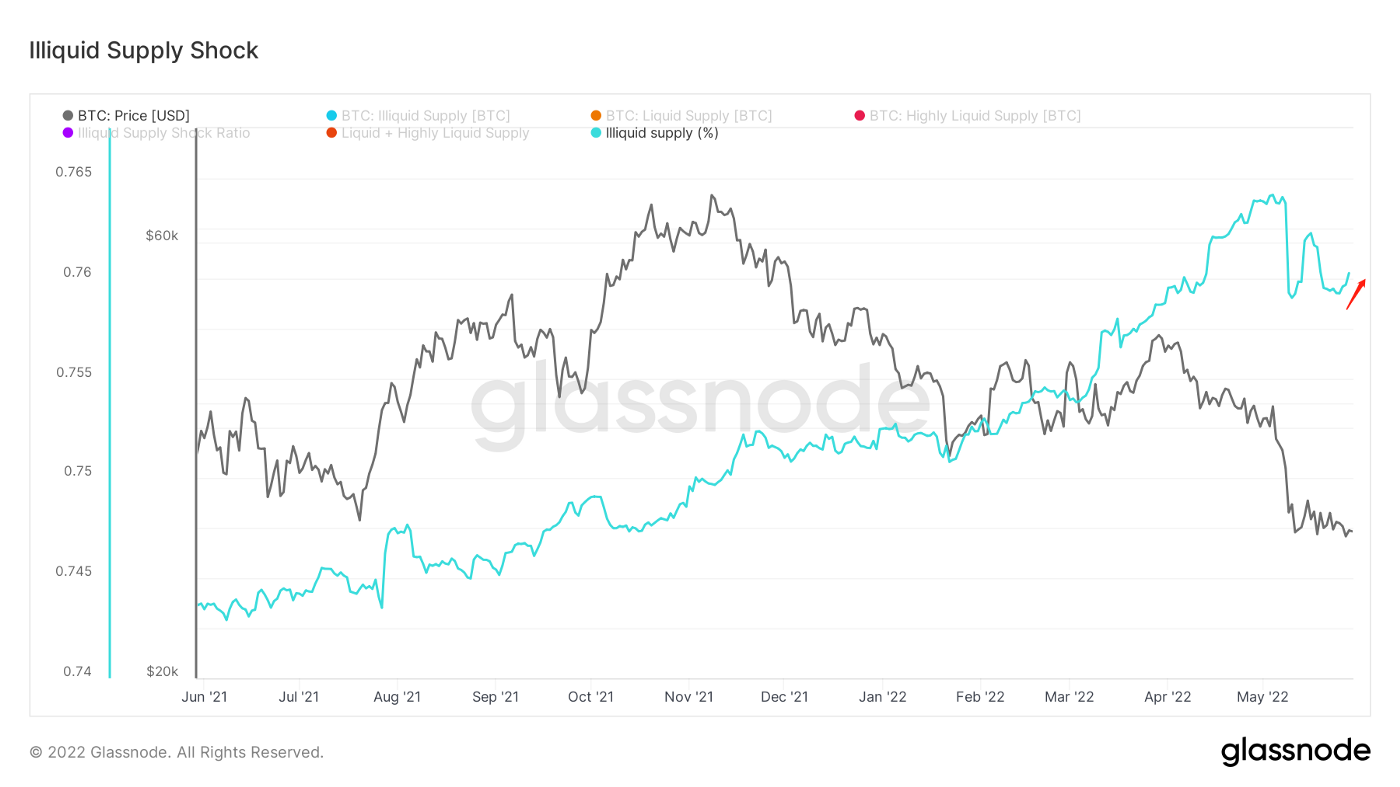
The proportion of illiquid supply is rising again.
Now look at the percentage of decline before a slight slowdown.
(Figure below: the number of addresses above 1BTC in the)
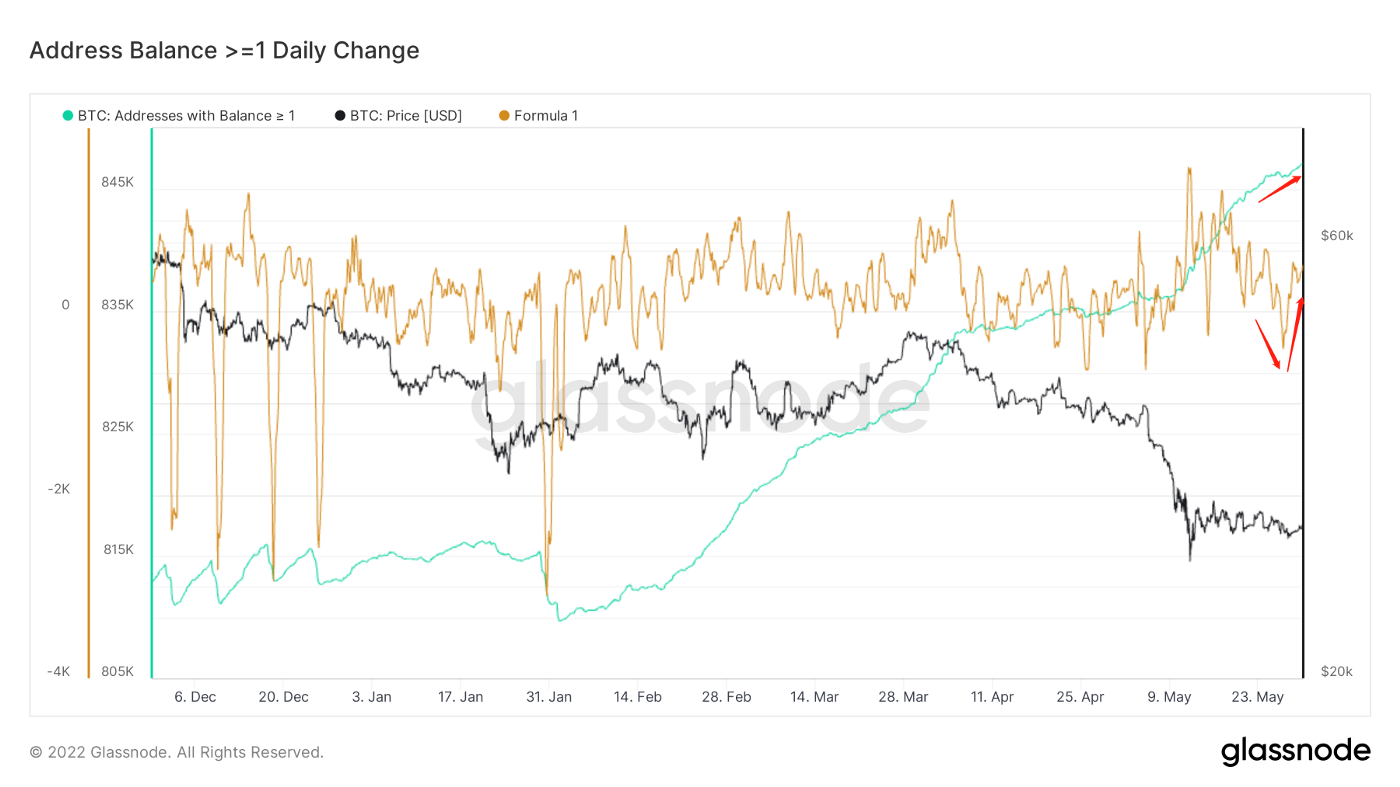
The number of high-quality addresses is showing a slight increase at present. Due to the slow growth rate and insufficient trend of time accumulation, it is judged that no significant trend has been formed.
(The figure below shows the change of addresses with non-zero balance in 30 days)
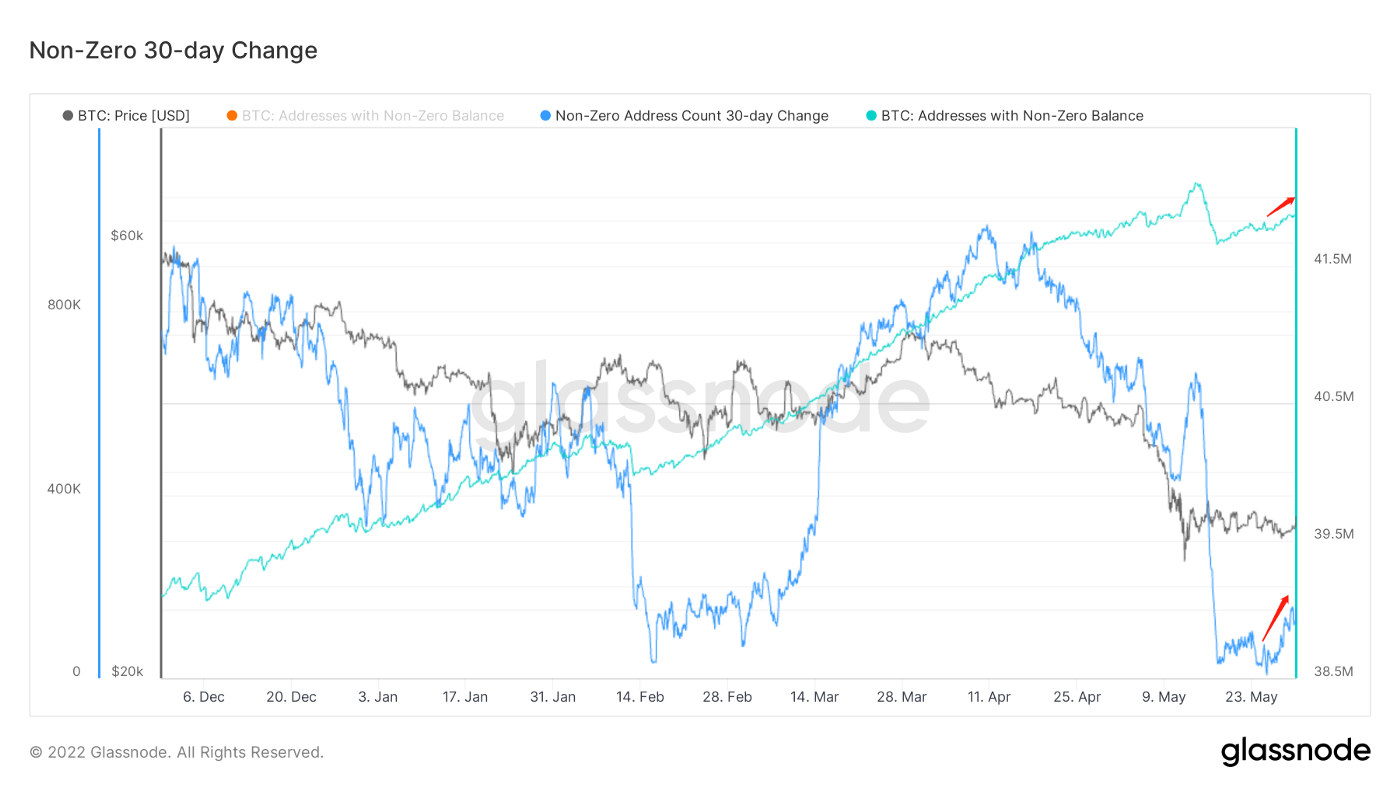
The change in slope is more pronounced, it’s going up a little bit.
May reflect the recent entry of new users.
But on the whole, the number of non-zero balance addresses increased less, and it is more inclined to repair the entry speed of new users.
(Figure below: Whales unsupplied)
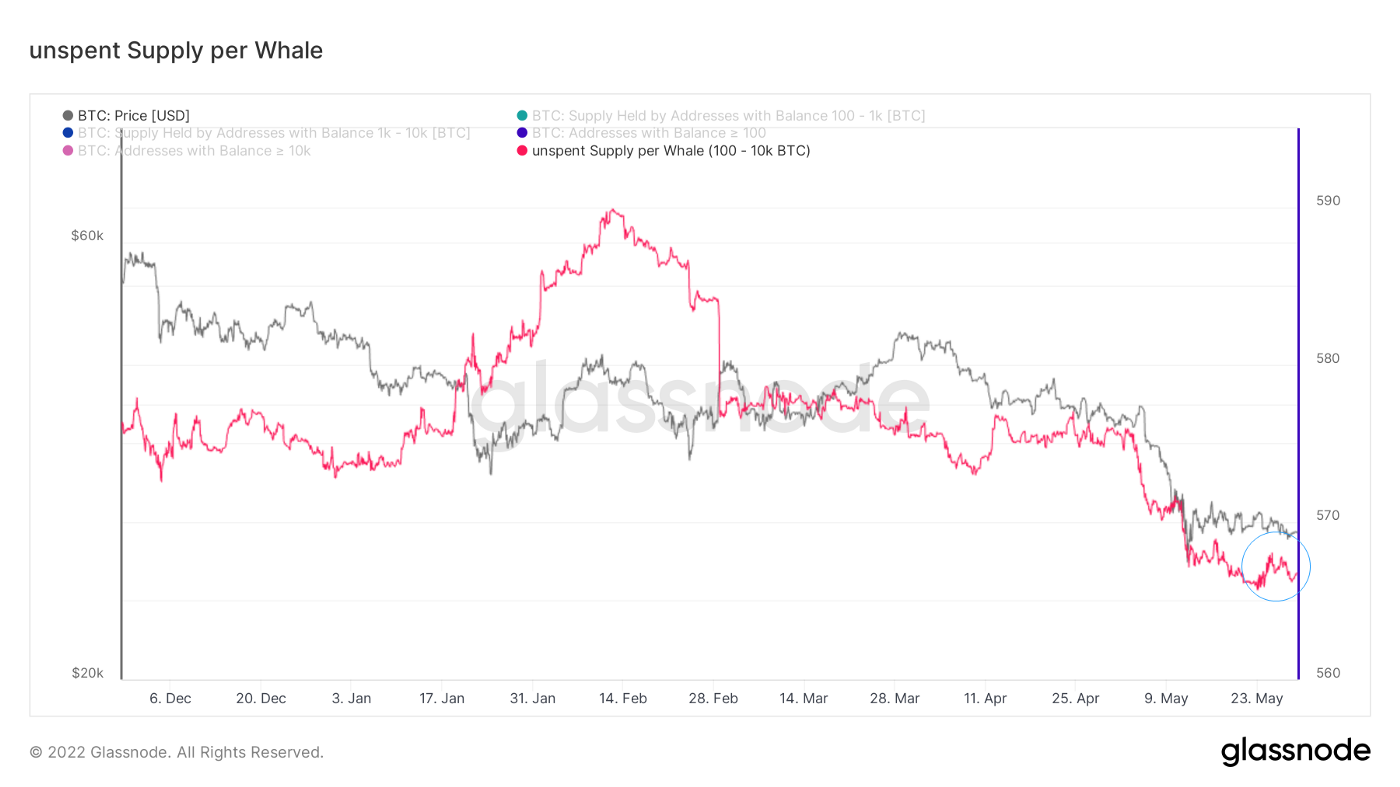
Still hovering at the bottom, but a slight slowdown in sentiment.
(Below: net position of miners)
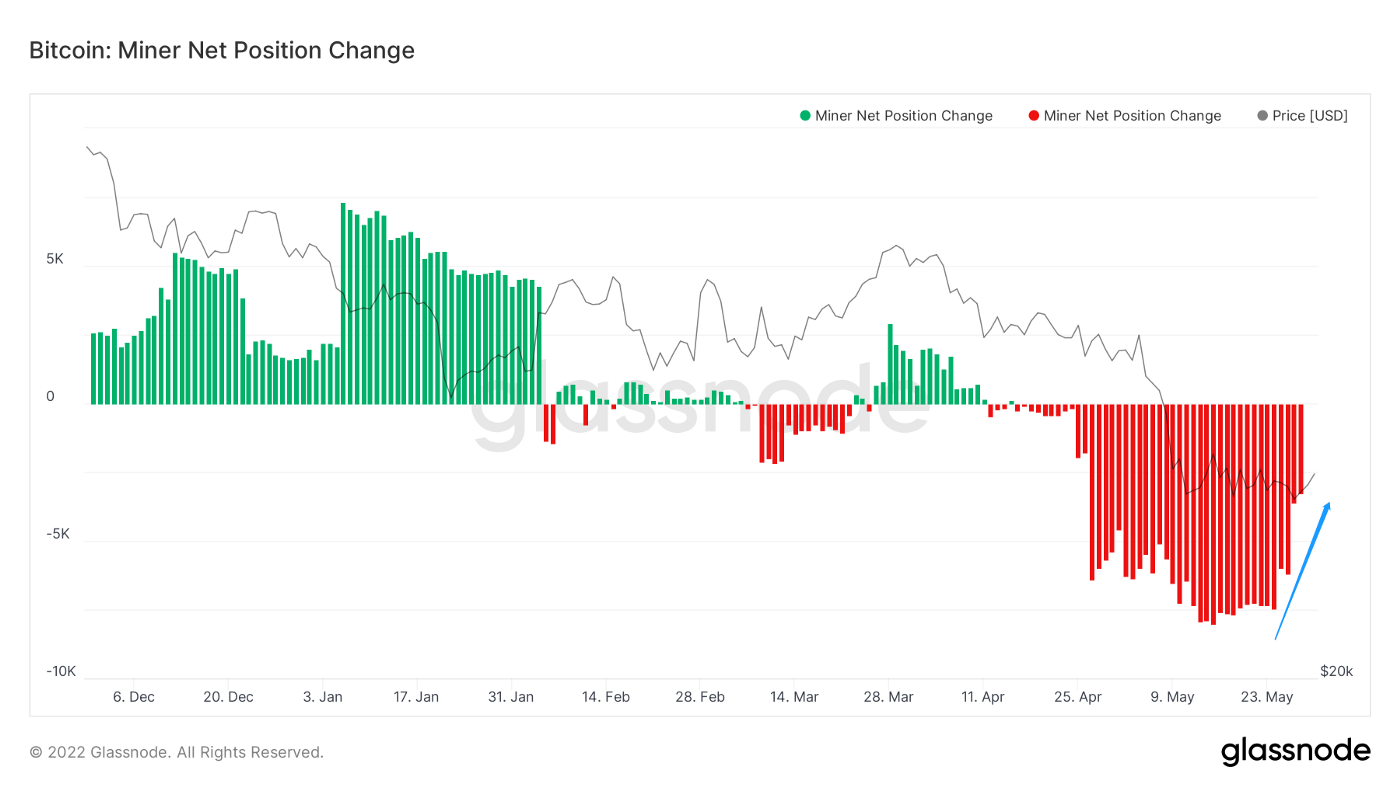
Miners’ holdings narrowed slightly.
(Below: Hodlers net position)
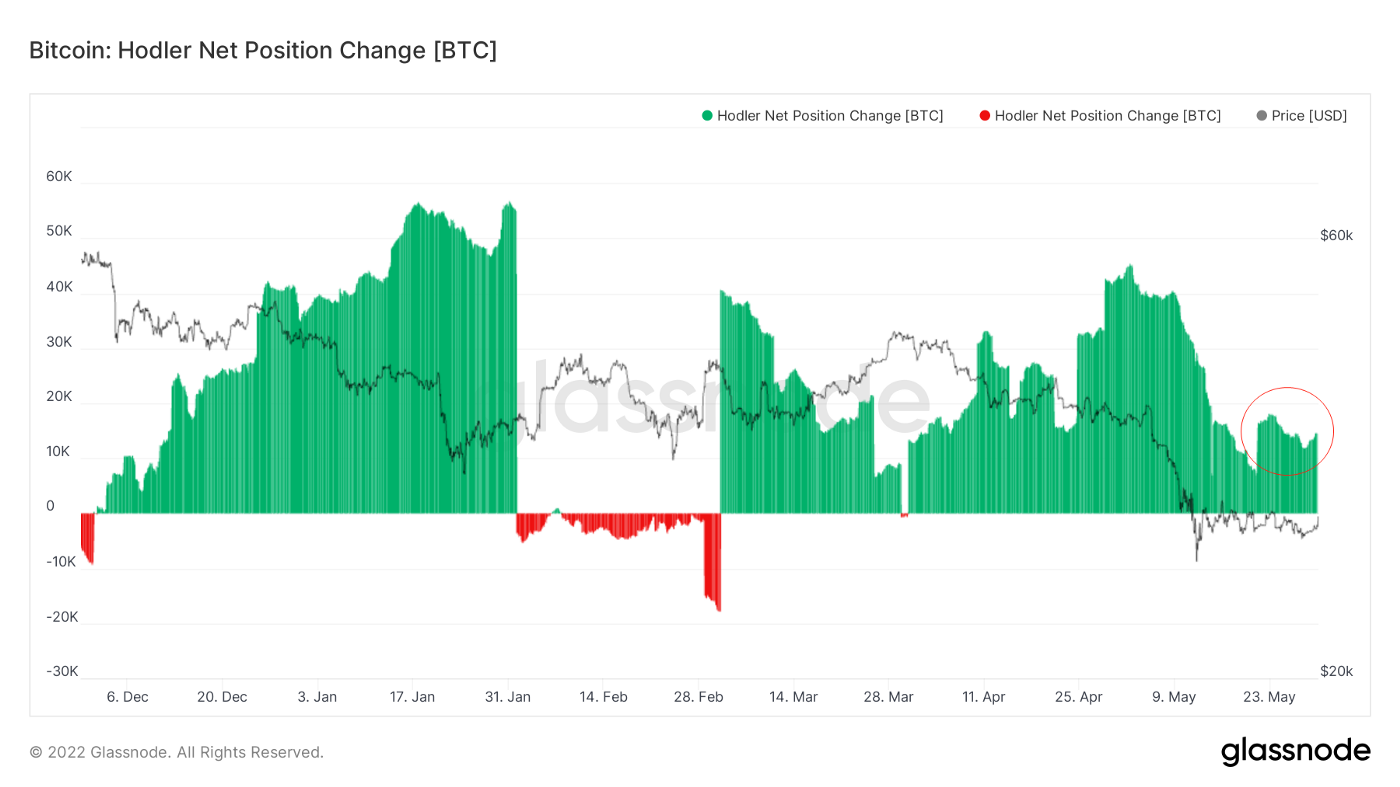
Hodlers net-position state, still wandering in the in the state of positive increase.
(Chart below: long-term trader net position)
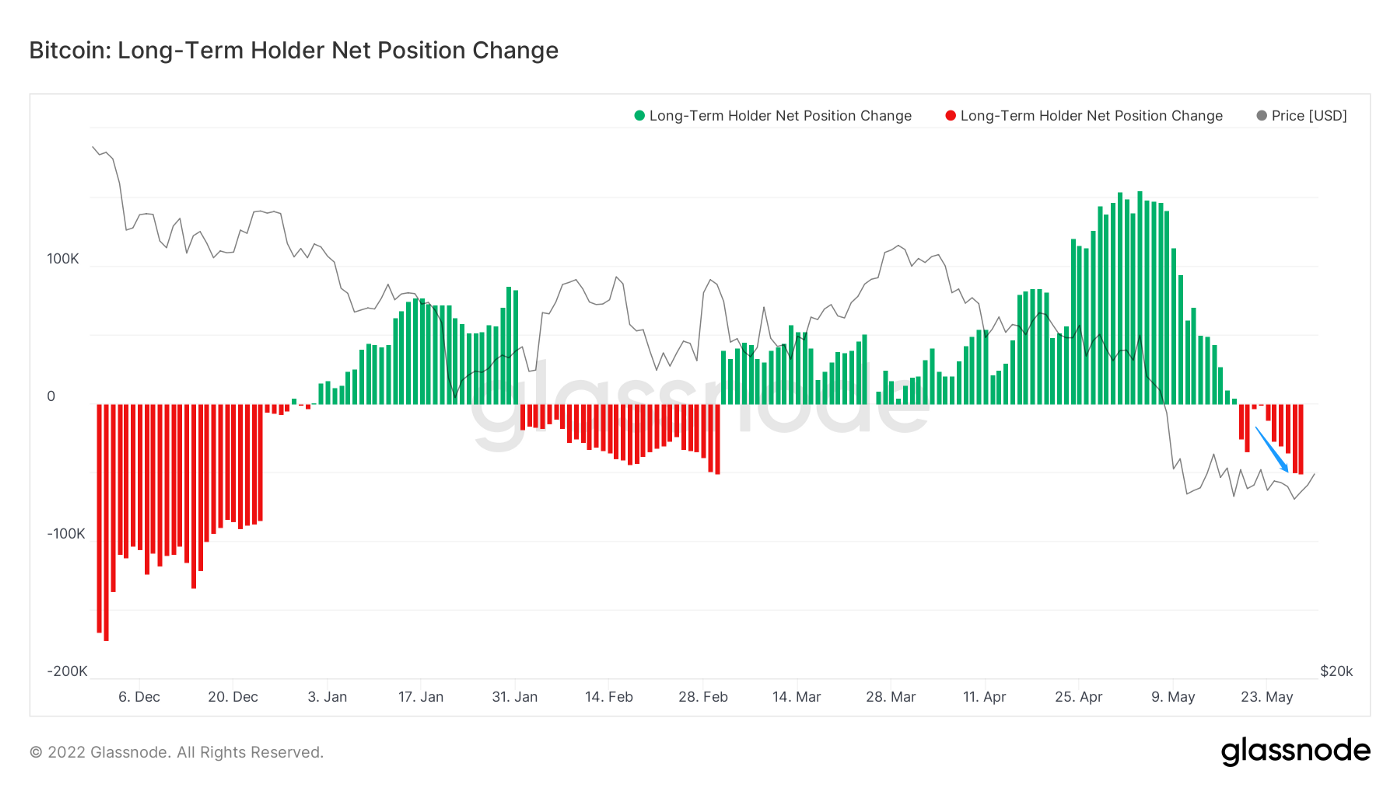
Long-term traders have reduced their holdings.
Short-term Observation
- Futures Open Interest Perpetual
- Perp OI/ Market Cap
- BTC Option Volume
- Options Open Interest Put/Call Ratio
- Long Liquidation Dominance
- Contract Liquidation
- Total Supply by Long-term Holders
- Illiquid Supply
- Realized Cap HODL Waves
- Profit and Loss Transfer
- CDD
- BTC Exchange Netflow
- No. of New Addresses
- Stablecoins on Exchange
- Stablecoins Netposition
Derivatives Market:
(Figure below: Futures Open Interest)
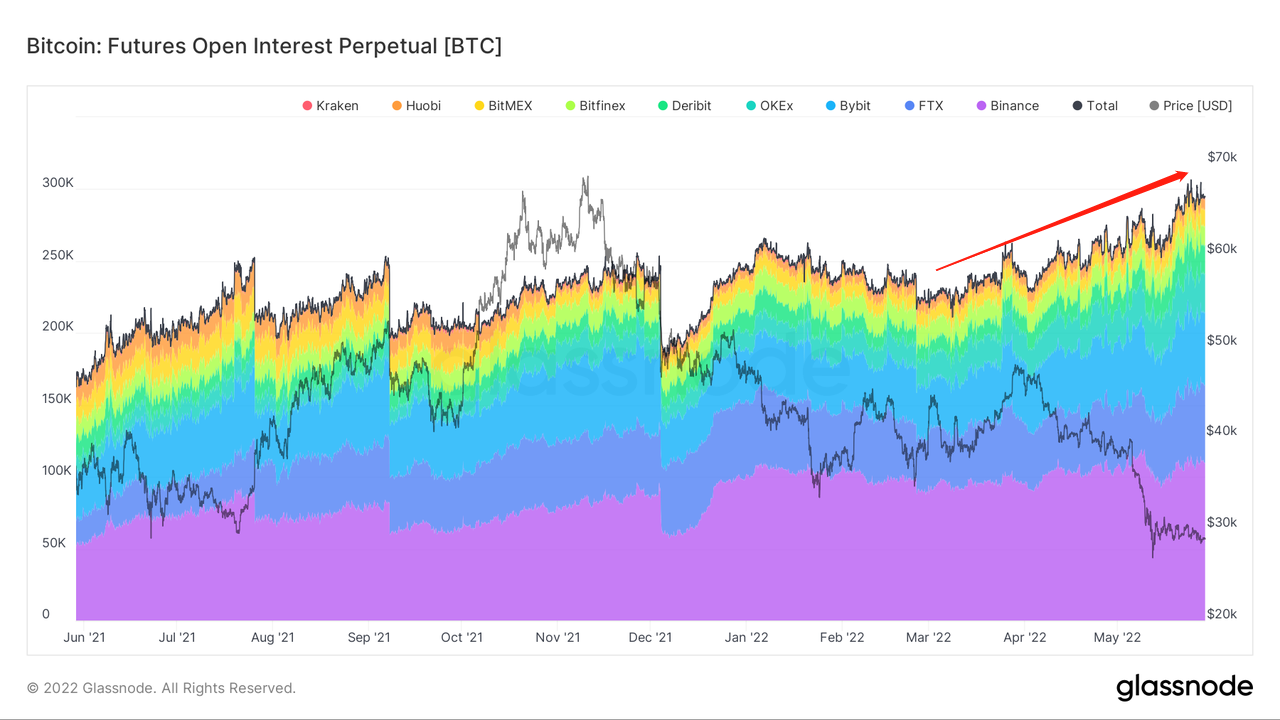
Open interest continues to reach new highs for reasons mentioned in last week’s weekly report.
At present, large amount of capital hedging market risk, and some users “bet” mood is too serious, inject potential leverage risk for the future market.
In the current unstable market, high leverage participation in the derivatives market should be avoided as much as possible to avoid losses caused by high volatility.
(Figure below: Ratio of open interest to market value)
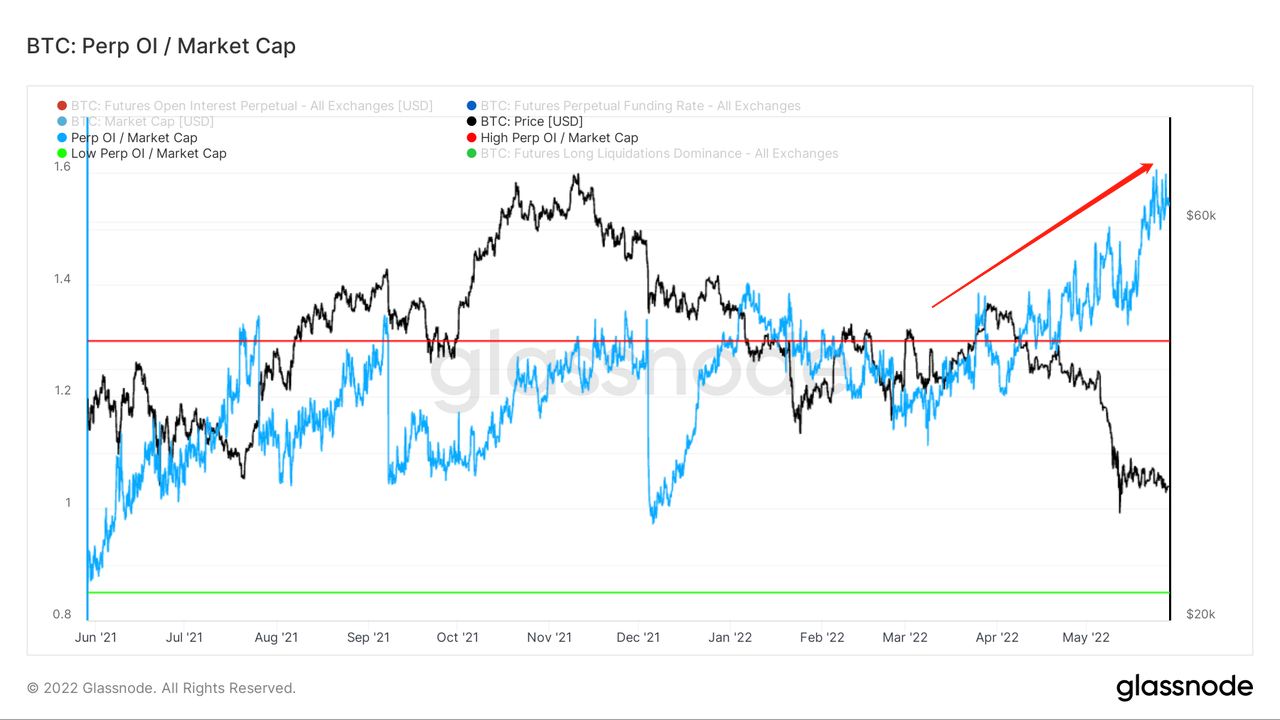
The ratio of open interest in perpetuity futures to market value is at an all-time high.
The volume of derivatives has reached an unprecedented height, relative to the volume of market capitalization, derivatives may become the next dominant market factor in the short term.
(Figure below: total position of BTC option trading)
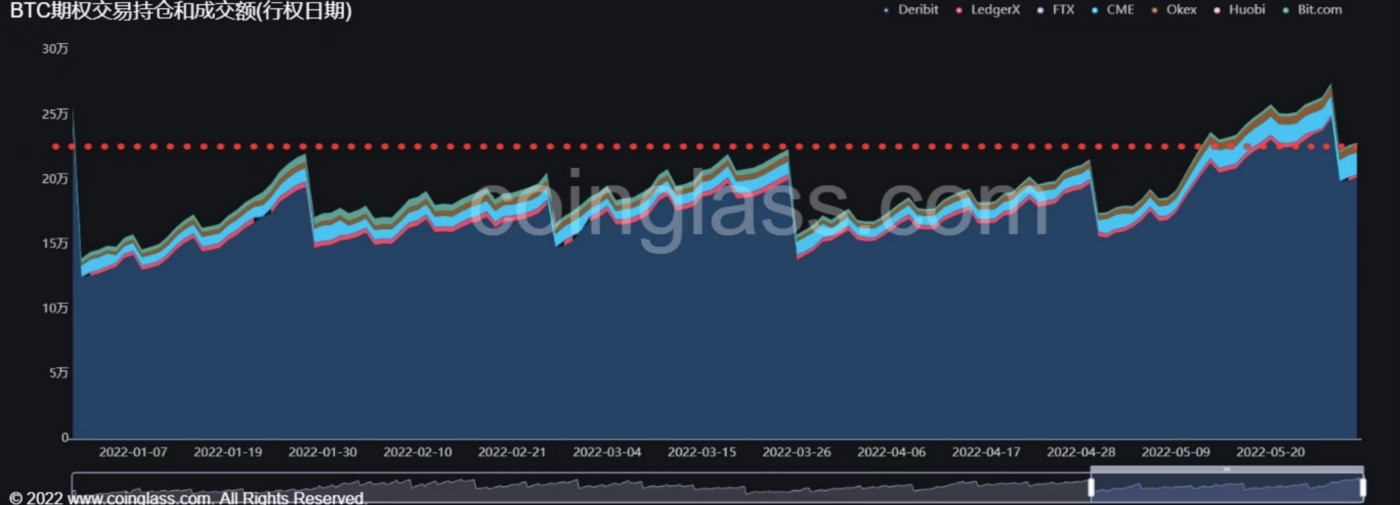
Total options holdings are at a relative five-month high.
Options trading is usually mostly done by mature traders with some experience of the market.
(Put/call ratio of options below)
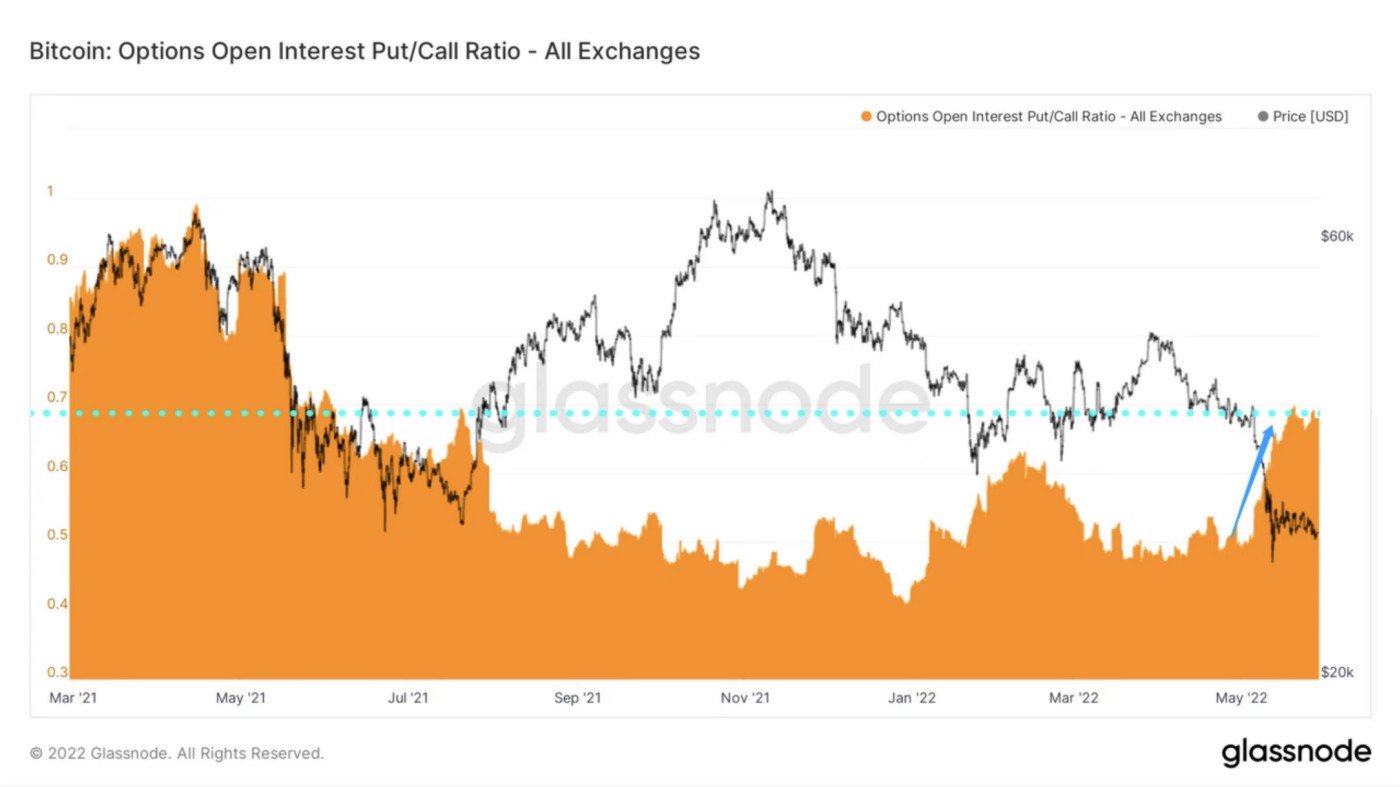
The ratio of puts to calls of this rising total option exposure climbed to a height just below 519.
Mature traders add put protection to hedge against further downside risk from future uncertainty.
(Chart: Long liquidation dominance)
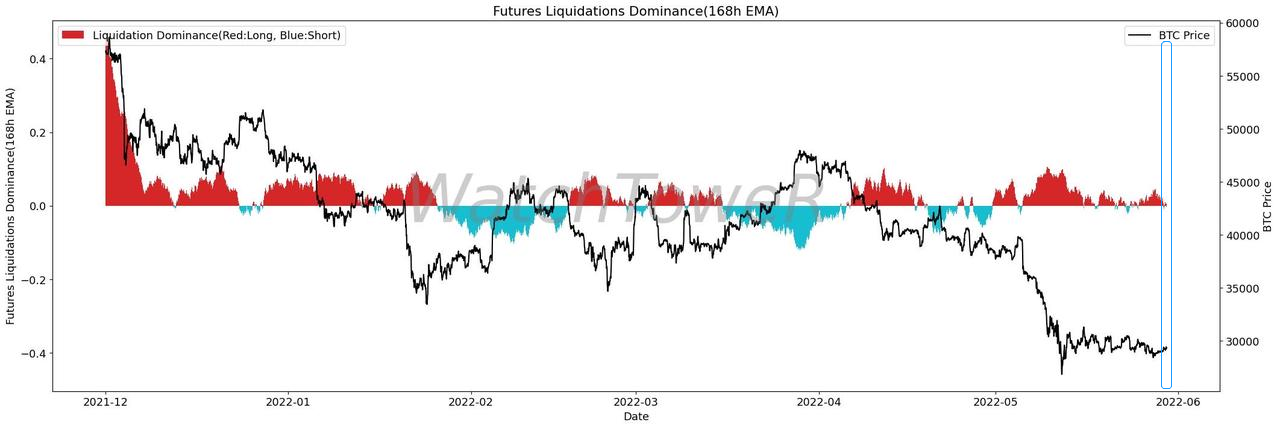
Long short liquidation tendency is not obvious, the market may be in a delicate equilibrium state.
Later can pay attention to the change of the data, used for derivatives trading decisions of.
Special disclaimer: Long clearing advantage for WatchToweR exclusive database.
(Contract settlement chart below)
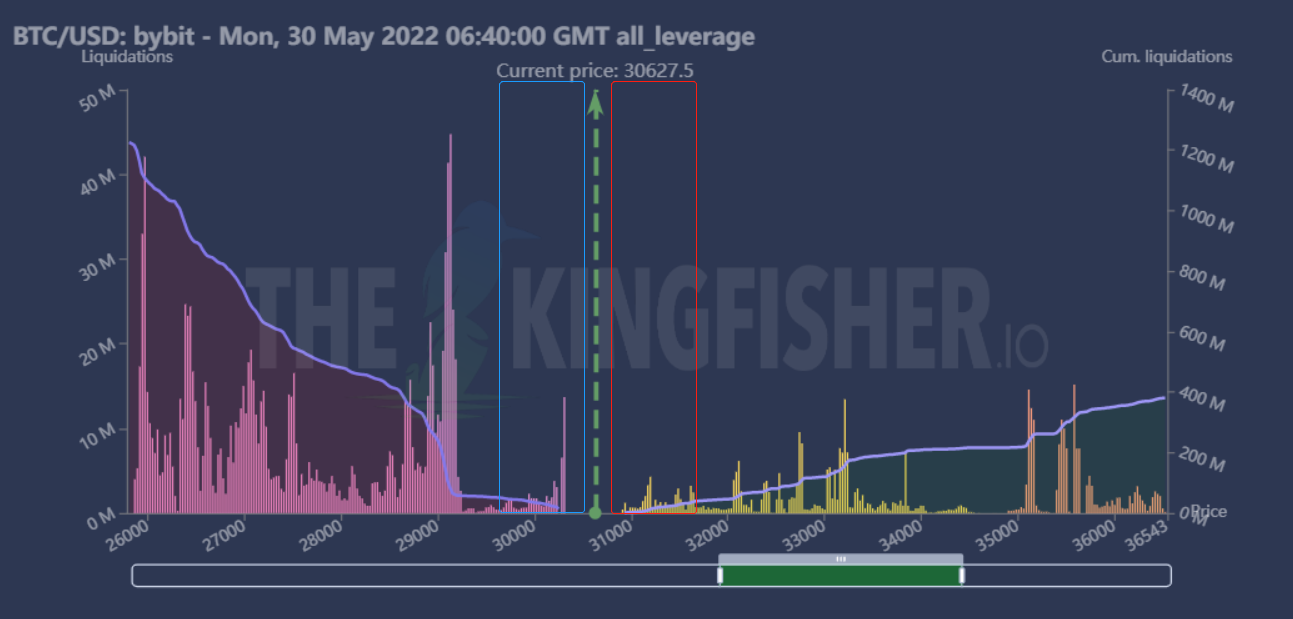
Blue: Partial long money
Red: Partial short funds
There is a certain amount of long and a small amount of short in the immediate vicinity of the current price, and you need to be aware of the derivatives risk in the short term market, which can bring volatility up and down.
If the current price is near, and closely related to the point of the participants should pay attention to the risk.
Go to the spot market
Selling pressure:
(Figure below: Total supply for long-term holders)
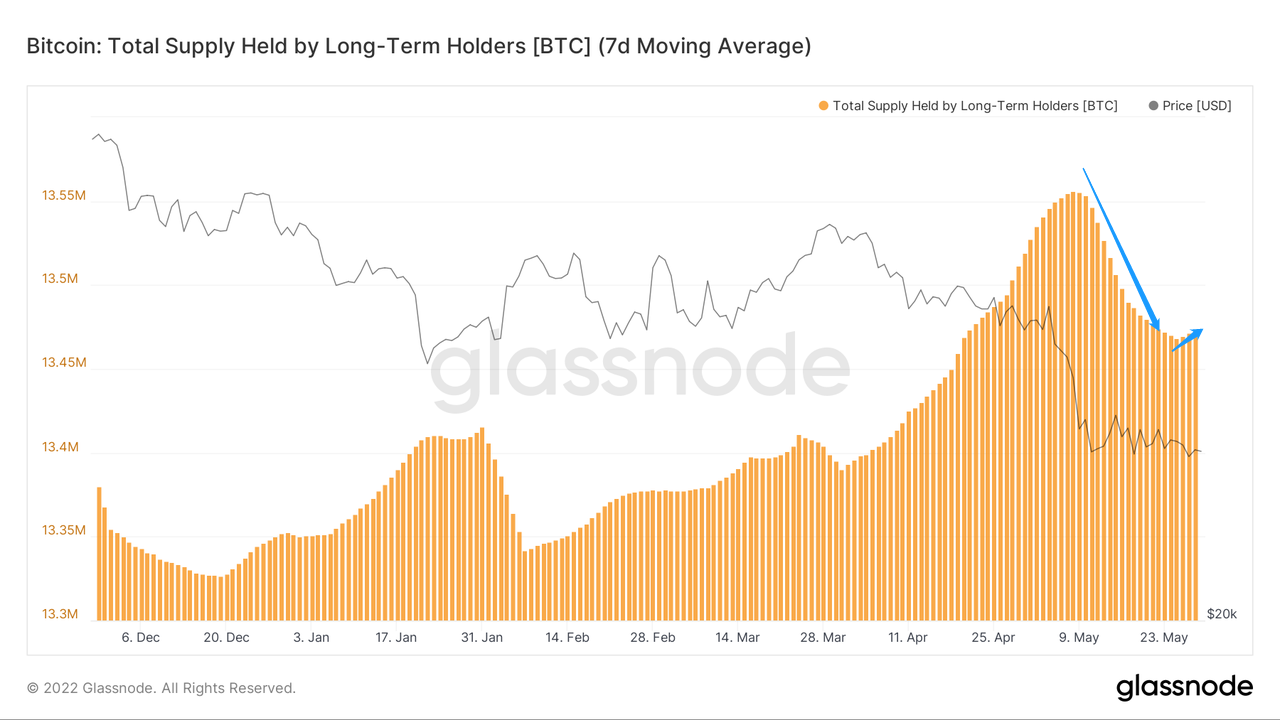
Long — term traders currently reduce the extent of selling, and there are signs of a slight increase in holdings.
This part of mature traders temporarily increased the strength of the market, temporarily reduced the pressure.
(Chart: illiquid supply)
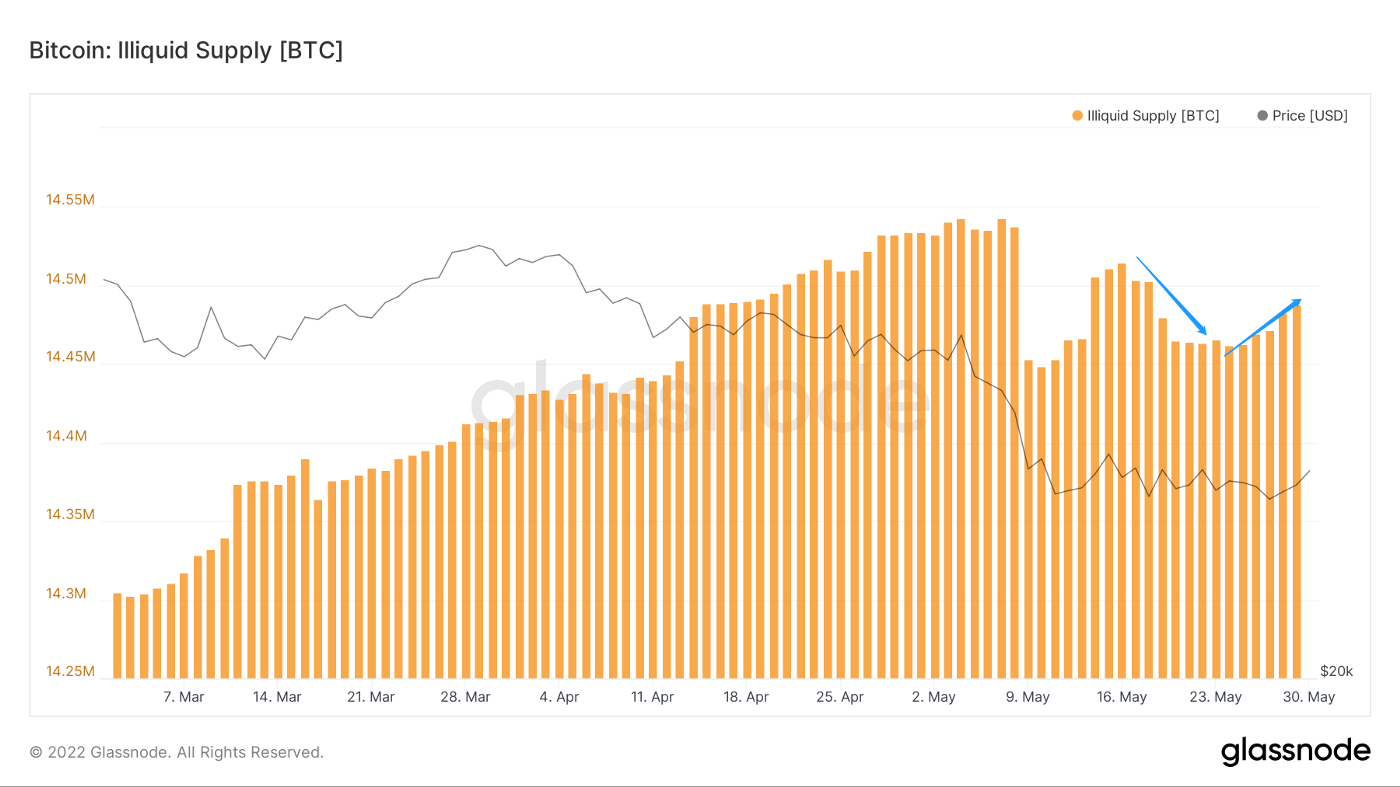
The illiquid supply group of has increased slightly in the recent past, and the attitude of the important groups in the market has changed temporarily, which does not mean the signal of market reversal, but can only represent a temporary drop in pressure in the short term.
The above two important mature groups have temporarily eased the selling pressure, and there is initial undertaking strength, which needs to be paid attention to later.
(Age distribution has been realized in the figure below)
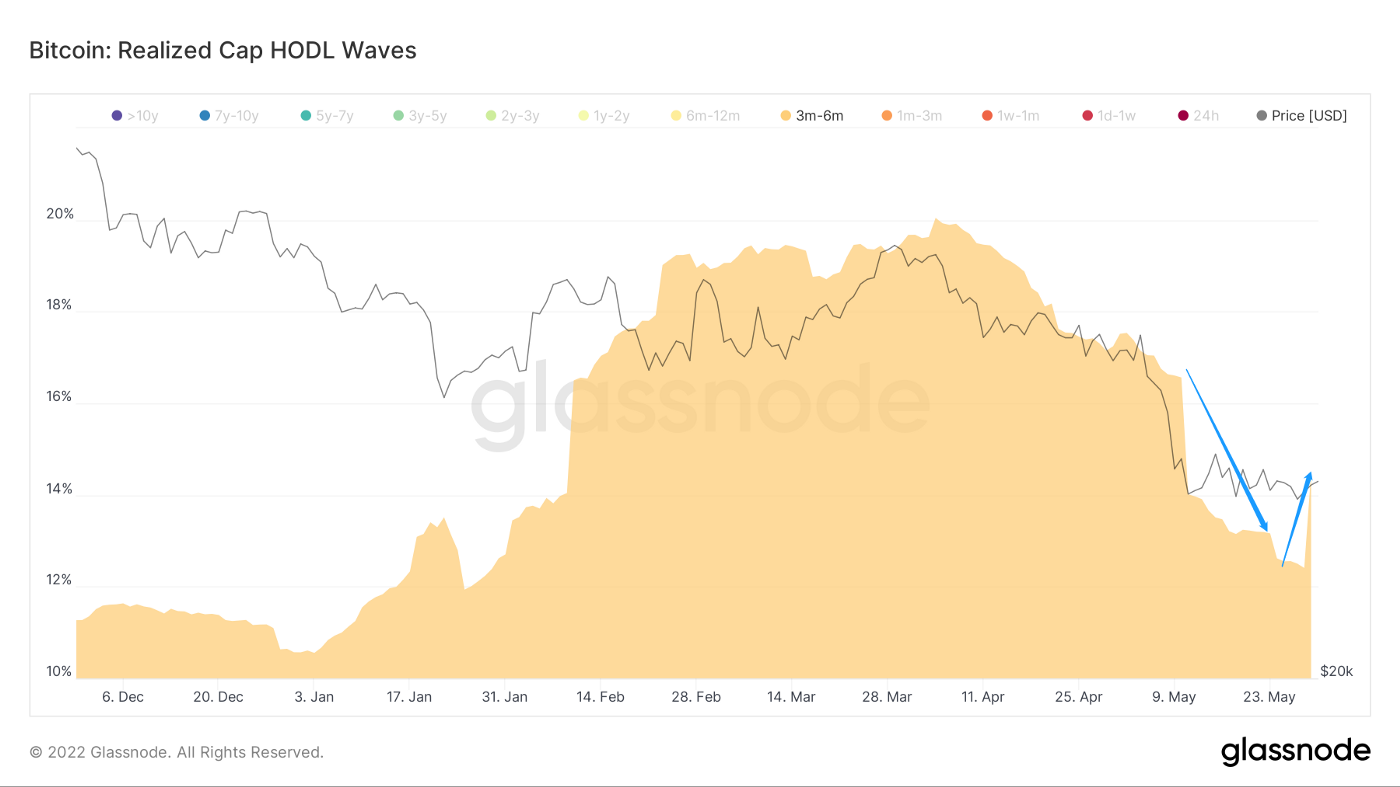
The main selling group among short-term traders is those who hold for 3–6 months.
At present, this part of the group appears certain signs of rapid increase, short-term traders also appear certain to undertake strength, which is a good signal.
(Profit and loss transfer in figure below)
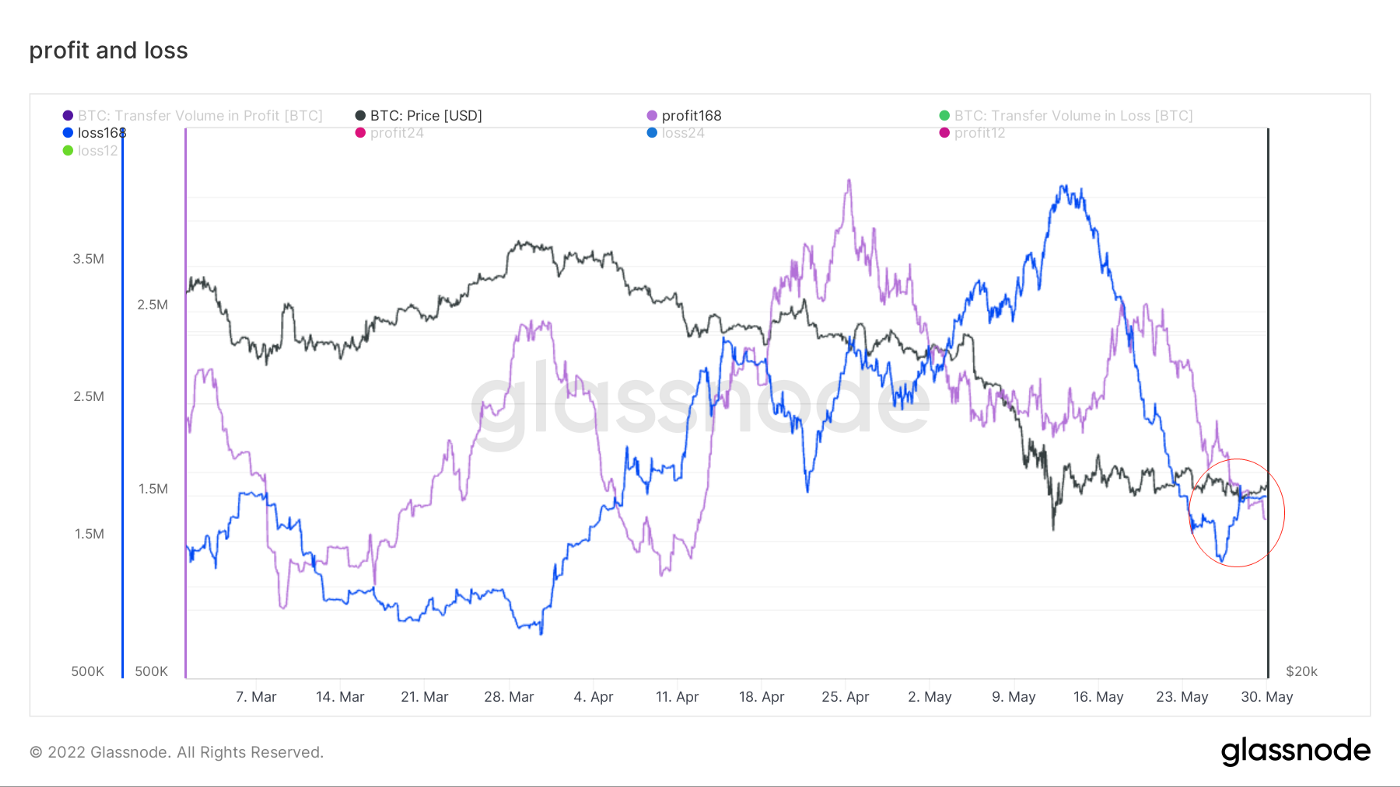
Blue: 168h loss transfer amount
The market loss selling range rose slightly after the temporary slowdown, which represents a temporary slowdown in the market loss selling sentiment.
However, it remains to be seen whether the losses will further widen, as widespread panic will likely amplify the impact on the market.
(Figure below:CDD)
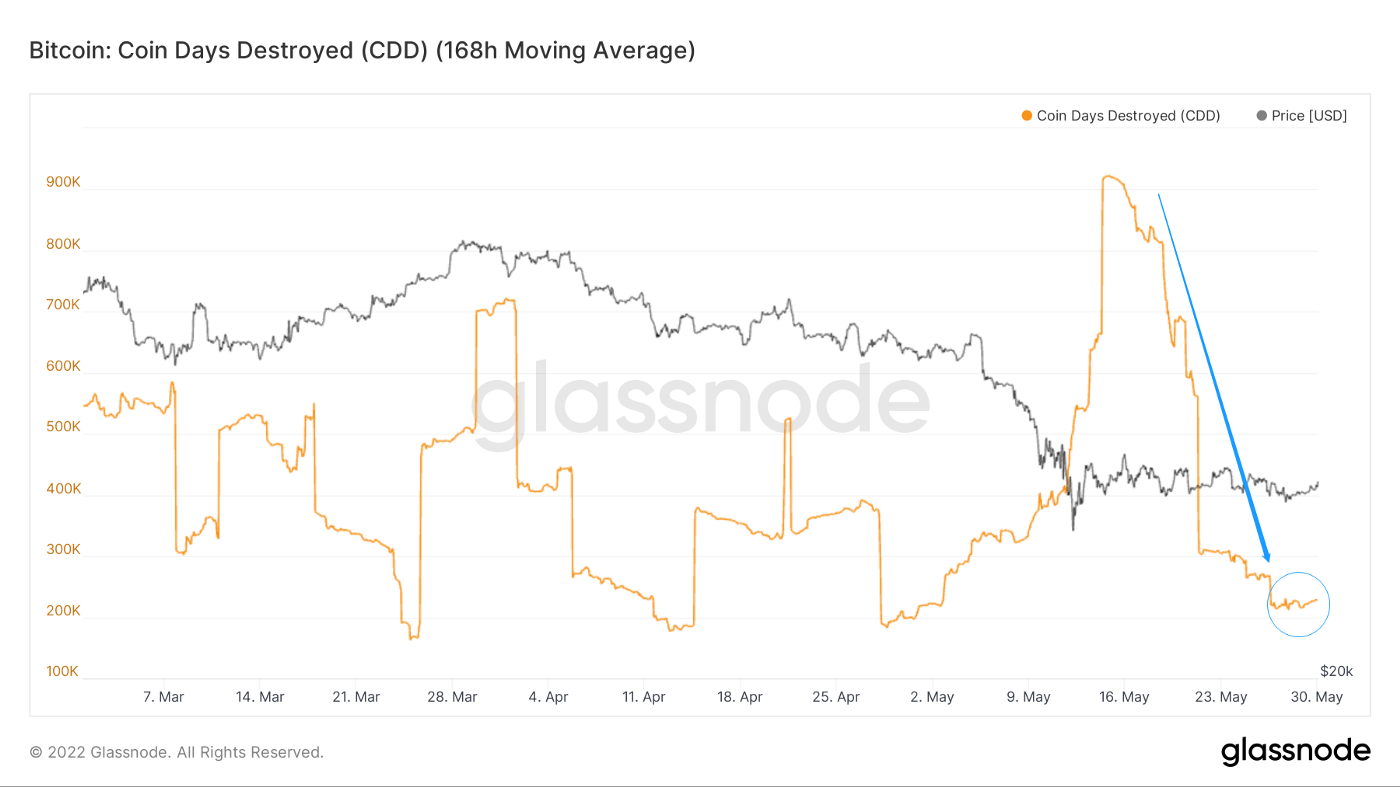
Number of days coins destroyed: number of coins * age of coins.
The amount of coin destruction has decreased, which represents that the number of coins sold in the current market has decreased and the age is shorter.
The overall market selling pressure has temporarily slowed down slightly compared with the earlier stage.
(Figure below:BTC exchange net position)
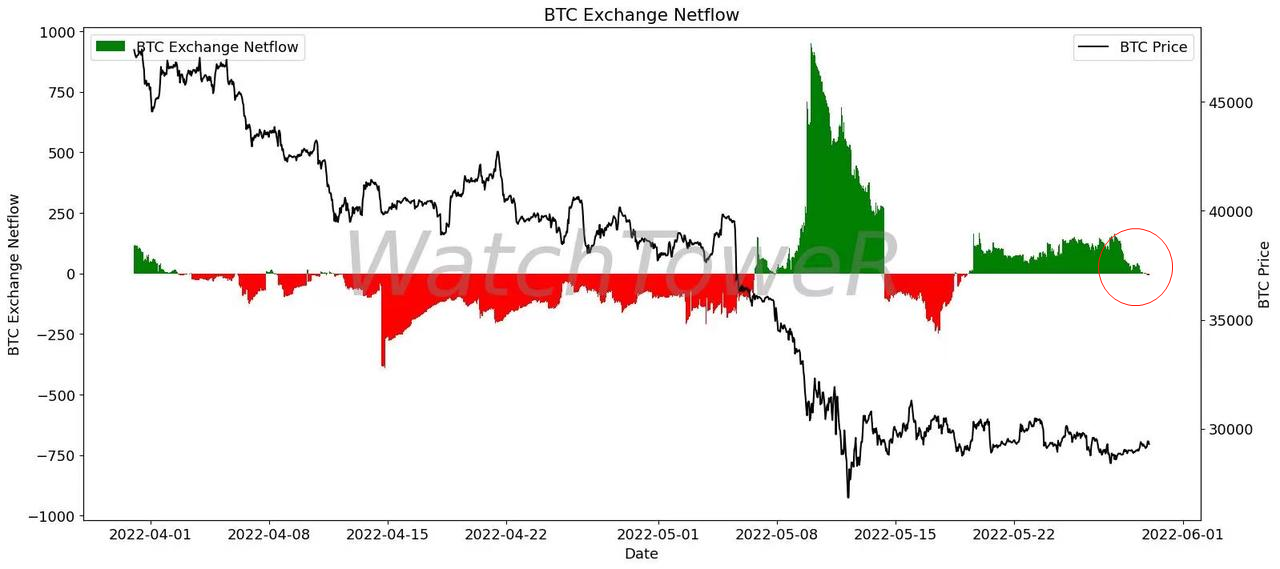
Blue: 168h BTC exchange net position
At present, 168H BTC exchange net position has a downward trend, the market potential selling pressure in the short term slightly slowed down, no further rise.
Special note: This BTC net position is a WatchToweR exclusive database.
Taken together,
Hold 3–6 months of short-term traders and long-term traders have certain undertake.
BTC’s net position fell back, “underlying” selling pressure, signs of slowing down in important illiquid groups, loss transfer sentiment temporarily moderated.
Undertaking strength and incremental capital:
(The number of new addresses below)
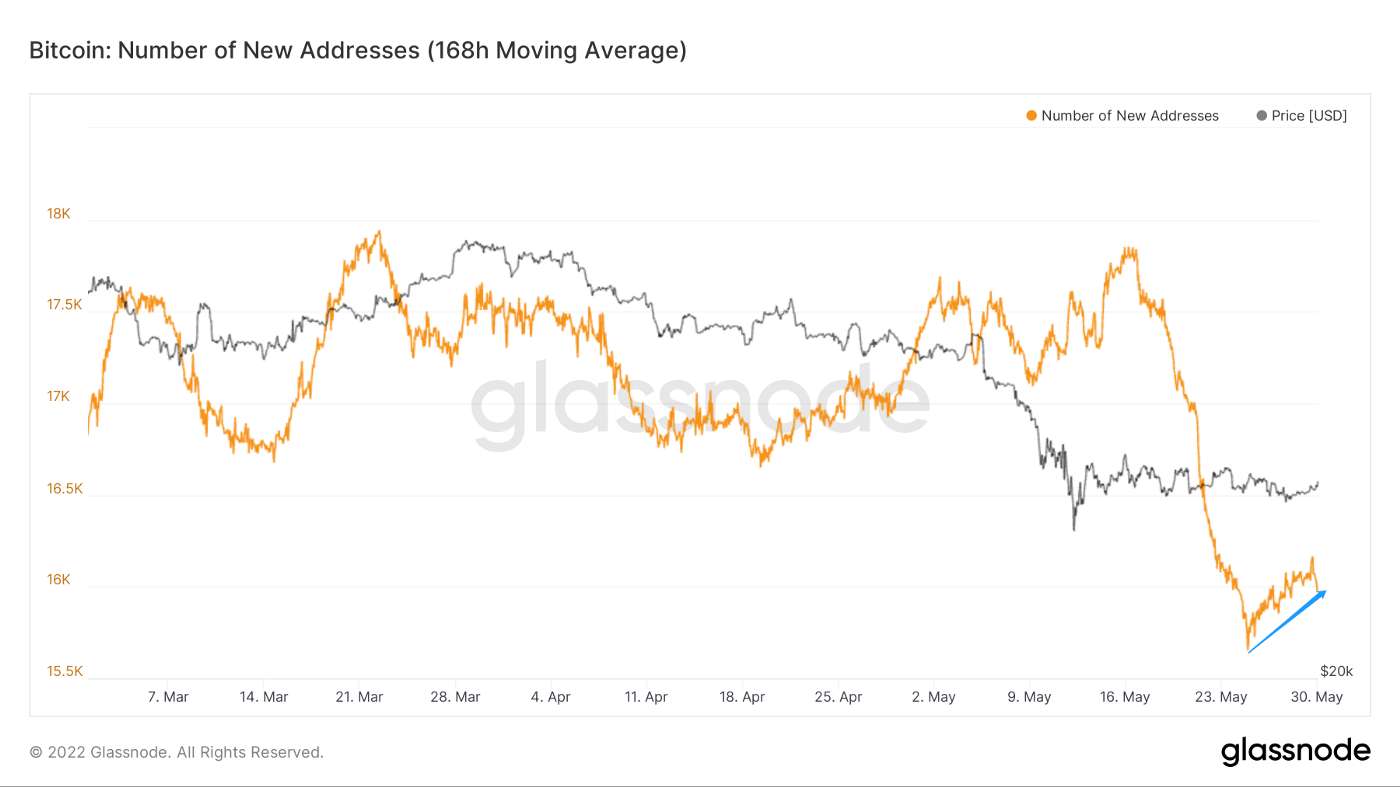
There is a slight increase in the number of new addresses on the market, which means that in the short term there will be new user groups entering the market, which may bring a small amount of incremental money to the market.
(Stablecoin exchange balance below)
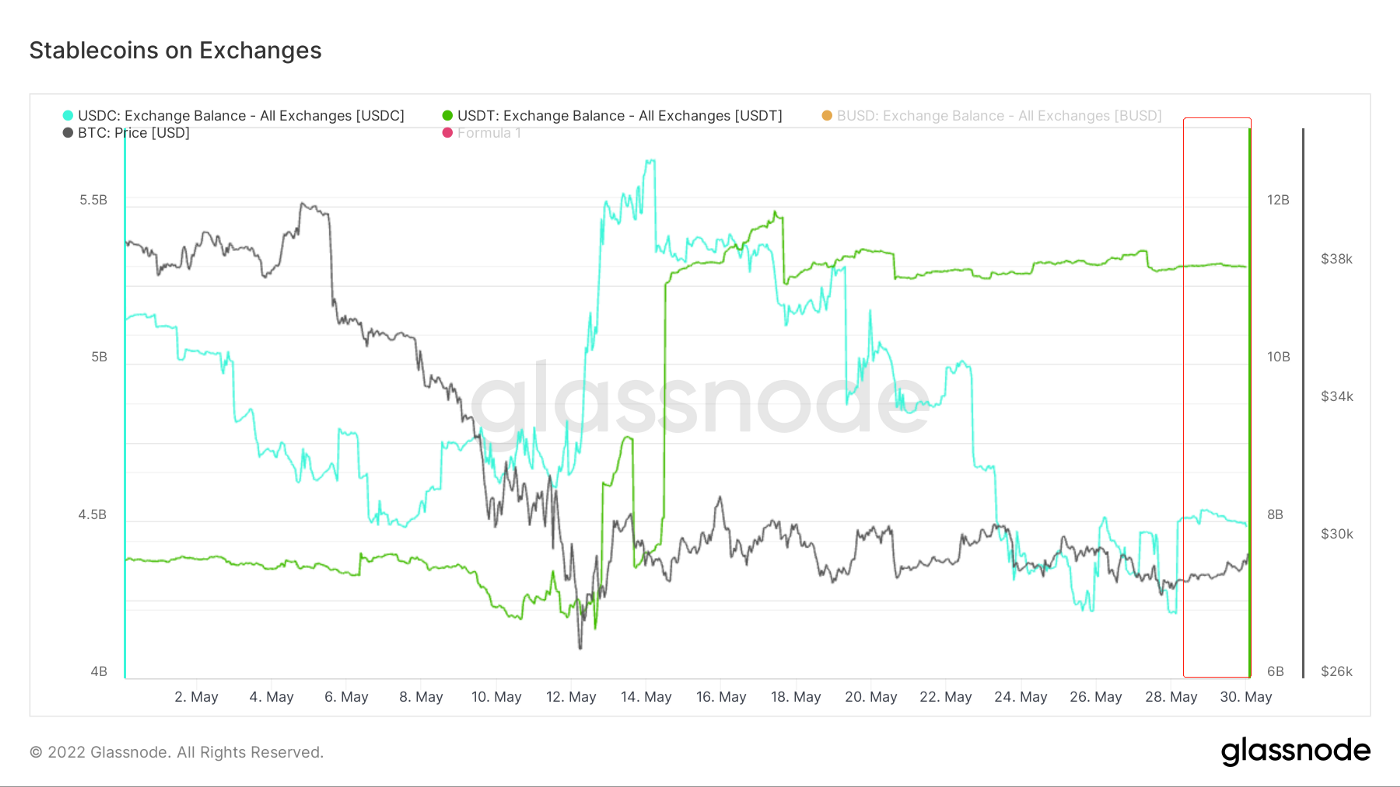
The balance of the stablecoin exchange is still mostly biased towards stock funds.
(Figure: 168h USDC net position)
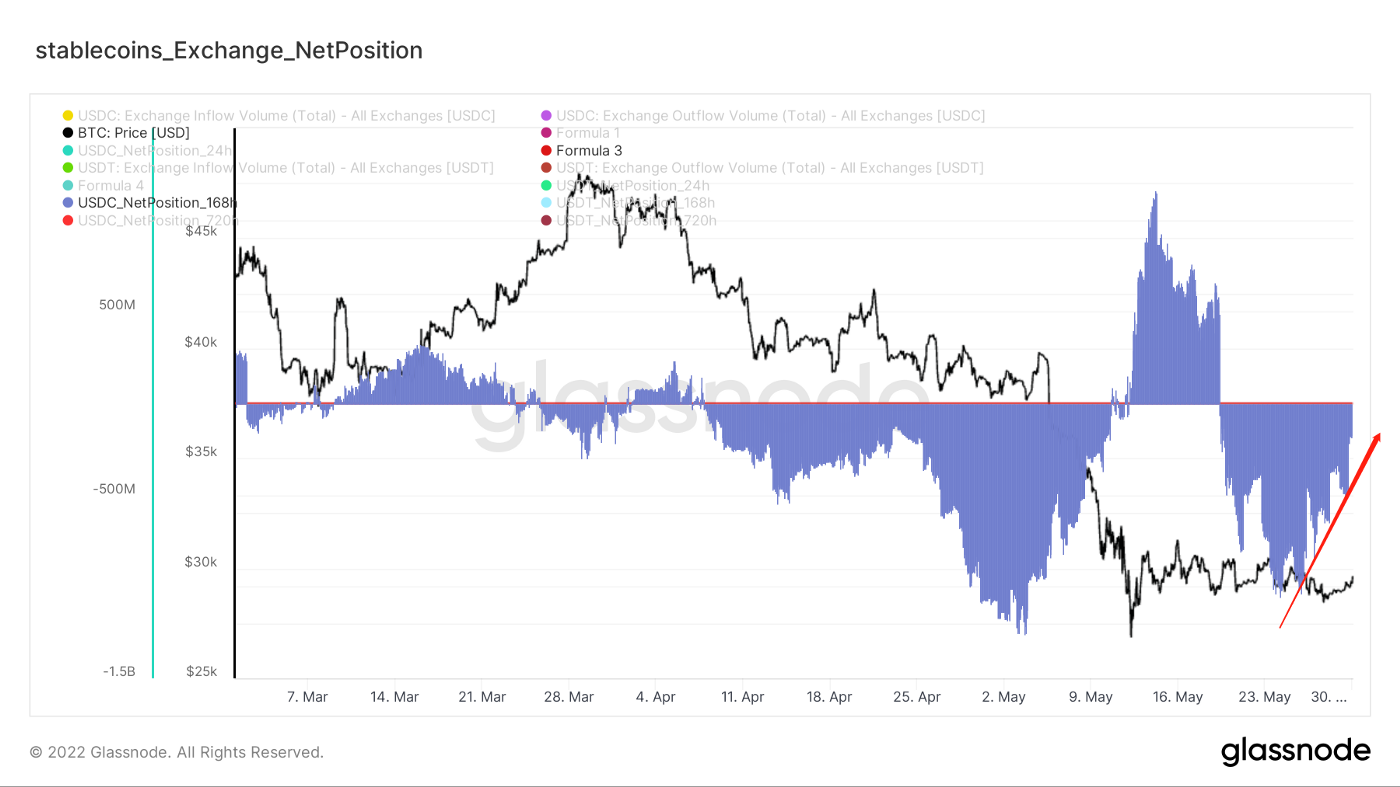
USDC net position outflow margin began to narrow significantly, which represents a certain amount of short-term “smart” money into the exchange, is a small incremental money.
(Figure: 168h USDT exchange net position)
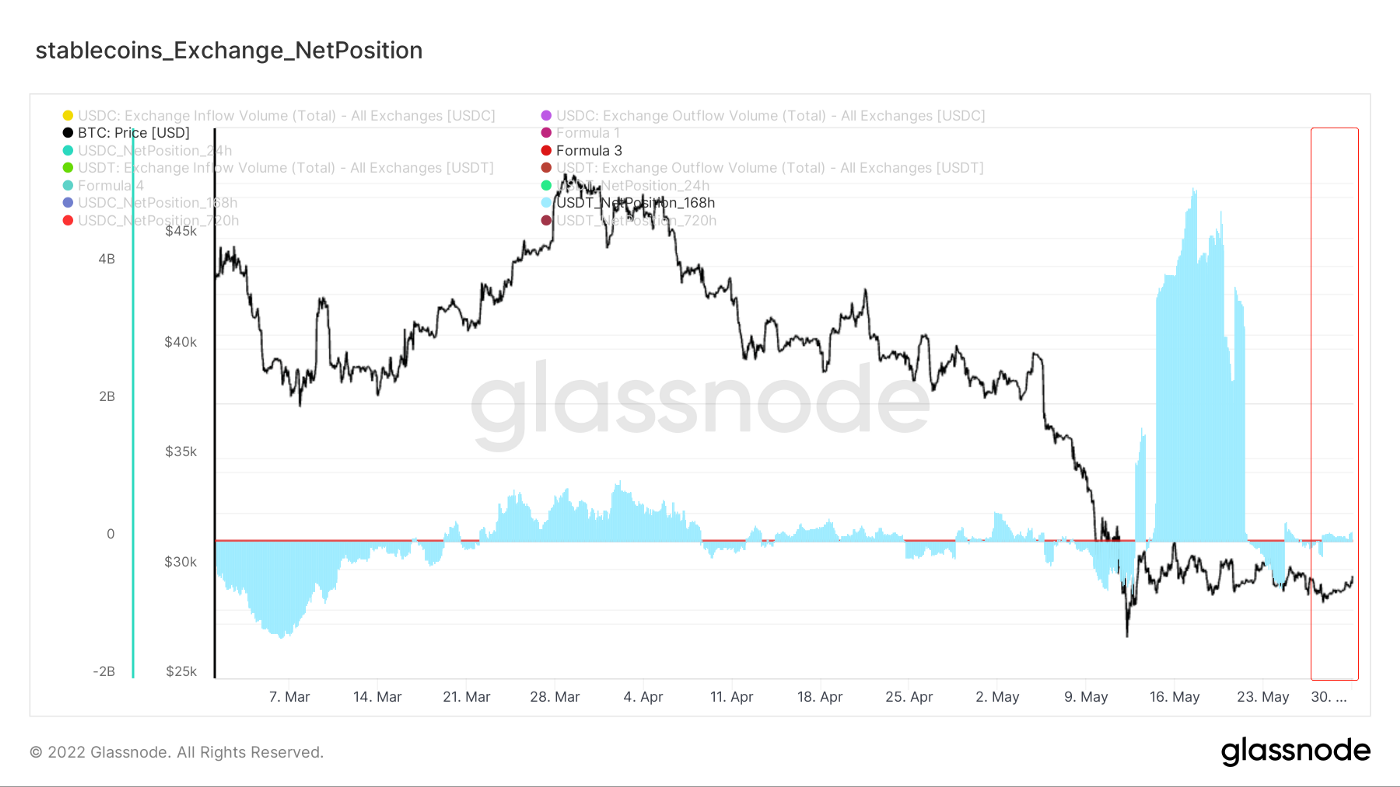
There was also a slight inflow of net positions into USDT, but not as much as in USDC.
In the short term, there are new incremental funds to enter the market, relatively speaking, the market appeared to undertake certain traces.
In general, the purchasing power of capital has increased slightly in the short term, and the market has shown signs of initial undertaking.
In the short term, we need to make a comprehensive judgment based on the macro part of the weekly report and the trend of the international market.
Weekly Summary:

News Front Summary:
Long-term:
The construction of Web3 is an inevitable trend, and Twitter has also made a transition to join the market.
Internationally, the trend towards deglobalization also risks fragmentation of the global monetary system.
SWIFT will not be the dominant system for cross-border payment transfers in the future, according to mastercard’s CEO.
Blockchain technology and central bank digital currency innovation could lead to new payment systems.
This could mean more opportunities for payment applications for cryptocurrencies.
The effect of Web3 on financial markets has been disruptive in the industry.
Generally speaking, the impact of technology on industry are as follows:
addtion, strengthened and subverted.
Of course, not most technologies are capable of industrial subversion.
Both the 24/7 global exchange financial market, DEFI and DAO are, to some extent, reconstructing the previous financial structure and production relations.
It’s a super-sovereign structure, and at the same time, in a way that really rewards entrepreneurs and people who contribute. From these perspectives, it is all industrial disruption.
In other relatively marginal markets, and in other ways, there is more industry enhancement.
Web3 is an economic innovation and people in the future will work for DAO instead of going to a company.
DAO no longer allows the boss to decide the direction alone, but allows everyone to decide the direction of the company/organization. It also means that the company assets are owned by everyone and they share the benefits and risks.
Medium term:
We maintain that “until the Fed changes its aggressive policy of raising interest rates and shrinking the balance sheet, the market will not recover in the medium term.”.
Short term:
Watch:
1).6. 1. U.S ISM Manufacture data releasement
2). 6. 6. U.S. Non-farm employment data releasement
In the short term, if the market capital inflow has a certain persistence, the market is likely to usher in a wave of rebound.
But the extent of the rebound is difficult to estimate, be cautious to go after high.
On-chain Long-term Watch:
1. This time, we deliberately disclose a few simple data formed at the bottom of the internal research in early 2019.
2. Activieness increased at that time.
3. The bottom increased its holdings by 4.41 million pieces; The bottom chip occupies 27.2% of the total.
4. Market loss selling sentiment declines and confidence improves.
5. From the perspective of global time zone profit and loss, time zones in Europe, The United States and Asia are resonant at the same time.
6. At present, the selling pressure in The European and American time zones slows down, while the Asian time zone continues to overweight.
• Market setting:
The current state from the time and chip total conversion hand and concentration, the bottom is not fully formed. Patience will be the key to future success.
On-chain mid-term probe:
1. Internet activeness shows: the mood is slightly relieved, but still in a downward trend; Address activity is still a stalemate.
2. Stable currency situation: USDC has a lot of rise in circulation, a certain amount of inflow into the exchange, may reflect the signs of smart money into the market, USDT slowed down the speed of the next bottom hunting.
3. Long-term inflation is steadily rising.
4. The proportion of illiquid supply has been slightly repaired.
5. The number of addresses above 1BTC rose slightly, and the addresses with non-zero balance were repaired slightly.
6. Whales’ selling sentiment slowed down, miners selling is narrowed, long-term traders slightly sold, hodlers are still in the positive increase state.
• Market setting:
Market pressure smaller, mild stalemate; Buyers still have plenty of money, sellers are slowing down, from the current situation, seller sentiment slowdown may let the market less pressure.
On-chain short-term observation:
1. The perpetuity futures open interest continues to rise, and the potential leverage risk in the market is large.
2. Put positions in options have climbed, with mature traders adding put protection to hedge future risk.
3. Advantage of long liquidation. At present, long and short liquidation is not obvious and is in a delicate equilibrium state.
4. Signs that long-term traders temporarily turn from selling to overweight.
5. The attitude of illiquid supply group to reduce has changed in the near term.
6. The selling group of short-term traders is mainly those who hold for 3 to 6 months and turn to increase their holdings at present.
7. Loss transfers slowed after a slight increase.
8. 168h BTC net position inflows eased, potential selling pressure moderated.
9. New addresses are now up slightly.
10. Stablesoin shows signs of slight inflow, with a slight increase in purchasing power of funds and initial signs of undertaking.
11. There is an 82.5% chance that the price will stay between 26,500 and 40,500
• Market setting:
Selling has a slight slowdown, initial to undertake a certain trace, loss stop loss sentiment has slowed, the market initially began to ease.
Disclaimer:
All the above are market discussion and exploration, and does not contain directional investment guidance; Please be cautious and guard against the market black swan risk.
This report is provided by the “WatchToweR” Research:
金蛋日记;拾年 ; Leah;elk crypto
Welcome to Follow us on:
Twitter: https://twitter.com/wtrcrypto
DAO international group
Discord group:https://discord.gg/g38BzPqdPm