“Our aim is to help market participants with professional skill and greater focus to better understand the market and make wiser decisions.”

Recap of this week
This week from March 28 to April 3, the highest point of BTC reached near 48200, the lowest close to 44250, concussion range reached about 8.41%.
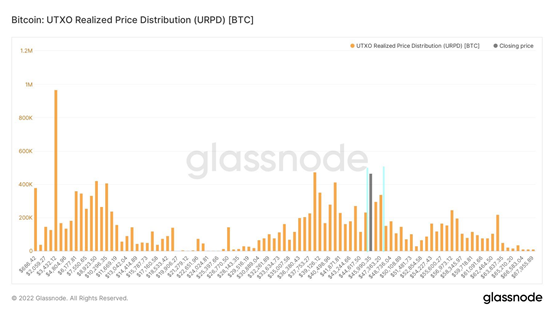
Observe the recent chip distribution map, in about 45900~47360 near the intensive chip transaction, there will be a certain support or pressure.
Weekly Important News
Macro News:
Russia-ukraine conflict:
On March 29, Russia and Ukraine opened a new round of negotiations. By April 3, U.S. intelligence officials said Russia had revised its operational strategy to focus on control of Donbas and other parts of eastern Ukraine. Russia said it would open humanitarian access to southeastern Ukraine.
Russia says Ukrainian helicopters have attacked a fuel storage facility in the Russian city of Belgorod.
The Enew German defence force said NATO would never deploy troops on Ukrainian territory.
This week Russia made a demand for rouble payment for gas to countries it had not been friendly with. The G7 countries rejected the offer.
The Biden administration declared it would invoke Cold War powers to promote electric vehicle production and a shift to renewable energy;
And launched an emergency oil reserve release program to release 180 million barrels of oil over six months to lower gasoline prices.
l Analysis:
The war is still going on, but there are signs of détente;there is little likelihood of an upgraded war if Europe does not engage and the United States says it will not send troops. The Germans predicted that the conflict between Russia and Ukraine would turn into a guerrilla war.
Nearly 600 million barrels of oil in the United States is equivalent to a month’s consumption of oil in the United States; the release of 180 million would provide a pitfall for more than a week.
It’s probably just biden’s move to fight the November midterm elections.
To judge the impact of economic war on the global economy, we have to see whether there will be relaxation of economic sanctions imposed by the United States and Europe.
U.S. economic indicators:
l Non-farm employment
March payrolls reported on April 1 were 431,000, slightly below market expectations of 490,000.
The unemployment rate fell to a better-than-expected 3.6% from 3.8%; Hourly earnings rose 5.56 per cent year on year, better than expected.
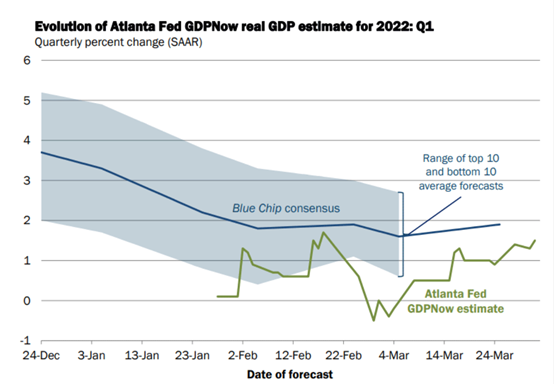
l FIRST-quarter GDP forecast
On April 1st GDP-NOW forecast us GDP for the first quarter at 1.5%
(Below: US Q1 GDP forecast, source: Atlanta Fed)
l Manufacture, services PMI
Both the manufacturing and services PMI indices continued to recover and both hit eight-month highs
(Below: US manufacturing /services PMI, source: Trading Economics)

l US enterprise inventory sales ratio
The ratio of business inventories to sales, reported in mid-March, was 1.25 in January, compared with 1.29 the month before.
(U.S inventory sales ratio. By Macro Micro)

l PCE
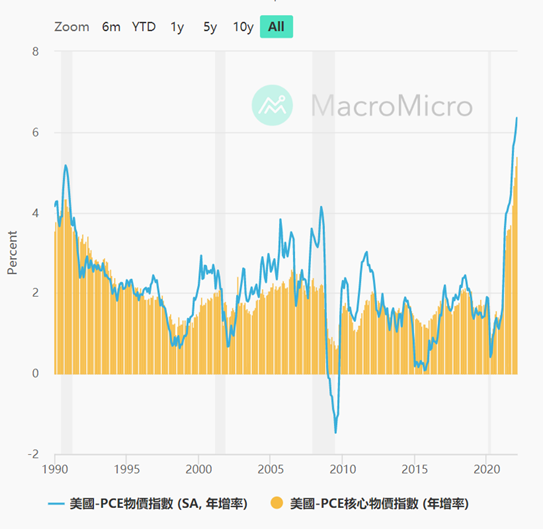
February PCE data released on March 31 showed that THE US PCE price index rose 6.4% year on year in February, in line with expectations of 6.4%.
The previous reading was 6.1%, continuing the record high and more than 3 times the Federal Reserve’s 2% target.
Core PCE rose 5.4% y/Y, also hitting a new high and missing the 5.5% expected vs. 5.2% last.
(Chart below: US — Personal Consumption Expenditure Price Index PCE, source: Macro Micro)
l Energy
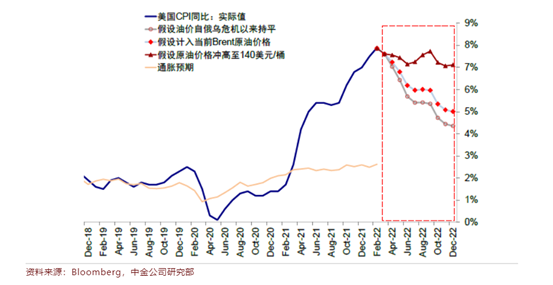
According to calculations by THE CICC Research Department, in the most extreme scenario, if oil prices surge to $140 / BBL but then remain near $100, the inflation trend will remain unchanged, but the pace will slow down, and CPI will be around ~5% year on year at the end of the year.
If oil prices stop surging, inflation will fall sooner, perhaps to around 5% by August, in a more optimistic scenario.
(Below: US CPI inflation, source: Macro Micro)
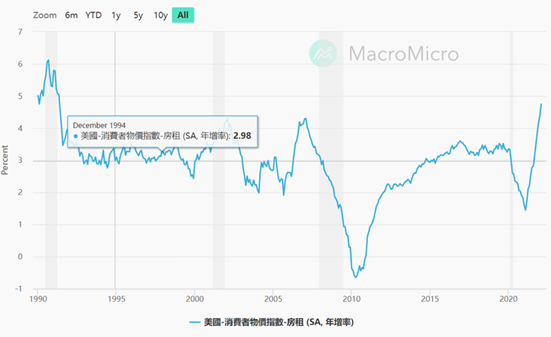
l Rent
Apart from energy prices, it is worth noting that the core CPI for rent, which includes rent and owner-occupancy costs, is at its highest level since 1991 and shows no sign of slowing.
(Below: US — Rent Price Index, source: Macro Micro)
l Consumer Confidence Index
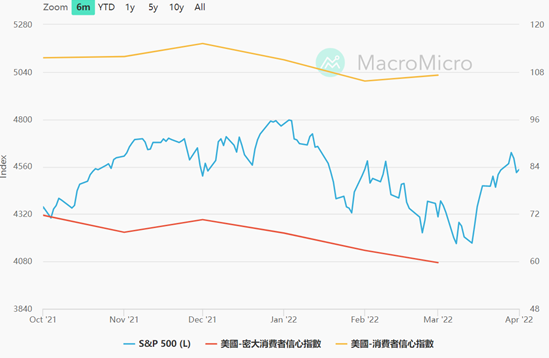
The U.S. consumer confidence index rose to 107.2 in March from 105.7 in February, according to the March 29 report.
(Blue:S&P 500, Red: Michigan consumer confidence index, U.S consumer confidence index)
l Saving
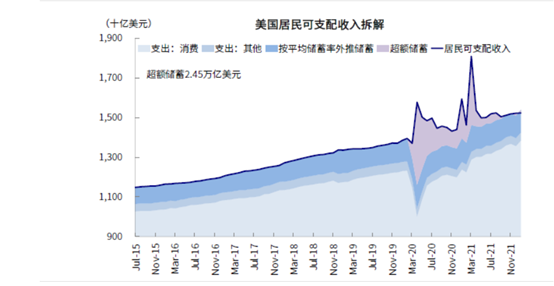
U.S. households still have $2,500bn in excess savings to support consumption.
(Chart below: US disposable income, source Bloomberg, CICC Research)
l Analysis:
The employment rate remains healthy. The long-term equilibrium unemployment rate in the United States is around 4%. The current unemployment rate of 3.6% is normal.
First-quarter GDP forecast isalso upbeat;
According to GDP forecasts, sentiment is at its nadir in late February and early March, when the risk of conflict was higher.
Apart from last year’s extreme situation, first-quarter GDP growth has been between 0.7 and 3.0 over the past decade, an actual growth of 1.5% is considered healthy.
The manufacturing and services sectors continue to recover and the inventory to sales ratio is low, indicating that current market demand is also healthy.
The inflation index PCE continues to rise, but according to CICC’s forecast, as long as there is no macro black swan, inflation will naturally decline in the second half.
Then we shall pay more attention on rent price trends.
The consumer confidence index did not break the new low again, which may be caused by the fact that residents still have a lot of excess savings.
We need to keep paying attention to the repair of consumer confidence.
Main Market Performance:
• Dow, down 0.12% for the week at 34818.27, down for the first time in three weeks;
• Nasdaq ended the week up 0.65% at 4545.86;
• The S&P 500 ended the week up 0.06% at 4545.86.
• In commodities, COMEX gold futures for June delivery ended down nearly 1.6% at $1,923.70 an ounce.
- WTI May crude futures were down 12.84% at $99.27 a barrel;
l Analysis:
The market had a mid-week correction due to the end of the quarter as we predicted last week, and picked up on Friday.
The U.S. stock market has priced in some of the Fed’s policy.
Unless the Fed is more hawkish, say by 75 basis points, it will be hard to see new lows in the stock market.
Us Treasury yield
As of April 1, the 2-year Treasury yield rose to 2.452%;
The 10-year US Treasury note rose 2.44%.
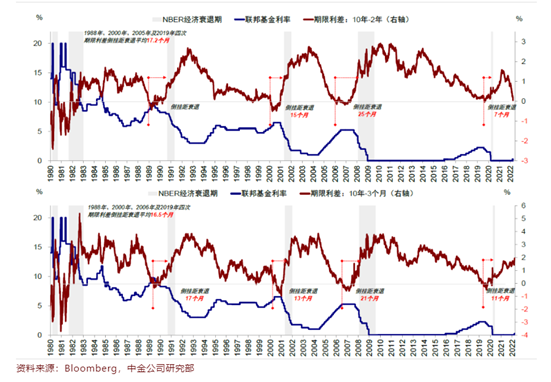
Higher interest rates at the short end mean lower long-term returns (expectations) and higher short-term funding costs, which in turn erode long-term growth expectations and, over time, put downward pressure on the economy or even into recession.
(Chart below: US term spreads: 10–2 years, 10–3 months, source: CICC Research)
l Analyisis
The 3M10s (3-month and 10-year Treasury yields) are more important in gauging the accuracy of recessions, and the Fed is paying more attention to them. Now the two are going in opposite directions.
In addition, the 2s10s nominal interest rate is almost inverted, but the 2s10s real interest rate (minus the expected inflation rate) is still expanding.
(Figure below: 10-year to 2-year nominal and real spreads, source: CICC Research)
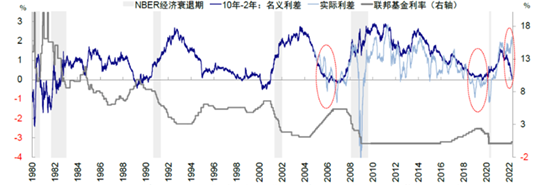
Moreover, four of the five reversals were followed by recessions, but the average interval was 17 months and varied widely.
The correlation between inversion and decline is also untested.
In summary, we believe that only 2s10s yield inverted does not alone prove a recession in the future .
Capital News:
1. Debit card and Visa Master purchase of cryptocurrencies are supported on the mobile app of MetaMask
2. Goldman sachs began offering cryptocurrency investment services to clients with assets of more than $25 million in the second quarter.
3. Tether added $1 billion stablecoins on 30th.
4. Enviable Three Arrow Capital: additional holdings of 71311 ETH, worth over US $242 million.
5. Terra increased its holdings of 2943 BTC, valued at approximately $140 million, to 30,727 BTC currently held
6. SBF made deposits of more than $1.1 billion stablesoin in exchanges last weekend. (Twitter)
l Analysis:
Short — term and medium — term capital are relatively abundant.
It can be seen that within the Crypto industry, people have confident in the follow-up market, and are still inclined to increase holdings at the current price.
Other News
1. CME announces the launch of mini BTC Ethereum options.
2. SEHK plans to set up a digital asset trading platform called Diamond this year, along with a wallet management platform.
3. Spanish retailer EI Corte Ingles has partnered with auditing firm Deloitte to launch a cryptocurrency exchange.
4. Chandler, Ariz., accepts cryptocurrency for utility bills.
5. Europe authorized KYC for private digital currency wallets
**Long-term Insights: **To see how we’re doing in the long run; Bull/bear/structural change/neutral
**Mid-term probe: **To analyze where we are now, how long we are in this phase, what will happen
**Short-term Watch: **used to analyze short-term market conditions; And the likelihood of certain directions and certain events occurring under certain conditions
Long-term Insights
- Lightning Network Channel Size
- LTH Market Inflation
- Stable Coin Market Size/ Bitcoin Market Size
- Volume/Market Size
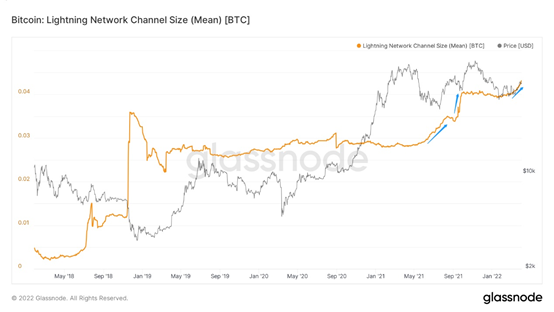
The long-dormant Lightning network channel is finally being expanded to a certain extent.
This means that there is a certain amount of growth in app development in terms of more and more frequent and other active ecosystems.
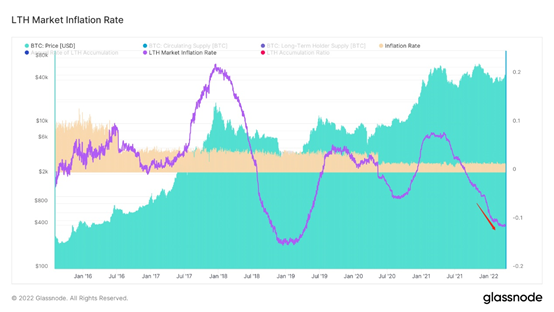
To observe macroscopic on-chain state models:
• Positive above shows inflation for long-term investors;
• Negative values represent deflation for long-term investors.
The details have been shown in the previous report, and the current situation is that long-term investors in the market are behaving in a deflationary state.
This is bullish from the left side of the chain.
(The ratio of market value of stablecoins to BTC market value)
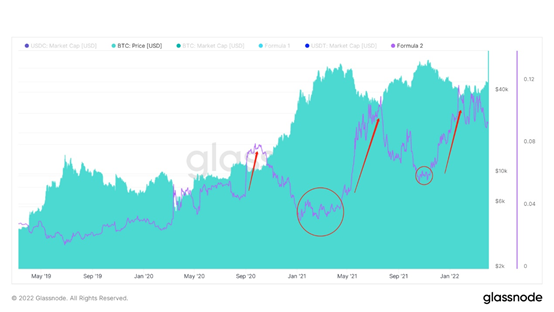
This can be used to observe the stock of stable coin, mainly extracting two important key values; USDC and USDT
When purple line is at the peak of the slope, it proves that wait-and-see funds are high.
• Then the market will start the uptrend, because the wait-and-see fear of taking short, so they will buy, accelerate the market effect.
- When the stablesoin market value is hovering at a low level and is not used, it may represent a small amount of capital in stock, and the remaining observers have not joined the market, which will cause certain risks.
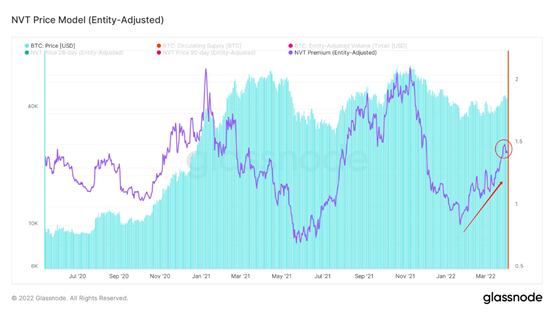
This is one of the advanced volume in long-term trends.
Now temporarily a little pause, but the long-term trend is still in rise.
Medium-Term Investigations
- No. of Addresses with Non-Zero BalanceNo. of Active Addresses
- 3 mth Coin Maturation Wave
- Reserve Risk
- Coin Years Destroyed
- 28-day Market Realized Gradient
- Seller Exhaustion Constant
- Value Days Destroyed Multiple
- Illiquid Supply Change
- Long-Term Holder Net Position Change
- Hodler Net Position Change
- Miner Net Position Change
Let’s look at the number of non-zero balance addresses.
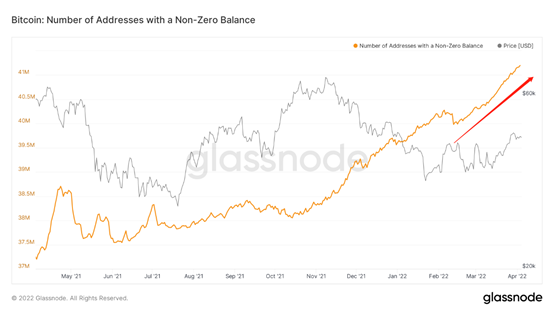
The number of non-zero balance addresses is still showing strong growth.
It may be the following situations
1. More new users of BTC
2. Large address splitting increases the number
3. The registration threshold for crypto exchanges has been lowered, and the channels for exchanging fiat coins into cryptocurrencies have gradually become more convenient.
Excluding large address split, the number of users is positive.
Combined with market activity.
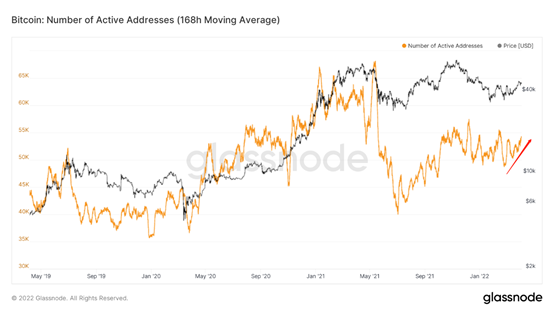
The recent rise in activity indirectly indicates that the temperature of the crypto world is rising, and Bitcoin will lead the whole crypto ecosystem to turn.
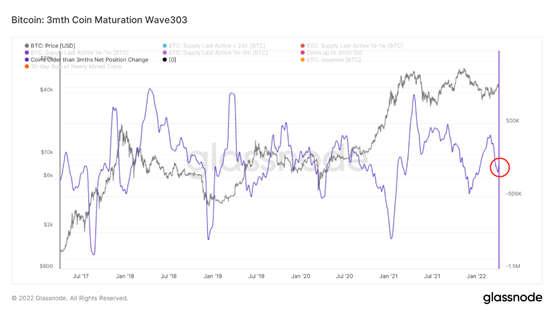
The purple line is the indicator.
As can be seen from the chart, traders under 3 months old judged in the market have not changed their operating habits in the past five years.
1. When the market price appears an upward or downward trend, the coins whose age has grown to more than three months will decrease, which plays a role of market acceleration.
2. When they reverse, the price of the currency may stabilize or fluctuate upward, which means that short-term traders can hold the currency with more peace of mind and grow into older traders, indirectly reducing the selling pressure in the market.
3. The slight reversal of current indicators may indicate that traders less than 3 months old have higher patience in currency holding.
Look at the current risks in the market.
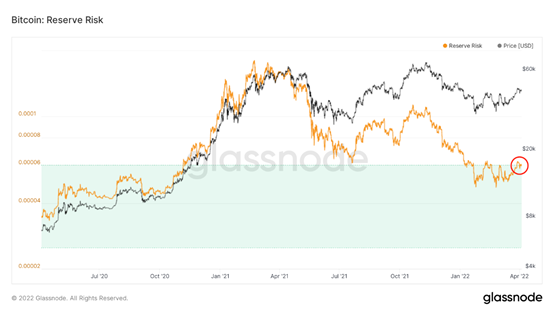
This index mainly measures the risk of holding money. Is the product of the current BTC price and the cumulative value of coin day destruction.
From the current situation, the currency is still in the region with low risk, which can be used as a medium — and long-term reference.
Look at long-term traders holding situation.
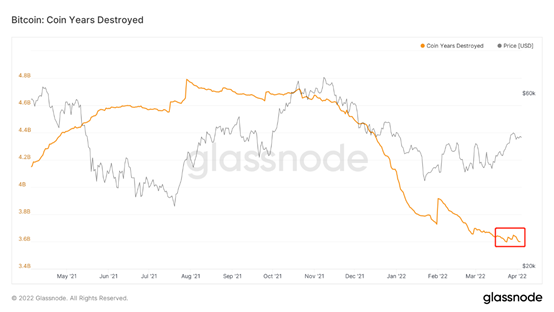
The index calculates the destruction (movement) of bitcoin on an annual basis and assigns a weighted weight to it.
The current volume is in the range of wandering, long-term traders in the near term do not have too significant tendency to sell willingness.
Let’s look at the market gradient over the next 28 days.
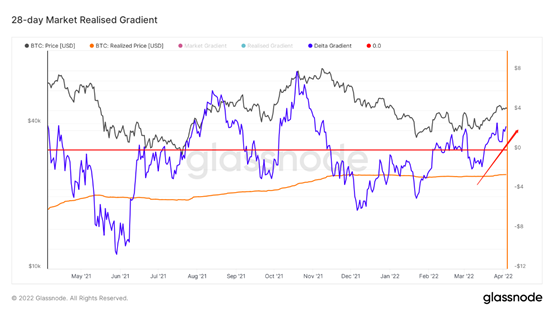
The indicator measures the change in momentum of real capital flows over a 28-day period. It is currently above the red trend line.
Recently, there have been two consecutive momentum upswings, indicating that the current medium-term potential energy is relatively strong.
There is a lingering situation, if sustained, the market may still need momentum.
Then look at the current macro situation of the seller.
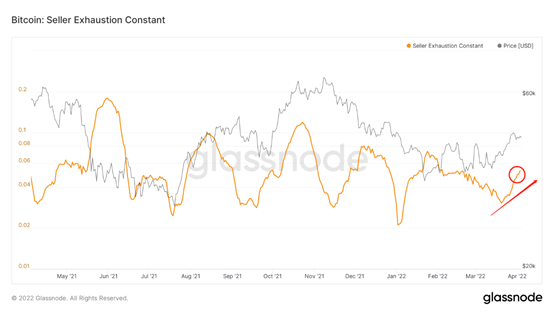
The principle is the the percentage profit in supply multiplied by the 30-day price fluctuation.
Low price volatility over 30 days, or low margin percentage in supply, indicates less profit-selling pressure.
Good for capturing low volatility lows.
The slight uptick suggests there may be selling pressure from profit holders.
Let’s look at the situation of the macro selling pressure.
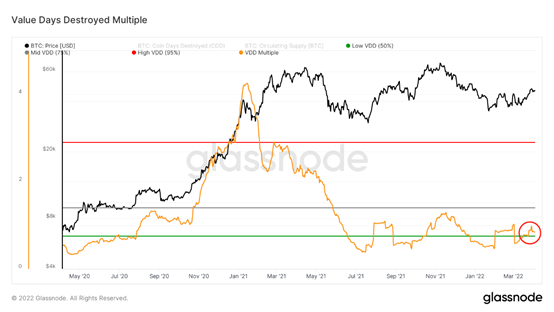
The cost of making a decision for high age and high volume address is extremely high.
Experienced traders of this kind may split their sale.
We are only seeing a certain amount of selling and the overall selling intensity is low.
Finally, look at the recent net position changes for each group.
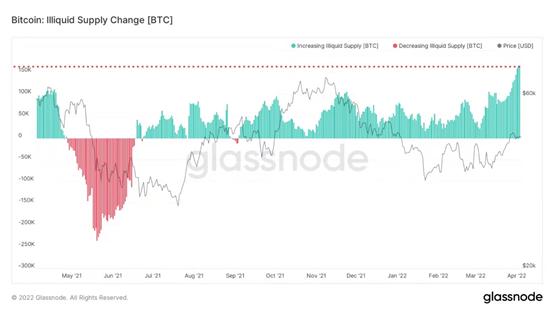
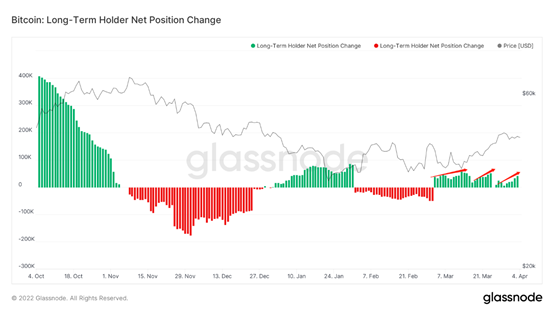

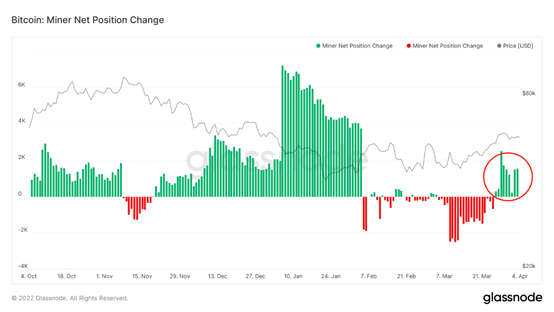
On the whole, all groups showed a good increase in their holdings.
Illiquid supply groups hit new highs.
But long-term traders are being conservative.
Short-term Watch
- Perp OI/Market Cap
- Leverage
- Option-Future Volume
- 30day Bitcoin World Price Change
- Stablecoins Net Position Change
- Stablecoins on Exchanges
- Transfer in Profit/Loss
- Supply Shock
- Spent Output Lifespan 1m-3m
- Spent Output Lifespan 3m-6m
- Spent Output Lifespan 1y-2y
- Short Term Holder SOPR
- Short Term Holder NUPL
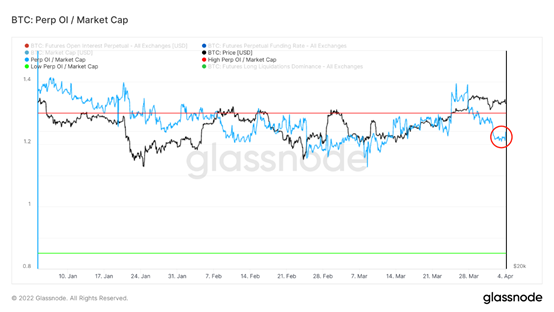
Review derivatives markets.
Overall derivatives market risk, is back below the warning line, now slightly higher. At present, the overall mood of traders involved in derivatives has declined to a certain extent, which temporarily shifts the dominant position of the market from derivatives to spot.
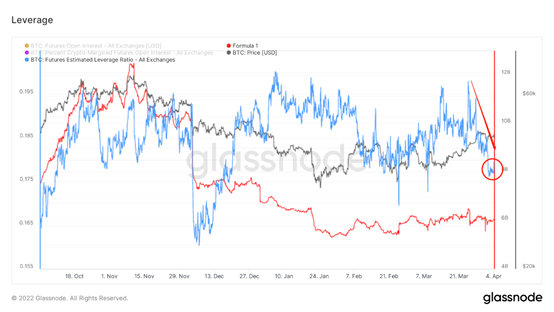
Specifically presented in the chain, futures estimated leverage ratio has decreased, leverage risk has been released, derivatives on the market has declined.
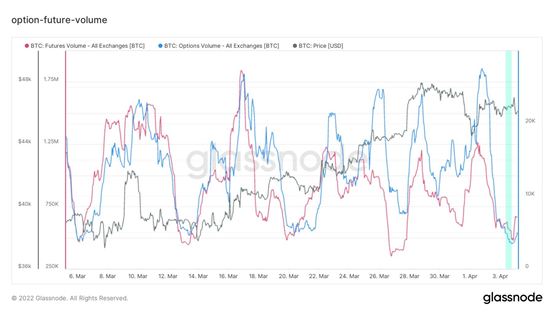
The daily trading volume of options and futures further declined to lower level. At present, the daily trading volume of derivatives is on the rise again. When it reaches a certain amount, it is likely to amplify the impact on the market.
Review the spot market.
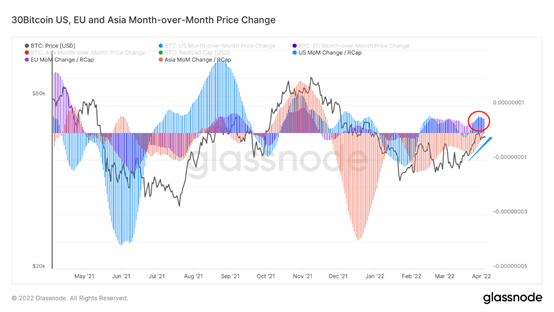
The whole Asia region is at loss ,reduced gradually, at edge, have profit sign. Overall traders in the Western region are still in profit, down slightly.
As the market recovered, most traders began to take profits, which helped to further restore traders’ confidence.
Stablecoin exchange net positions showed a trend of net inflows.
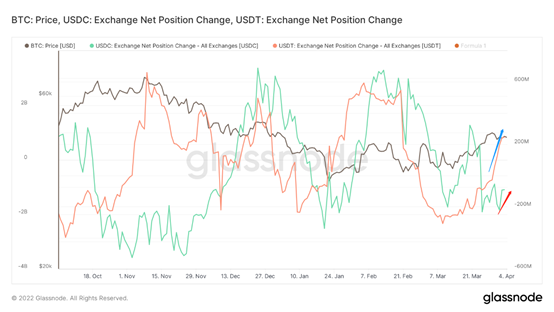
Combine with stable-coin exchange balance
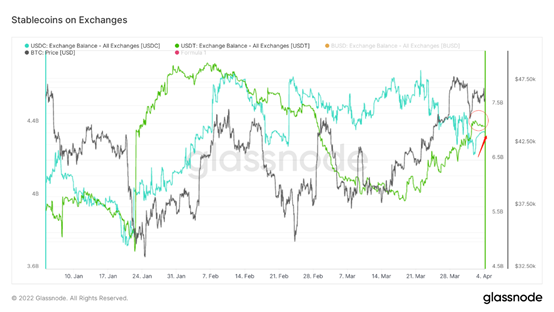
At present, USDC has risen to some extent, USDT has entered the shock, generally showing that there is a relatively sufficient stock of funds, there is a large amount of funds in wait and see.
When market purchasing power appears, ample stock of money will help drive the market to the upside.
Watch for “latent” selling pressure.

At present, there is still a high amount of loss transfer, which means that the pressure of loss selling in the market is still further released, and we need to continue to pay attention to whether the pressure of loss selling will continue.
There are a small number of mature traders in the market at the appropriate price began to profit selling, this part of the traders tend to be more cautious to hold when the market falls.
The profit shock continues to fall, which means the overall market profit selling pressure is relatively small.

Combine with the above, “potential” loss-selling pressure is still releasing, still need to be further observed. Profit selling pressure has moderated for now.
The main part of this could be selling pressure.
For traders of 1~3 months, traders of 6~12 months, there is a greater probability to bear the shock of the market, with the recovery of the market to sell.
1~2 year traders, as the market picked up to sell profits.
Need to further follow up the market in the short term to digest this part of the pressure.
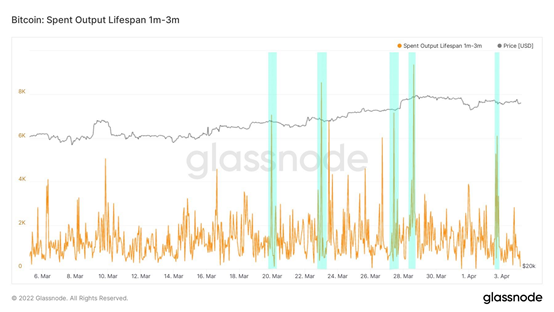
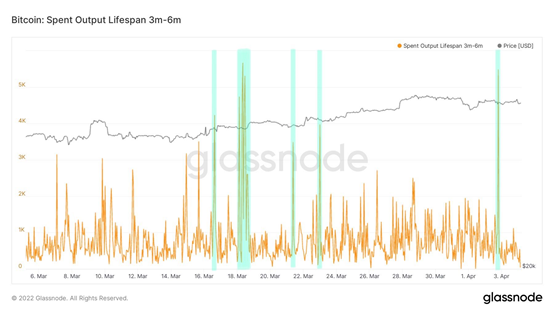

Finally, it is important to pay attention to changes in market sentiment among short-term traders.
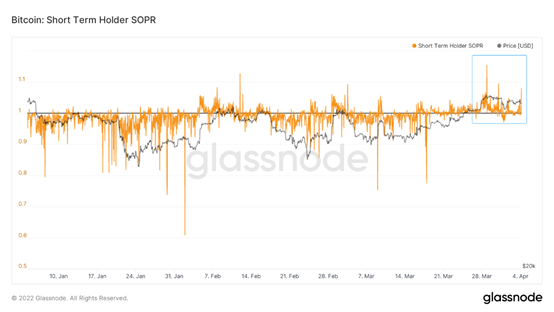
As the market recovered, short-term traders sold at profit for the most part and sold at high volumes at appropriate prices, but excessive selling is also a source of pressure on the market.
The overall mood of short-term traders is hovering around the bull bear tipping point, but the overall mood is improving, requiring further follow-up observation.
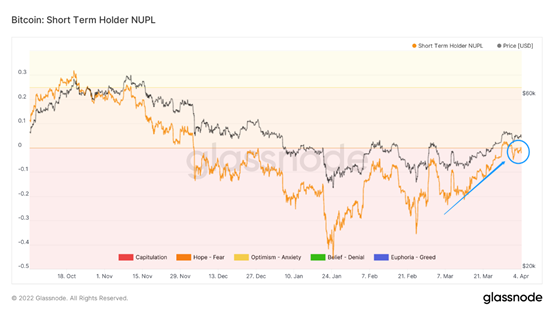
Based on the above sufficient stock funds, these variables are more likely to lead the market upward if there is a strong purchase intention in a good mood.
Then keep an eye on these variables.
Weekly Summary

News Summary
Long-term:
If SEHK launches the “digital asset trading platform” by the end of the year, it will be equivalent to having another digital asset trading venue in Asia, which will be good for BTC.
If BTC becomes a global reserve asset, the implied price would be between $1.3 million and $4.8 million a coin, money management giant VanEck said on Friday.
• These two prices are predicted with BTC as M0 and M2 respectively.
After the Russia-Ukraine conflict, the BTC has new prospects as a global reserve currency.
Under this expectation, BTC’s valuation may be further improved.
Encouraged by government policies in the United States, Russia, the United Arab Emirates and other countries, the adoption rate of the crypto market is likely to soar globally and the time required for BTC to reach a higher valuation is likely to decrease.
Mid-Term:
The overall U.S. economy is still in good shape.
The Federal Reserve began to turn eagle in November last year, the Federal Reserve interest rate reduction has been digested by the market for some time.
So unless the next rate hike is more than expected, or there is a more serious Russia-Ukraine panic than there was in February, the market reaction to rate hikes and shrinking the balance sheet will not be bigger than before.
Short-term:
Macrolevel is still neutral, capital is healthy.
Pay special attention to the Minutes of the Fed’s April 6 meeting for more insight into the fed’s following actions.
Long-term On Chain:
1. Lightning network channel expands to a certain extent.
2. Deflation is on the chain for long-term investors.
3. The market value of stablecoin is still sufficient compared with the overall macro stock at present.
4. The ratio of on-chain trading volume to market value pauses slightly, but it still shows a long-term upward trend.
• Market Tone Setting:
Accumulation; From the long — term chain structure, partial to bullish.
Mid-term On Chain:
1. Macroscopically, the number of users still shows a relatively strong growth, and the number of active addresses increases, which is good for the construction of the ecosystem from Bitcoin to other crpyto.
2. Coins whose age has grown to more than 3 months show a decline, which is now slightly reversed. If these traders have higher patience to hold coins at this stage, the selling pressure may be reduced in the medium term.
3. Illiquid supply groups, long-term traders, hodlers, miners still maintain a significant increase in their holdings. Illiquid supply group overweight broke new highs, long term traders are more conservative at overweighting.
4. Within 28 days, the market gradient has broken through the red line area, and real buyer capital has entered the market.
5. Volatility index is still rising, the market faces some profit selling pressure. Macro selling pressure has released a certain amount.
• Market Tone Setting:
Neutral to active. In the medium term, we need to pay attention to the trading conditions of traders under 3 months, their attitude towards the currency has accelerated effect.
Each group has a significant overweighting phenomenon, the current buyer has greater potential energy. If the current situation continues and continues to digest the macro selling pressure that may rise, there is a possibility of upward trend in the medium term.
Short-term On-chain:
1. The overall derivatives market risk has been released and is now slightly higher.
2. The daily trading volume of derivatives has declined and is now rising again, and leverage will likely amplify the impact on the market and lead to higher volatility.
3. Traders in the Asian region showed signs of narrowing losses and moving toward gains, while those in the Western region continued to show gains. The majority of traders began to take profits, which helped further restore confidence.
4. Stable currency flows into the exchange with a relatively sufficient stock of funds.
5. At present, there is still a high amount of loss transfer, but the overall market profit selling degree is still gradually narrowing. “Underlying” loss-selling pressure is still being released and profit-selling pressure has moderated.
6. The main selling pressure is for those who hold for one to three months, three to six months, and one to two years.
7. The overall mood of short-term traders is good, and is now hovering at the critical point of adjustment.
• Market Tone Setting:
Derivatives market risks have moderated, and the cash market has a relatively sufficient stock of funds, but needs to be adjusted and repaired.
In the overall market mood is good, if there is sufficient willingness to buy, the market is more inclined to go up in shock.
Disclaimer:
All the above are market discussion and exploration, and does not contain directional investment guidance; Please be cautious and guard against the market black swan risk.
This report is provided by the “WatchToweR” Research:
金蛋日记;拾年 ; Leah;elk crypto