Disclaimer: This content is for informational purposes only, you should not construe any such information or other material as legal, tax, investment, financial, or other advice. Nothing contained in this report constitutes a solicitation, recommendation, endorsement, or offer by MetaStreet or any third-party service provider to buy or sell any securities or tokens or financial instruments in this or in in any other jurisdiction in which such solicitation or offer would be unlawful under the securities laws of such jurisdiction.
🡺 Discord: https://discord.gg/metastreet
🡺 Website: www.metastreet.xyz
🡺 Twitter: https://twitter.com/metastreetxyz
NFT Resilience to the ETH Market
In previous months, we’ve speculated on the correlation between NFT prices and ETH prices, going as far as to posit that with increased mainstream adoption of some NFT projects, pricing NFTs in dollars could be more appropriate than in ETH (much to the chagrin of OG NFT investors). We want to revisit this discussion with the backdrop of both major macro headwinds (inflation, supply chain challenges, war in Europe, etc.) and crypto-specific market challenges (Luna blow up & subsequent bankruptcy ripple effects) driving prices down ~80% from ATHs. Are NFTs correlated to ETH, and how does the answer to this question inform an investor’s decision making process (whether in the equity or debt position)?
TL;DR? It’s complicated - so you should just go ahead and read the whole article.

Background & Process Overview
Are NFTs “recession resilient”? In plain English, this is what an investor wants to know:
- If ETH is 📈, will my NFT value also go up (in USD or ETH terms)?
- If ETH is 📉, will my NFT value stay resilient (in USD or ETH terms)?
Ok, so how do we go about testing & ultimately answering the above questions?
- We started out by looking at three NFT collections - CryptoPunks (our main focus), Bored Ape Yacht Club, and Cyberkongz as proxies for “blue-chip” NFT assets. These collections have different trading volumes, vintages, and use cases, but are all generally viewed favorably by NFT markets.
- In order to contextualize the market backdrop, we bucketed correlations by time windows in which ETH price was moving one direction or another. We looked at both the % change in ETH prices (absolute change in USD price for ETH) and moving average convergence (“MACD”) of ETH (a momentum indicator that gives stronger signals for UP/DOWN market dynamics).
- Finally, we looked at correlations across currencies:
- NFT-USD price vs ETH-USD Price: The price of my NFT is $100k when ETH is worth $5k (ie, NFT is worth 20 ETH). Then, the price of ETH drops to $1k.
- Positive correlation: my NFT is worth $20k / 20 ETH
- No correlation: my NFT is worth $100k / 100 ETH
- Negative correlation: my NFT is worth $125k / 125 ETH **
**
- NFT-ETH price vs ETH-USD Price: The price of my NFT is 20 ETH when ETH is worth $5k (ie, NFT is worth $100k). Then, the price of ETH drops to $1k.
- Positive correlation: my NFT is worth 4 ETH ($4k)
- No correlation: my NFT is worth 20 ETH ($20k)
- Negative correlation: my NFT is worth 25 ETH ($25k)
- NFT-USD price vs ETH-USD Price: The price of my NFT is $100k when ETH is worth $5k (ie, NFT is worth 20 ETH). Then, the price of ETH drops to $1k.
- We realized that the difference between these two analyses may help us discover an executable strategy, especially as NFT lending currently operates mainly on ETH- and DAI- based loans and MetaStreet plans to have ETH- and DAI- based vaults.
While NFT’s are typically denominated in the underlying chain’s currency, our first look is at the NFT-USD market, since we at MetaStreet prefer to denominate our DAO funds in USD.

While we may get criticized by NFT purists for looking at this analysis from a USD perspective, those that survived the bear market in 2017-2018 witnessed the painful moments when projects were betting their treasuries on ETH. When the pain hits, it’s tough to hedge against market volatility, especially as USD denominated hedging instruments are more common than ETH denominated (insurance, options, etc).

Analysis
Ok, let's get into the analysis. The following chart does a correlation analysis on NFT-USD vs ETH-USD performance over a 30-day window.

- Punks: The most straightforward takeaway is CryptoPunk USD prices are always positively correlated with ETH, in both UP and DOWN markets. This means generally speaking*,* when ETH prices in USD are up, CryptoPunk prices in USD are up. When ETH prices in USD are down, CryptoPunk prices in USD are down.
- This correlation was something we had previously speculated, but were nonetheless surprised to see such a consistently high correlation. Qualitatively, it seems this correlation is driven by 1) provenance relevancy in the NFT market 2) combined with the lack of events related to the asset (vs the activist CyberKongz and BAYC), and, most notably, 3) the long survival / Lindy effect of CryptoPunks.
- BAYC assets have generally moved across the entire spectrum, negatively and positively.
- Aug-Sept 2021: The largest change in correlations happened in primarily two instances: the initial “NFT bull market” which helped push all NFT value assets upwards as ETH ran up
- May 2022: the correlations were volatile, likely due to Otherside land airdrop, as the price of BAYCs ran independent of the market but eventually moved congruent to the price of ETH given the global macro changes.
One important question still remains: Does the ETH price of an NFT have resilience to the ETH-USD market? Even if ETH price goes down, does it go down less?
CryptoPunks rallied significantly with the promotion of Christie’s NonFungibleNoah joining Yuga Labs as the “Head of CryptoPunks.” This kind of correlation behavior is only captured by the NFT-ETH correlation chart (below) given the sheer magnitude of ETH price drop experienced over Q2 2022. The NFT-USD chart above makes it a bit harder to see, but 2022-07 on the NFT-ETH chart demonstrates an illustrative correlation switch across the x-axis.
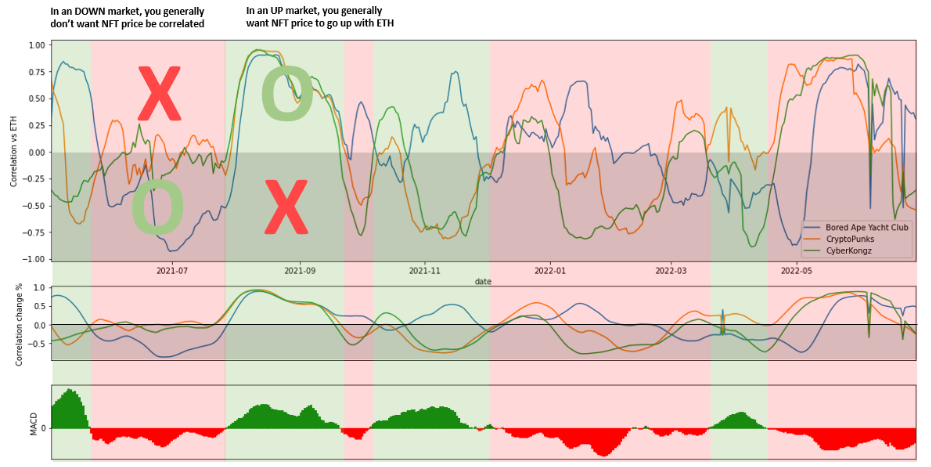
We bifurcate the NFT-ETH vs ETH-USD correlations across ETH’s moving average convergence/divergence (MACD) to see how NFTs could behave against a backdrop of positive/negative ETH price sentiments. This creates “UP” and “DOWN” categories based on ETH sentiment.
- In an UP market, you generally want NFT correlation to be positive - If ETH goes up, my BAYC’s ETH price goes up with it
- In a DOWN market, you generally want NFT correlation to be negative - if ETH goes down, my BAYC’s ETH price also goes up or holds
To apply this analysis, the highlighted numbers below illustrate the % of days where correlations were positive based on the ETH-USD momentum for CryptoPunks.

While the data is very short-term (multi-week), the UP and DOWN markets help us reveal that NFT-ETH prices may correlate to ETH price sentiment.

In CryptoPunks specifically, we saw 95% of positively correlated days in an UP market back in Q4 2021 where NFTs and ETH were booming together.
Starting April 2022, we saw a trend reversal, where ETH was going down and NFTs (in ETH terms) were also precipitously moving in the same trajectory (down). CryptoPunks: Of the 73 days of a DOWN market, we saw 59 days (81%) of positive correlation, aka the NFT is going down in ETH terms.
However (!), we did see a trend reversal as mentioned earlier with the recent CryptoPunk rally, where the Punks floor moved from a bottom of 45 ETH to closer to ~70 ETH amid Yuga Labs’ intention to revitalize the engagement for the collection via a new hire. Within their respective quadrants, there are still a lot of events to digest (e.g. Otherside land mint event for BAYC). This is why seeing an NFT-ETH correlation analysis might inform us of unique insights.
To finalize the main question: are NFT’s resistant to a recession?
While they may have historically been able to resist ETH price, the chart below consistently reveal that CryptoPunks’s ETH price have degraded their negative correlation with ETH in DOWN markets from 50-75% to 19%, revealing a recent shift toward low resistance & high susceptibility of price drops when ETH is going down. However, as CryptoPunks become more event driven via Yuga activism, they may begin to exhibit more resilient behavior against ETH price drops.

Conclusion
- The armchair statistician caveat: with one year of data and thin transaction volume relative to traditional liquid markets, you should take this analysis with a grain of salt. No investment decision should be made on a single data point, however these correlations may fit into a broader directional thesis from an investor’s standpoint.
- If we were forced to give an opinion: the speculative nature of newer NFT collections may contribute to these assets behaving independently from ETH prices (early days of BAYC/Cyberkongz) as they have benefit/suffer from risk tolerance levels in bulls/bears. However, over time should exhibit higher correlations with ETH price unless event driven (e.g. CryptoPunk’s USD prices generally have very high correlation to ETH as they are less event driven/an older asset).
- One could also argue that NFTs have only been correlated to a [global macro bear + ETH bear] and fairly independent in price during [global macro bull + ETH bear] - but this insight would require false negative testing
- The only way that prices may be able to stay resilient will be… to build in the bear & to announce updates. This kind of fundamental news may engage users to have positive speculation on the asset that goes against macro trends.
**
**