
Introduction
In the development of DEX, mainstreams include iterations of algorithms and changes in market making. From constant price and constant product market-making curve to various concentrated liquidity algorithms, the underlying market-making algorithms of DEXs are becoming more and more efficient. DEXs used concentrated liquidity solutions perform well in the market, Uni V3, Curve V2, and DODO are the top three. Each has adopted different methods to achieve liquidity concentration and improve the capital efficiency of LP funds. In this article we will deeply compare the underlying algorithms’ data performance of three DEXs, analyze the underlying market-making algorithms from multiple dimensions, and compare their overall market performance.
Concentrated Liquidity
There can be economy only where there is efficiency. ——Benjamin Disraeli
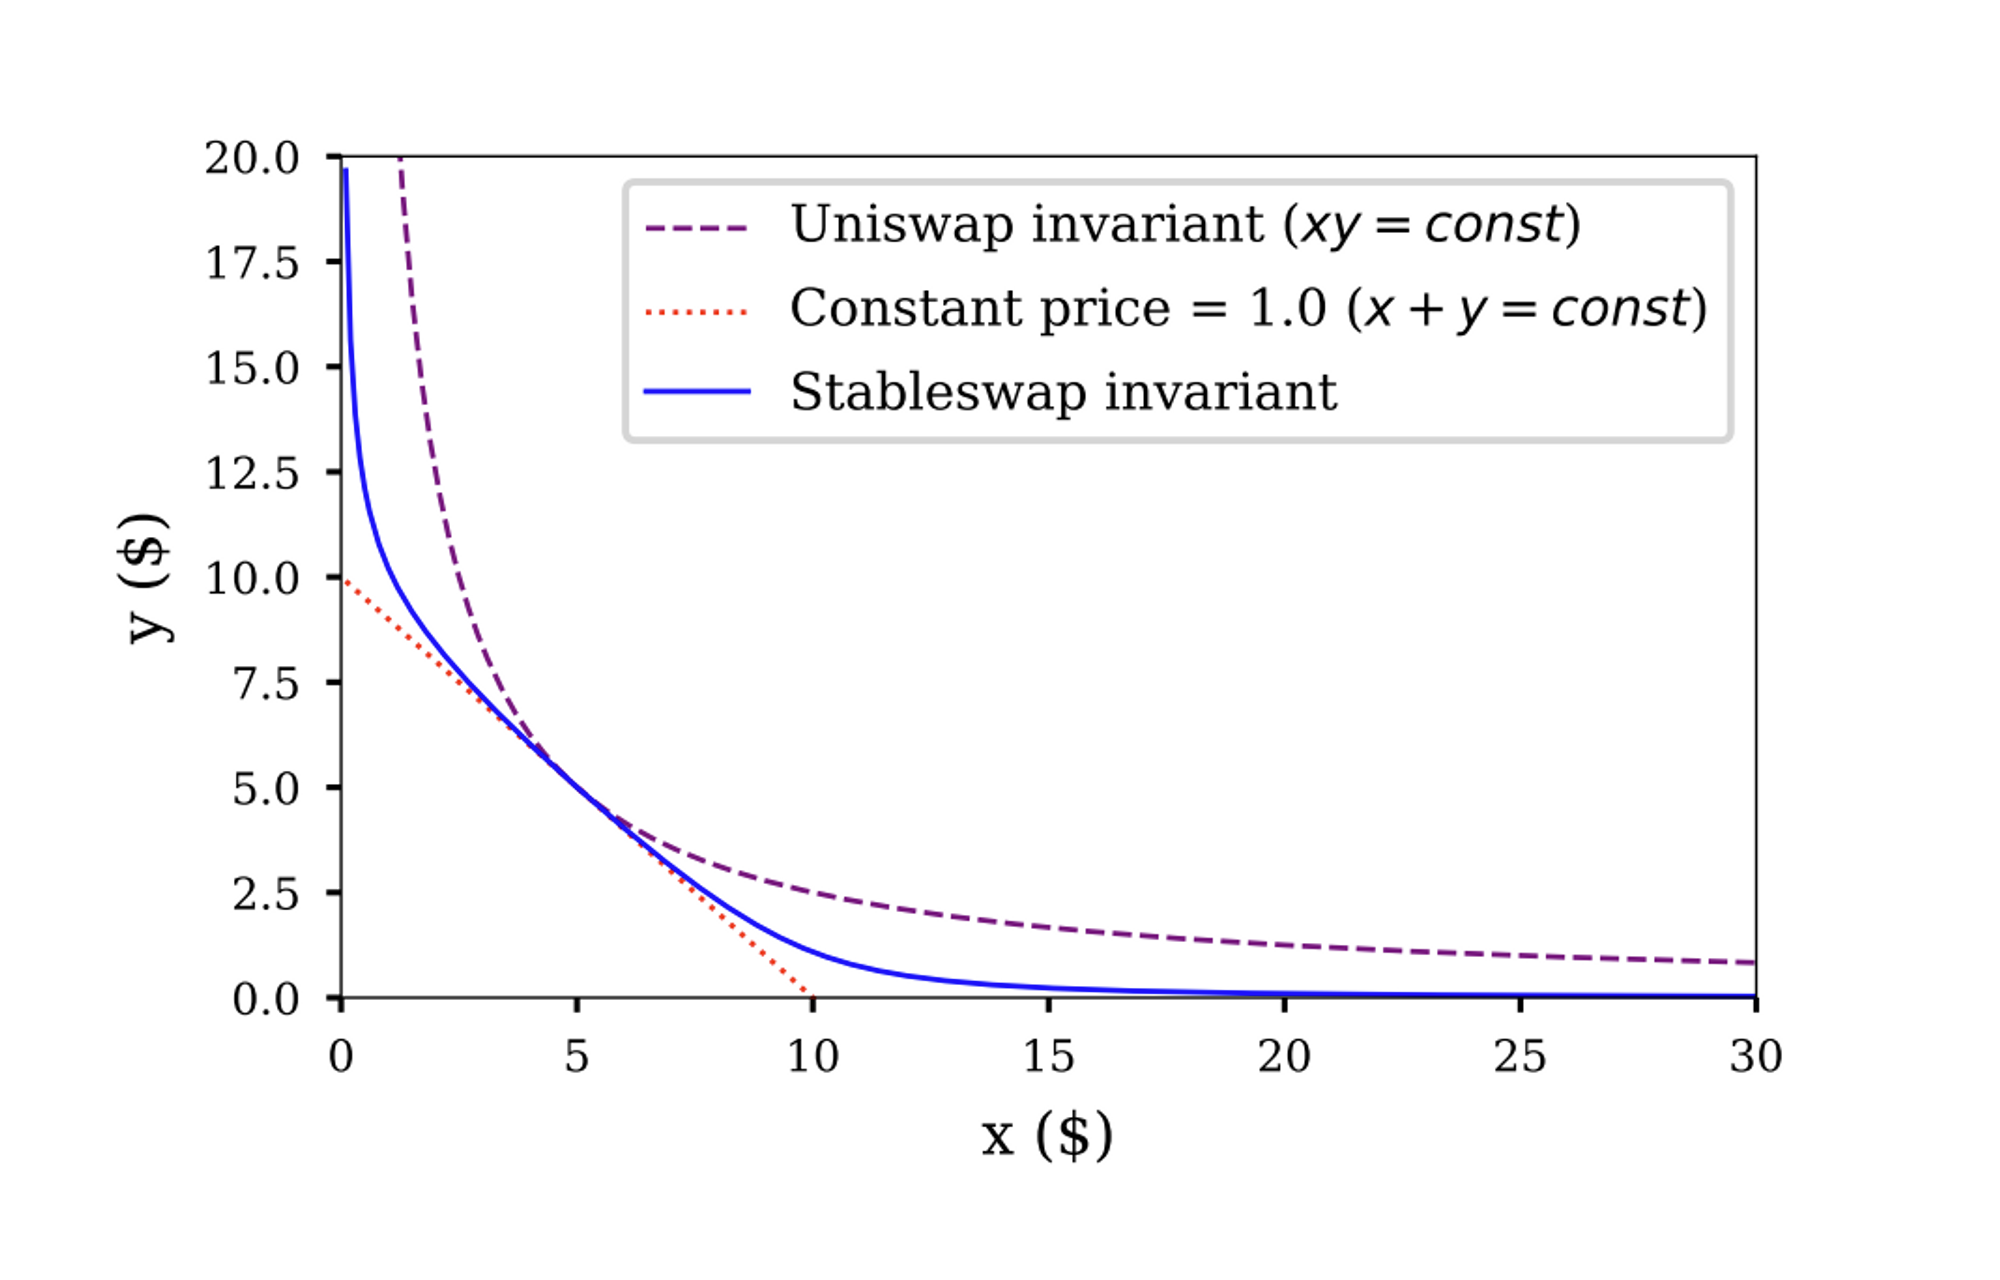
The constant product function, x*y=k, is a breakthrough innovation in the DeFi field. It enables Automated Market Making and realizes on-chain exchanges. However, the constant product AMM market-making curve has unavoidable efficiency issues.
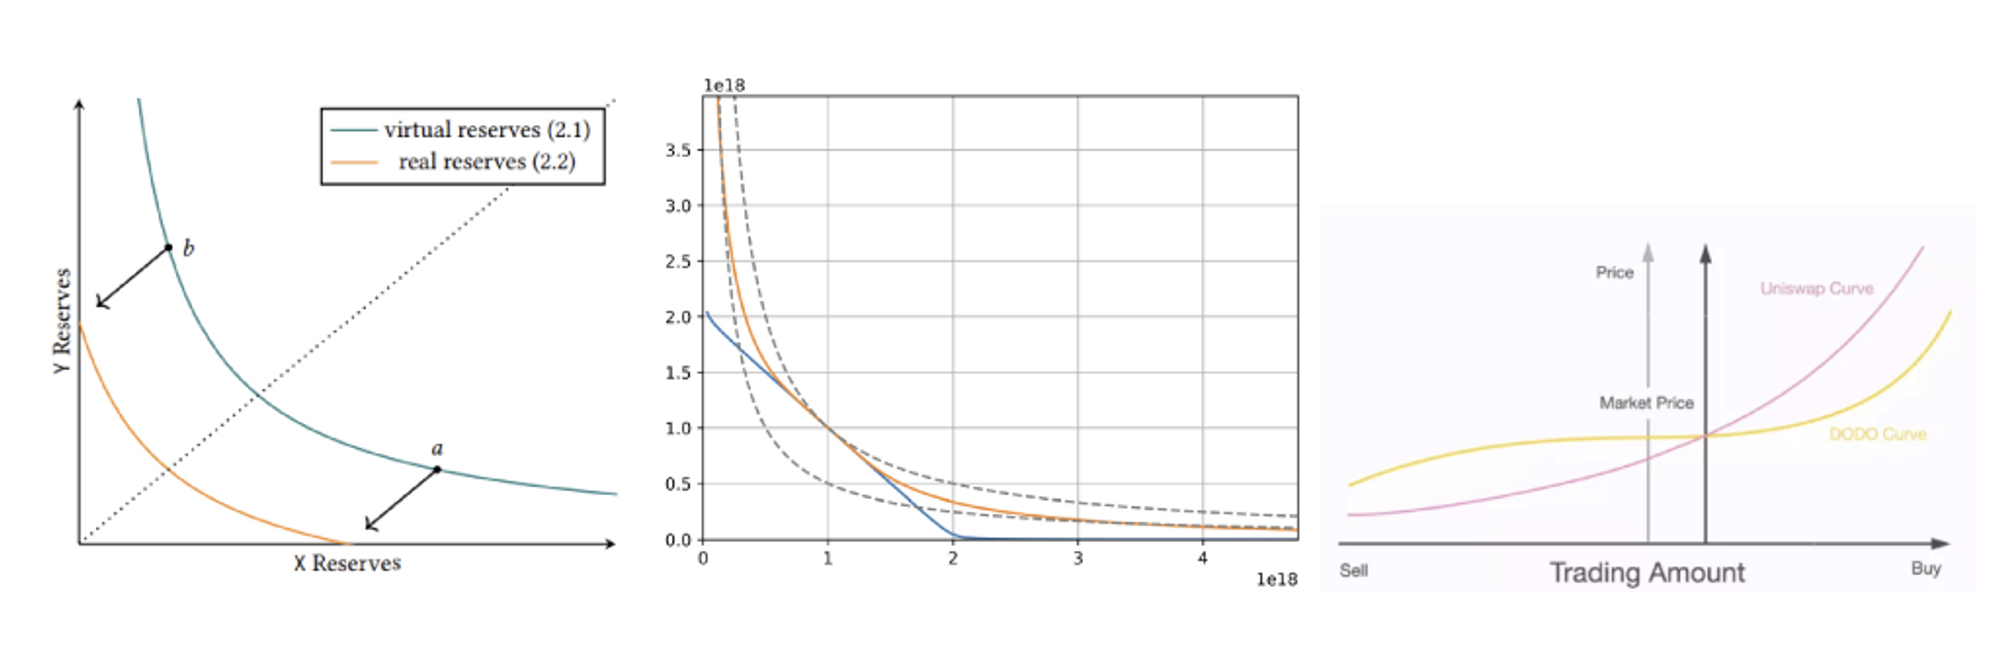
Uniswap(Uni) used the constant product market-making function in its early version. As the figure shows, the liquidity is evenly distributed on the curve, and the theoretical fluctuation range of token prices is from 0 to infinity. The actual market range of token prices concentrates within a small range. It means the liquidity outside the price range is not provided to the market, resulting in a loss of efficiency. In this case, slippage, market depth, and impermanent losses are negatively affected.

Concentrated liquidity is to change the liquidity distribution on the market-making curve in a certain way, concentrating liquidity in the most frequently traded range in the market and improving the efficiency of market-making funds. Any attempt to adjust the market-making curve to change the liquidity distribution of pools can be called concentrated liquidity. Uni V3, Curve V2, and DODO are typical DEXs with concentrated liquidity yet significantly different underlying algorithms. The solution of concentrated liquidity is not sole, and its essence is to improve capital efficiency as much as possible to meet the demands of token trading and market-making.
Uni V3, Curve V2, DODO - Three Market-Making Curves for Concentrated Liquidity
Uni V3
Range Order and Leveraged Liquidity
Uni V3 proposes range order. It allows users to provide liquidity in a specific price range, concentrating liquidity in a given price range while the liquidity distribution of the entire pool is the sum of all orders. LP thus provides leveraged liquidity as their funds only work in the selected price range. Within this range, the earning efficiency of market-making funds improves; if it falls outside, the efficiency is invalid.
Uni V3 concentrates liquidity using the leveraged liquidity mechanism, which concentrates liquidity near the market price through LPs' behaviors, i.e., LPs subjectively predict the range of price operation. When the market price fluctuates, LPs will actively adjust the market-making range. A lot of adjustment behaviors will lead to changes in the overall liquidity distribution. Statistically, it will eventually fall at the near-market price. The overall efficiency is improved, but the efficiency change among users depends on their pending orders.
Design Analysis and its Pros & Cons
Uni V3 designs to improve LPs' capital efficiency. LPs can freely select the price range and customize market-making based on their own judgements. Such design improves the market-making efficiency of LPs as a whole but makes an unbalanced benefit between LPs and adds additional decision-making costs to LPs. Making market-making more proactive is contrary to DEX's intention of lazy market-making. Most retail investors cannot make market predictions; they will face a higher risk of impermanent losses brought by leveraged liquidity. This design also led to JIT (Just In Time) attacks which complicate the whole market-making process.
-
Pros
-
Users can customize the price range of market-making and control capital efficiency with high flexibility.
-
The market liquidity distribution is formed by the range orders of all LPs, a subjective and closer to market behavior.
-
High ceiling for capital efficiency.
-
-
Cons
-
the income of LPs depends on their market judgement ability, which increases LP's decision-making cost, resulting in unbalanced LPs income and JIT attacks.
-
It improves efficiency but also increases risk. High-leveraged liquidity means higher impermanent losses.
-
Curve V2
Automated Adjusted Pricing Curve
Curve V2 is designed by Curve for non-stable assets. The core idea is similar to Curve's StableSwap. Let's review the StableSwap proposed by Curve.
The first generation of Curve’s algorithm is quite straightforward. It is the weighted sum of two market-making curves: constant product and constant price. It makes the curve has less curvature around the fixed price, enabling a concentration of liquidity at the fixed price. In stablecoin transactions, the price concentrates around 1. This way, Curve achieves concentration of liquidity around 1, thereby improving capital efficiency.
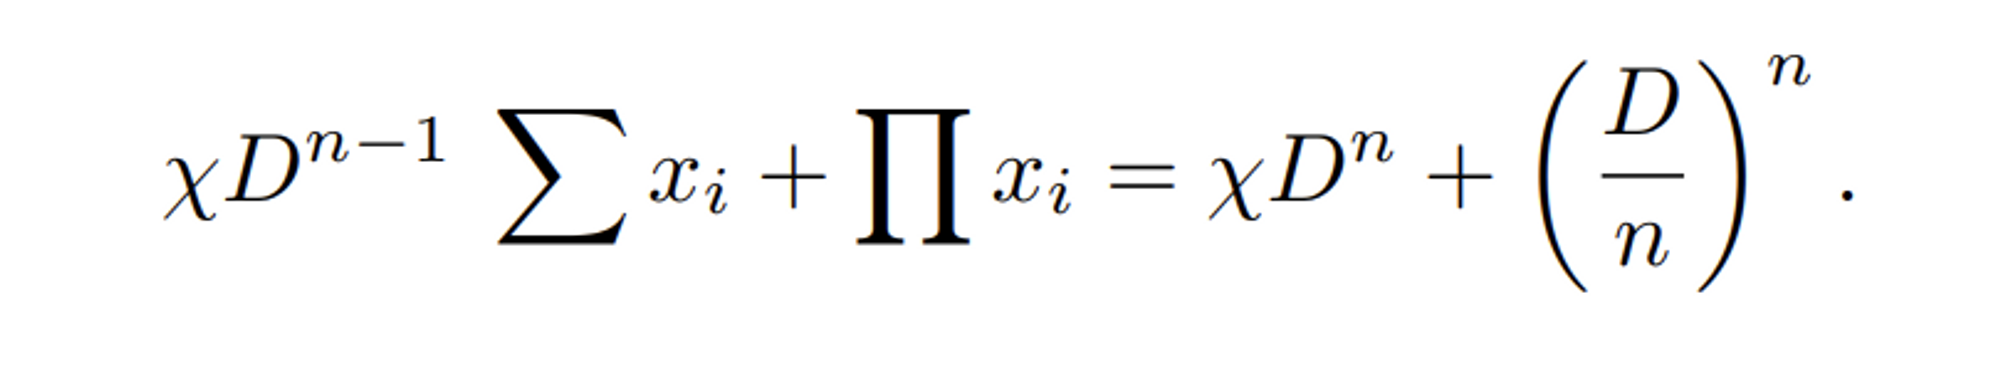
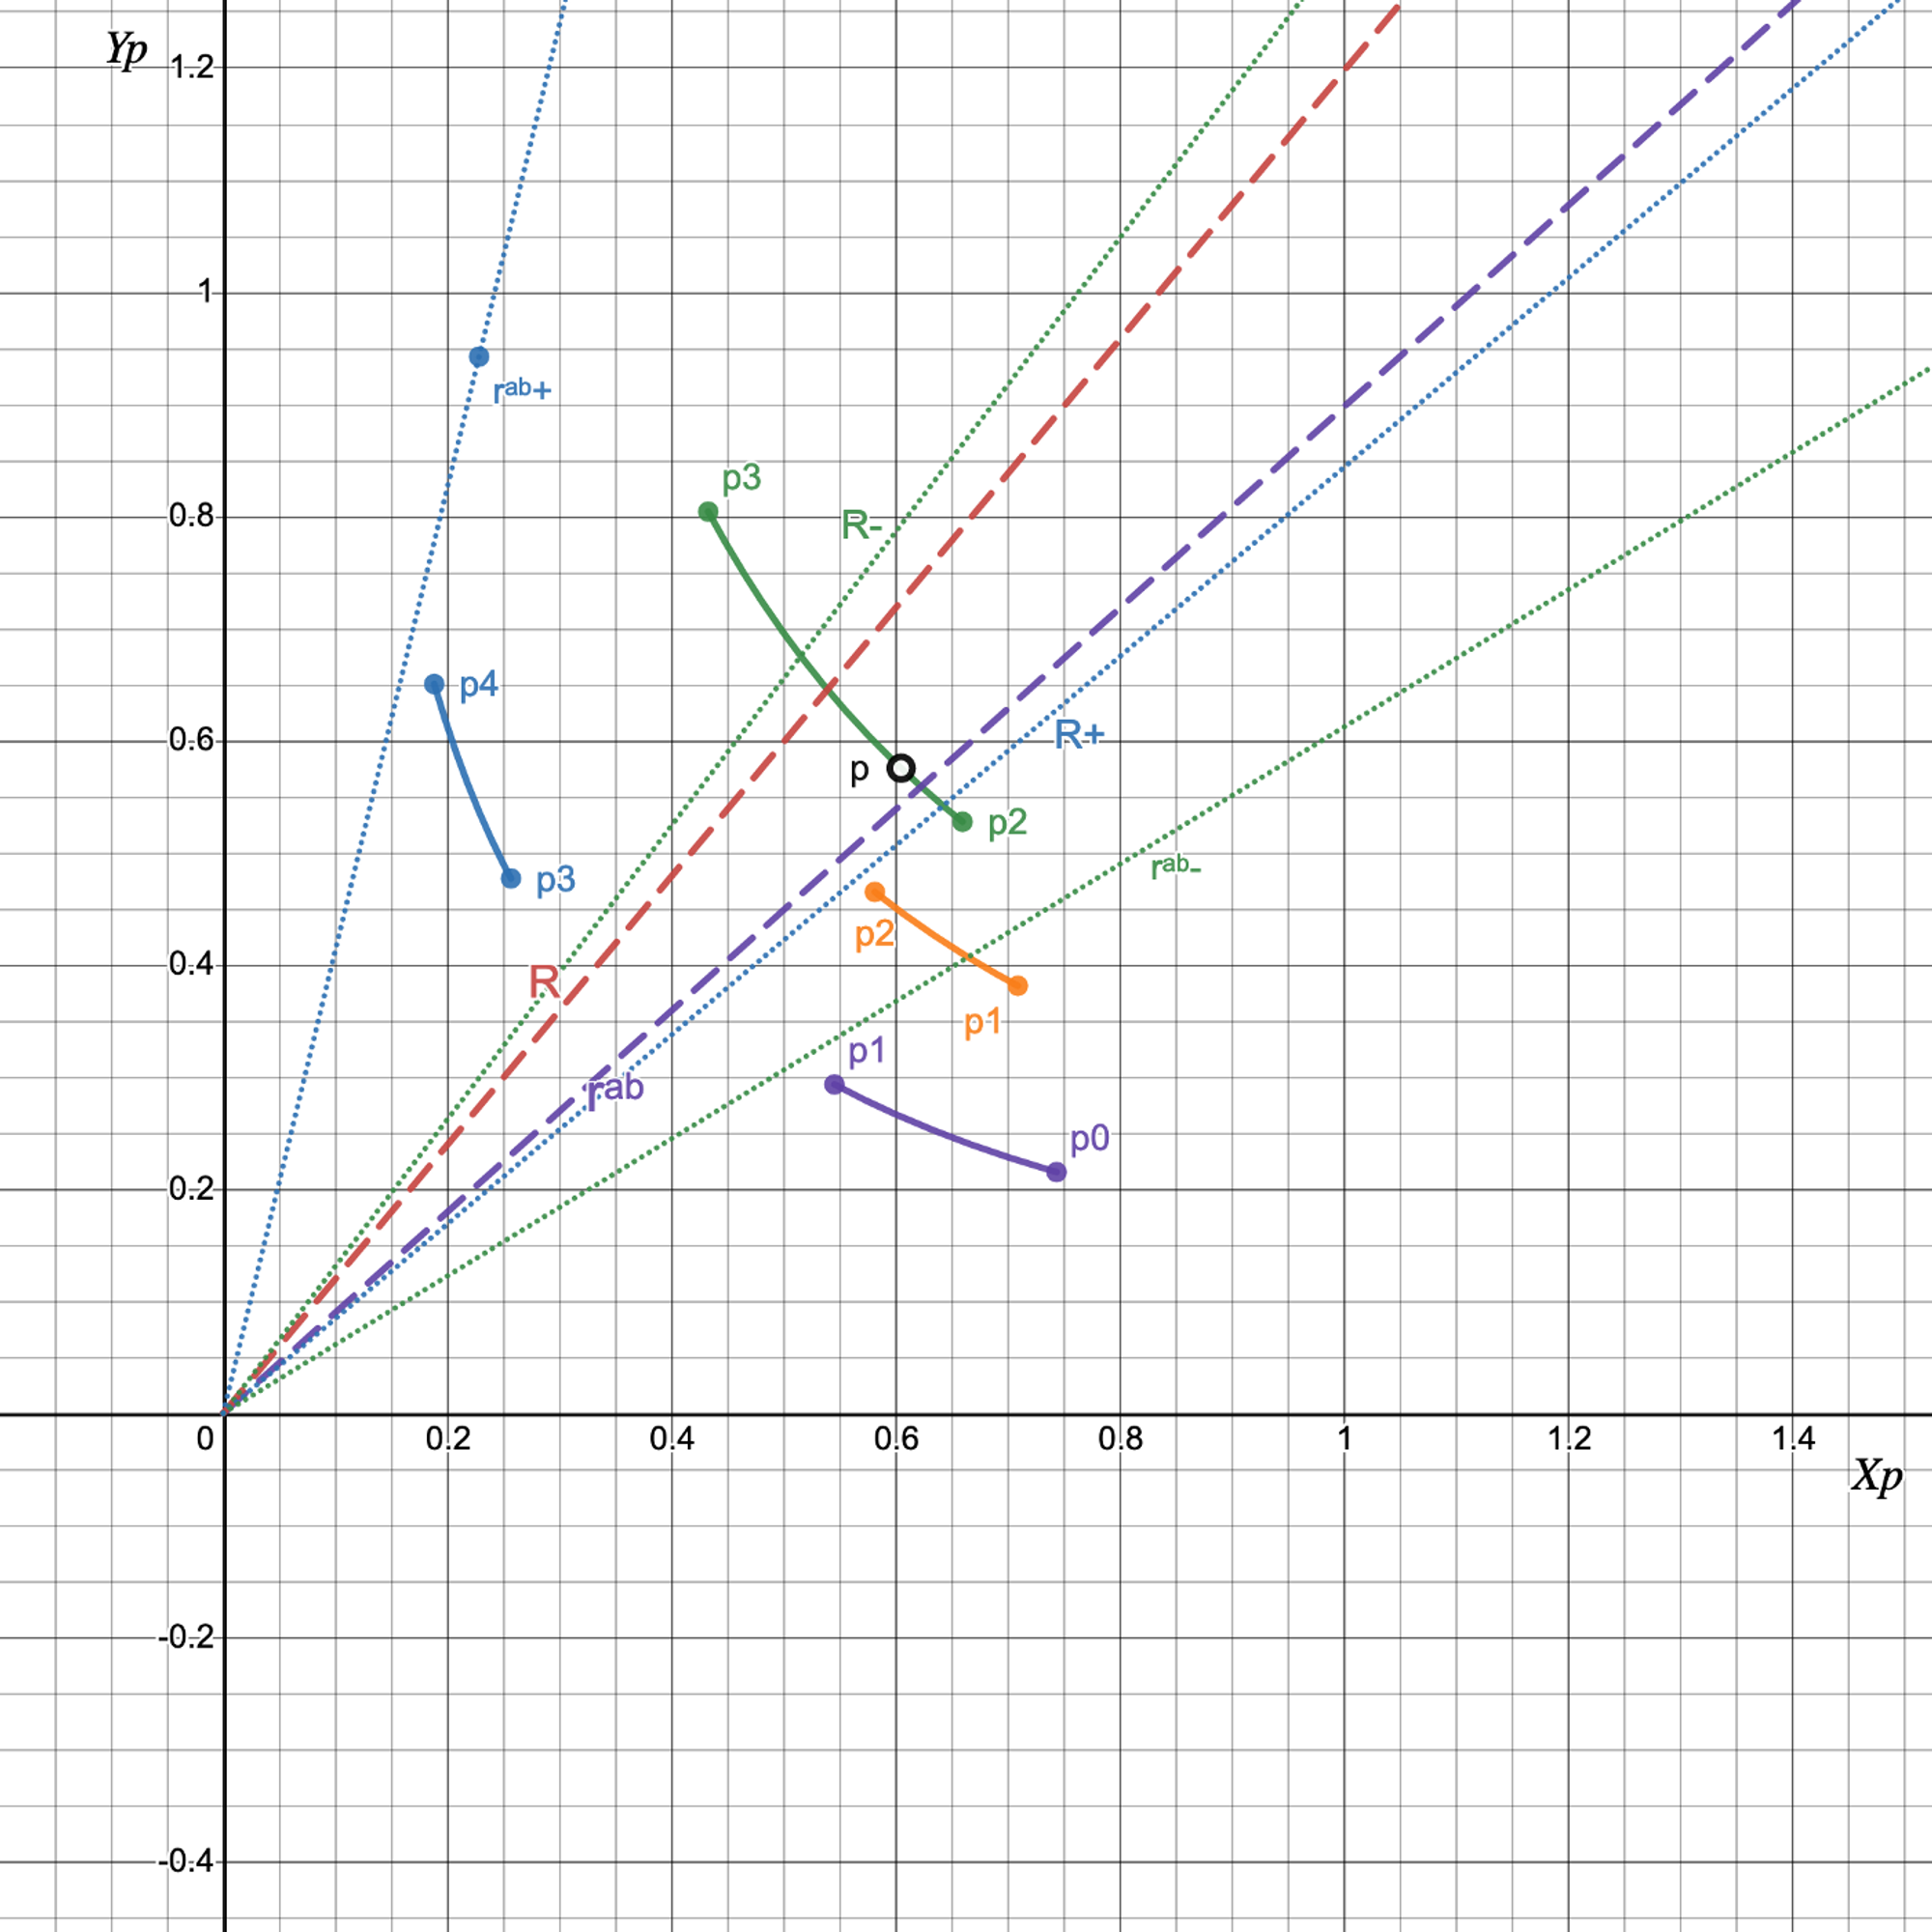
For non-stable assets, Curve V2 uses a market-making curve with the weighted sum of the constant product curve and the constant price curve, but it can dynamically adjust. The first-generation algorithm can only concentrate liquidity around a fixed price. At the same time, the new one can dynamically adjust this price and the degree of centralized liquidity according to the internal oracle. Curve V2 defines the K value as a dynamically adjusted parameter that determines the shape of the curve. The larger the value of K, the smaller the curvature, the closer the curve is to the constant price curve, and the more concentrated the liquidity.
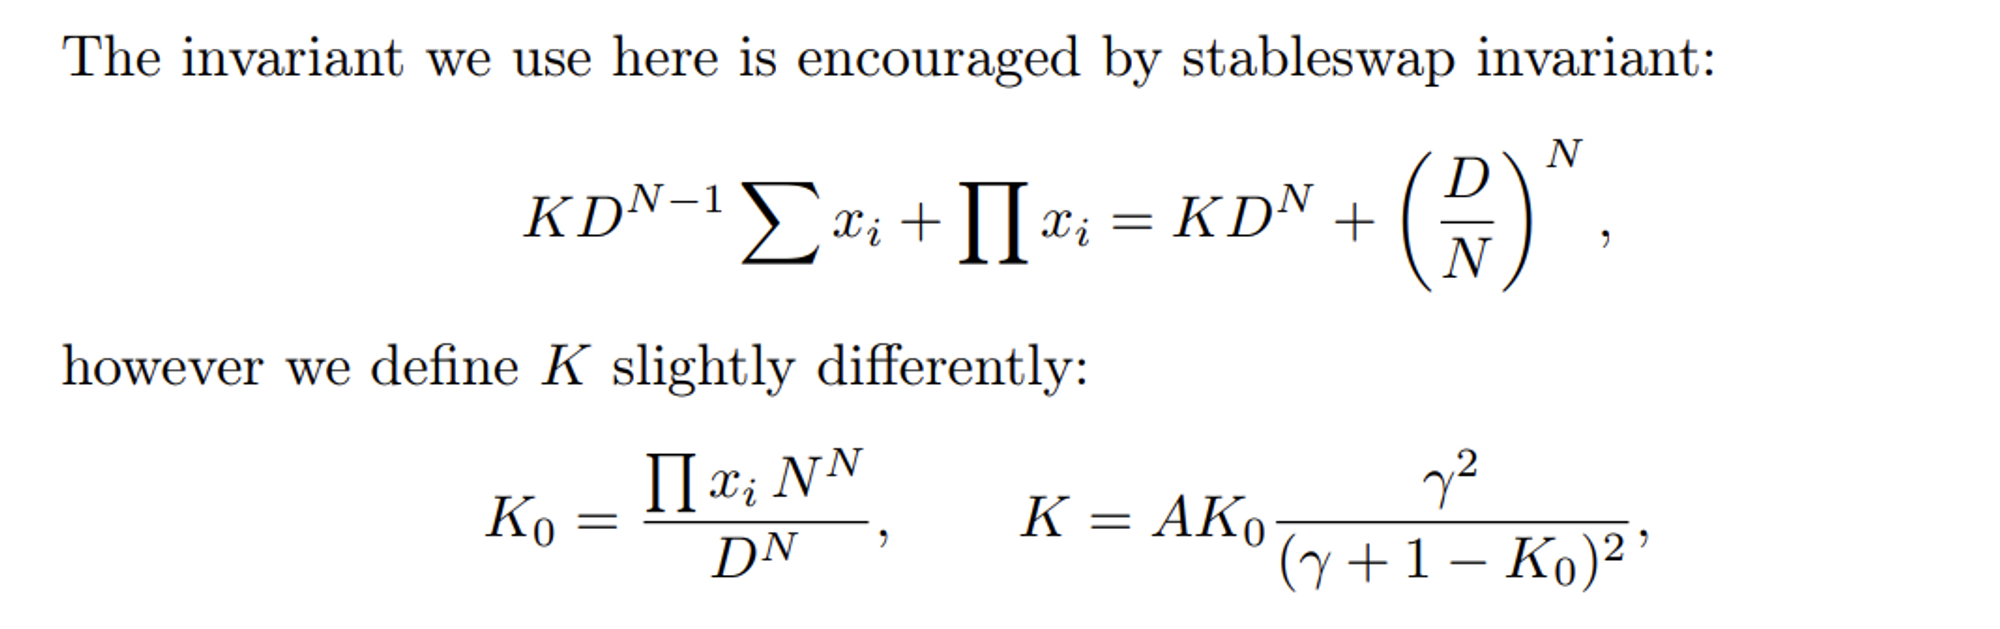
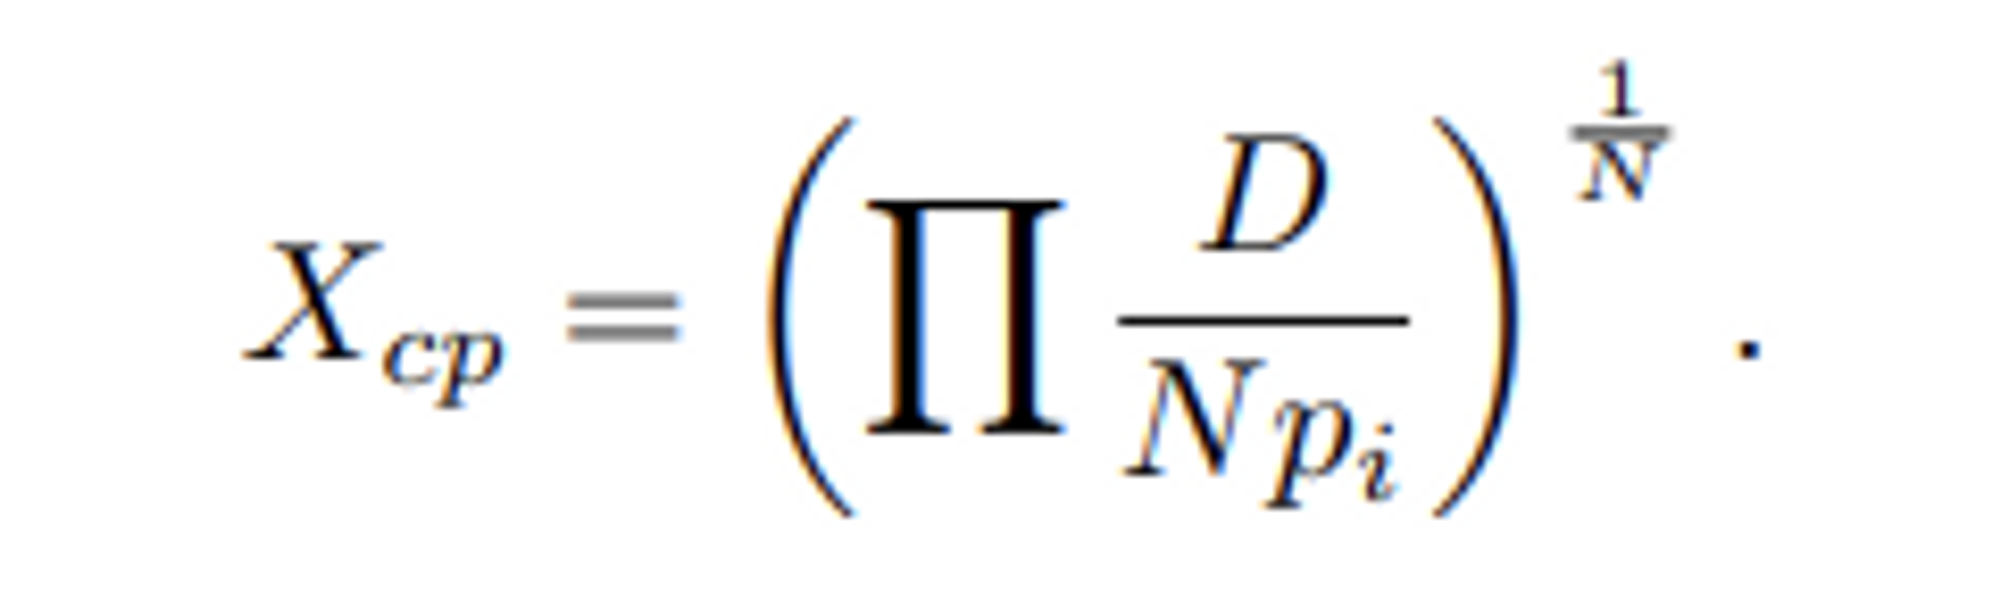
Curve V2 will calculate D according to the internal oracle. The parameter D determines the anchor price, which is the price with the most liquidity. The algorithm of Curve V2 concentrates liquidity by mixing constant product and constant price curves, continuously updating the weights of the two curves, and determining the anchor price of liquidity concentration with internal oracle price, and achieving liquidity concentration near the market price.
Design Analysis and its Pros & Cons
Curve V2 will calculate D according to the internal oracle. Parameter D determines the anchor price which has the most liquidity. The algorithm of Curve V2 concentrates liquidity by mixing constant product and constant price curves, continuously updating the weights of the two curves, determining the anchor price of liquidity concentration with internal oracle price, and achieving liquidity concentration near the market price.
-
Pros
-
Reduce the slippage near the market price through the original market-making curve to ensure market depth, and the algorithm is suitable for various tokens.
-
An internal oracle automatically adjusts the peg price to the market price.
-
Dynamically adjust transaction fees; the farther away from the price balance point, the higher the transaction fee, thus providing a better price near the market price.
-
-
Cons
-
The price adjustment of the internal oracle machine depends on the user's transaction behavior, which lags and cannot adjust the liquidity distribution in advance.
-
There is no explicit form for solving the equation, and it needs to be solved numerically (Newton's method), which has a high computational cost.
-
DODO
Market Maker Adjusted Curve
DODO provides liquidity with PMM algorithm, which introduces the external price. Market makers concentrate liquidity near the market price through independent quotations. Unlike AMM-based market-making algorithms, the PMM algorithm calculates the price based on external price and inventory. When the external price changes, the exchange ratio of the token will change. When users trade with the pool, the token inventory changes, and so as the price. The token price determined by the PMM algorithm depends on the external price and user trading behaviors. DODO thus can adjust the liquidity distribution in advance and always keep the liquidity near the external price.
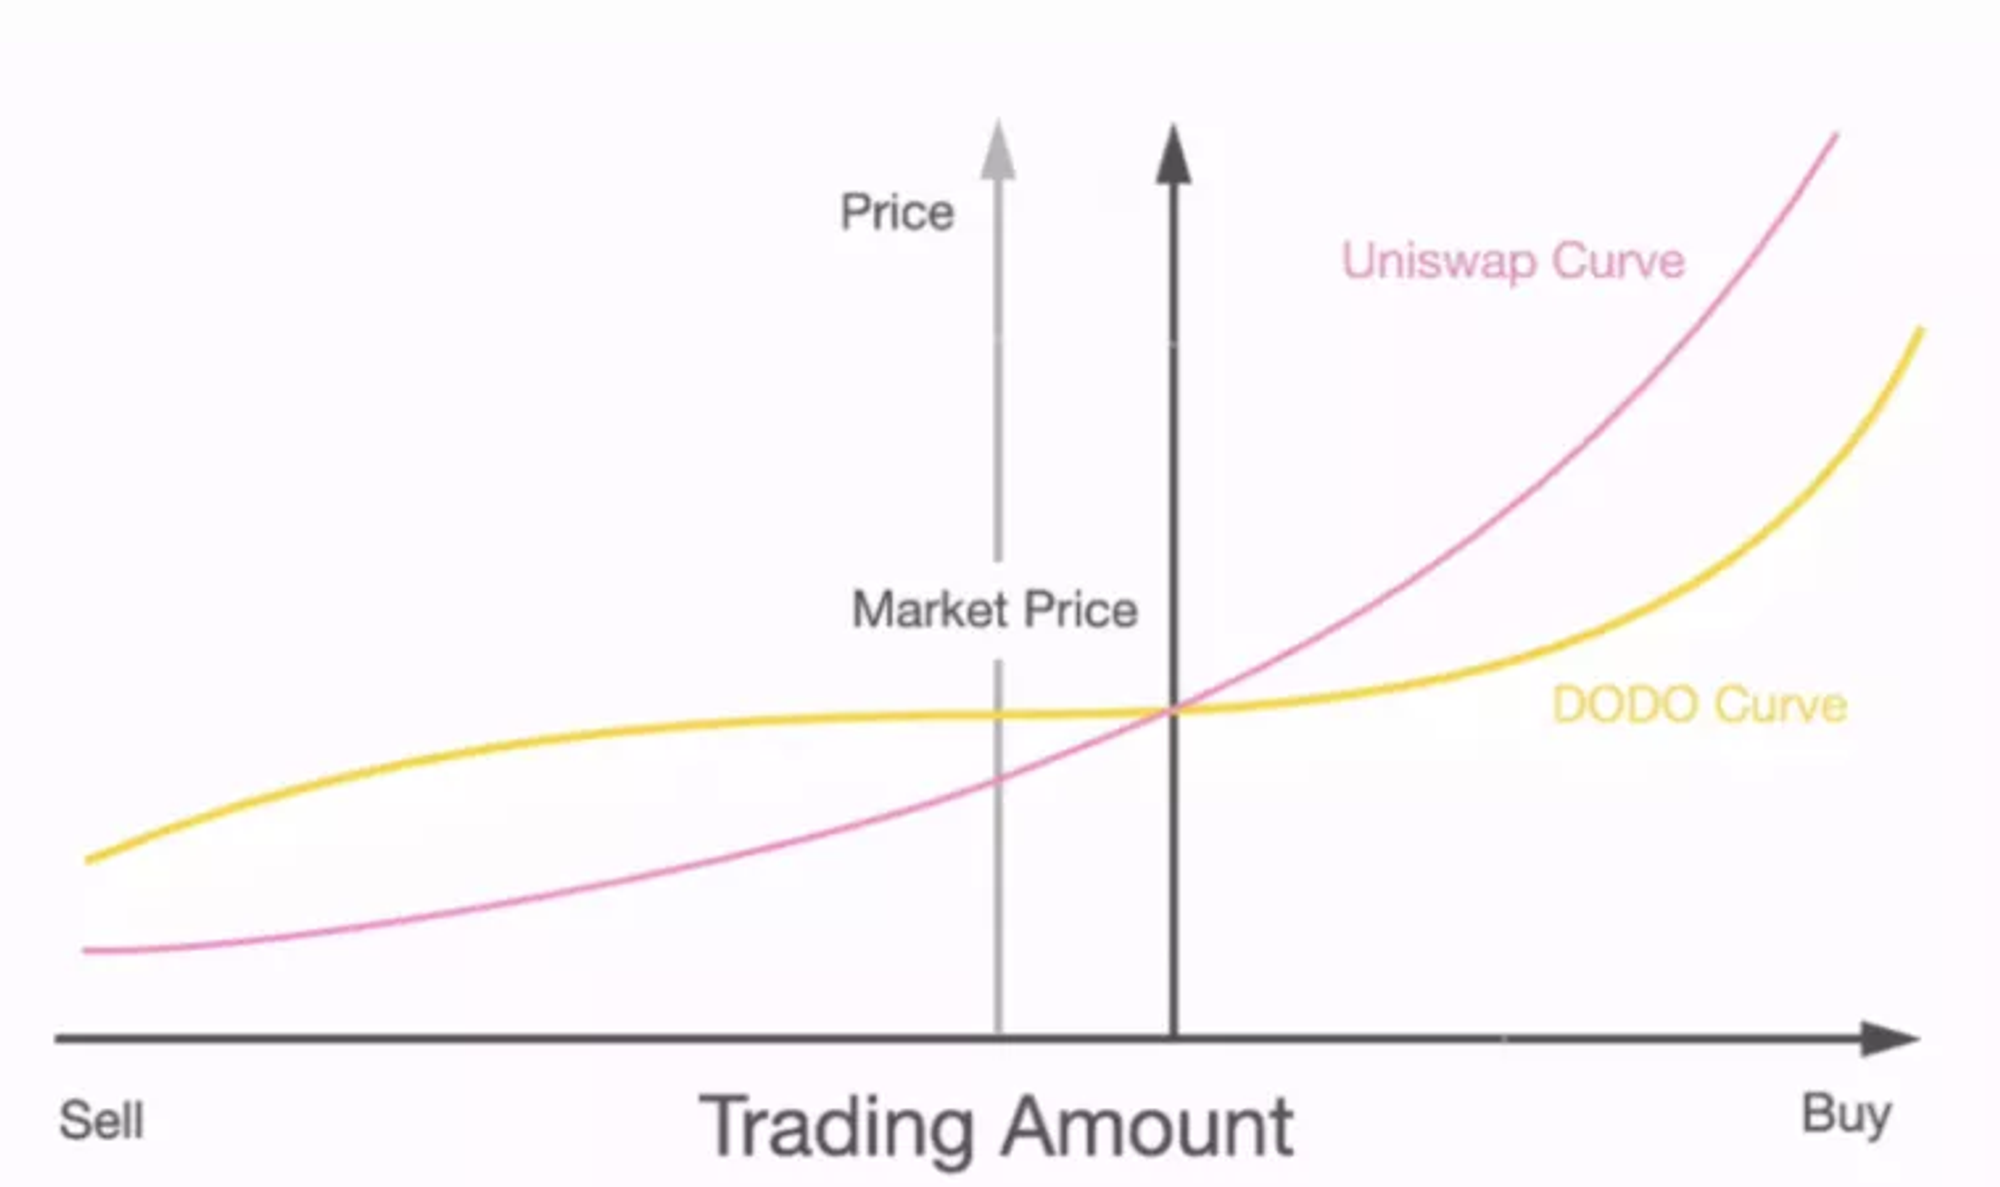
The form of the PMM algorithm is as follows: Parameter i refers to the external price provided by the market makers; Parameter k is the parameter that controls the degree of liquidity concentration. The smaller the k, the more concentrated the liquidity is. Parameters B and Q are the inventory of tokens. This formula describes the relationship of marginal price with changes in inventory and external prices.
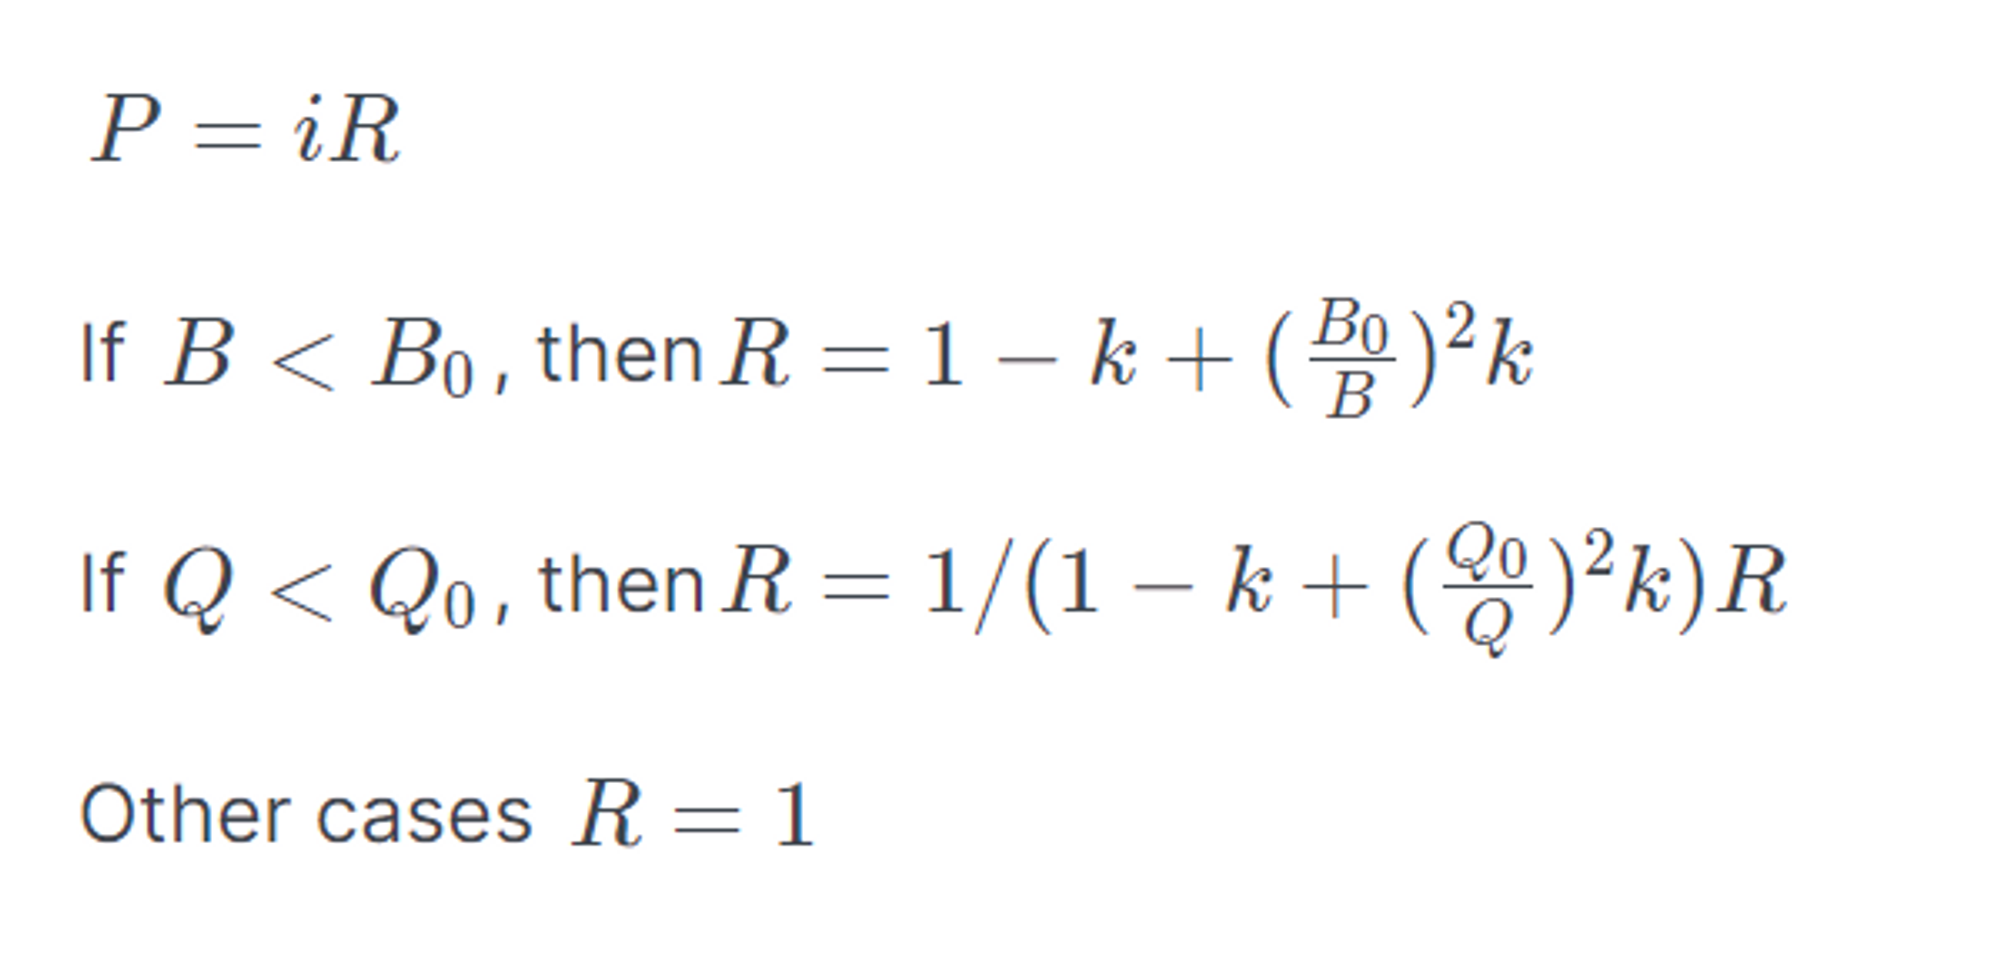
DODO also provides a flexible pool-building plan where users can set the parameters.
Design Analysis and its Pros & Cons
The design of DODO refers to the liquidity distribution of CEX. The market makers provide the external price, and the external price provided by the oracle is the market price supported by the user transactions in CEX. CEX now has a dominant position in market liquidity, so adjusting liquidity according to external prices will greatly improve the efficiency of market making.
-
Pros
-
Market-making is through the original PMM algorithm, introducing external prices, concentrating liquidity at the market price, and providing low slippage transaction prices.
-
High capital efficiency; support larger transaction volume under the same capital.
-
The adjustment speed of liquidity distribution is fast so that the liquidity of DODO can quickly synchronize with the market.
-
-
Cons
-
Relying on external prices, there is a risk of market maker's quotation deviation, and external prices represent high liquidity in the market, not the liquidity within DODO.
-
The k value in the anchor pool is a set value, and there is no dynamic adjustment mechanism.
-
Comparison of Market-Making Curves - taking ETH trading pool as an example
Data Process
Each has different market-making algorithms, comparing the trading pools of different DEXs is very difficult, including data source issues, comparative analysis issues, and how to determine a comparison standard.
Thus, the data analysis in this paper is processed as follows:
-
Select the USDC/WETH 0.05% pool on Ethereum of UniV3, the USDT/WBTC/WETH 3crypto pool on Ethereum of Curve V2, and the USDC/WETH dpp pool on Polygon of DODO as samples. These three pools are all WETH trading pairs for stablecoins. We directly query the smart contract data, get the underlying parameters, and calculate the liquidity distribution according to the market-making curve of each exchange.
-
Liquidity data ranges from January 1, 2022 to August 16, 2022 with a data interval of one hour.
-
Volume and TVL data range from June 16, 2022 to August 16, 2022.
-
All data samples are time-stamped and block heights are synchronized.
-
All data visualization parts are normalized for the unification of visual effects.
-
For calculation processing, the total liquidity distribution adopts the liquidity of ETH price in the range of 100 to 10000.
-
Changes in liquidity distribution within the selected time span, 2% represents the proportion of liquidity in the price range of plus or minus 2% of the market price to the total liquidity, 6%, 10% is the same.
Liquidity Distribution Data Performance - Is Liquidity Really Concentrated?
Uni V3
💡 For Uni V3's USDC/WETH 0.05% pool on Ethereum, the overall liquidity has a high concentration level and large volatility, and varies in different market environments. In some cases, there is a large deviation between the market price and the price with the highest liquidity.
- Mean of Liquidity Distribution
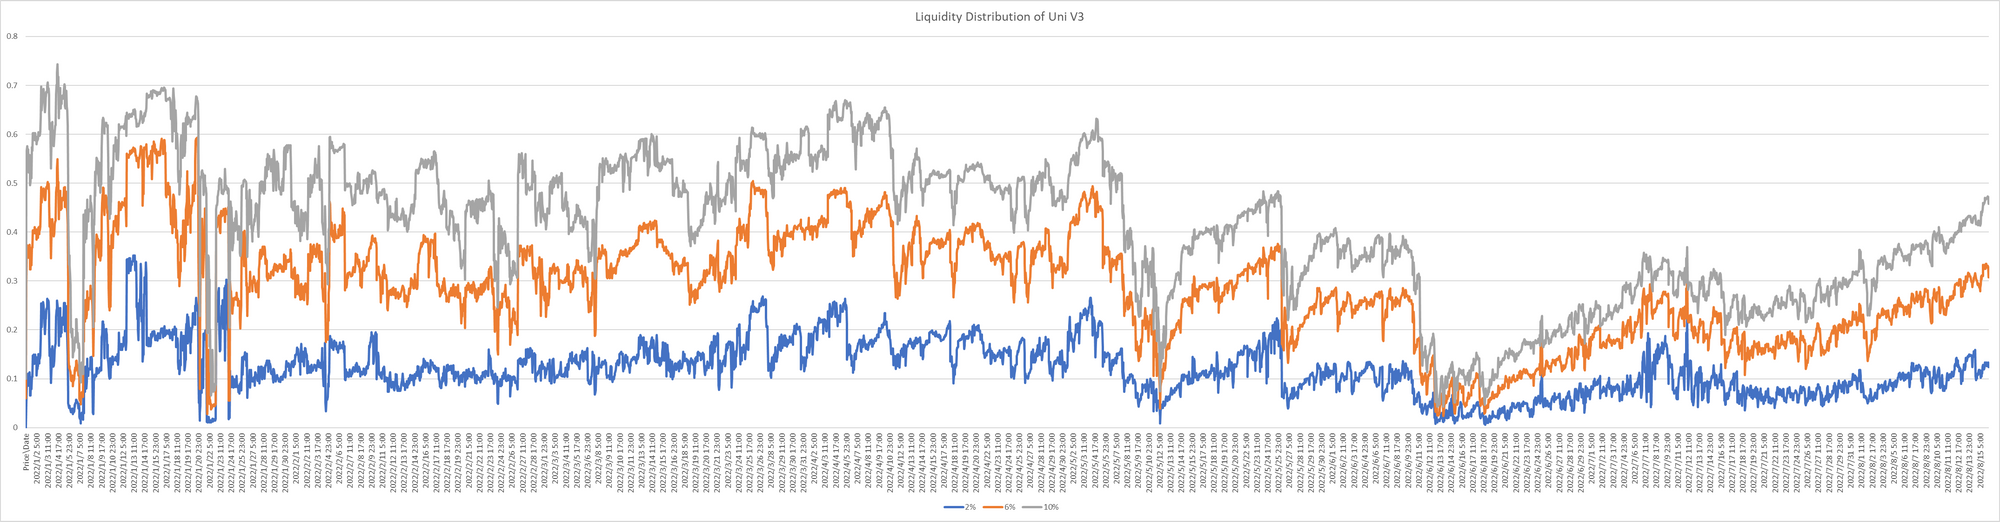
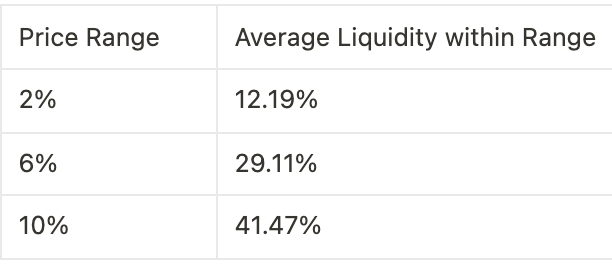
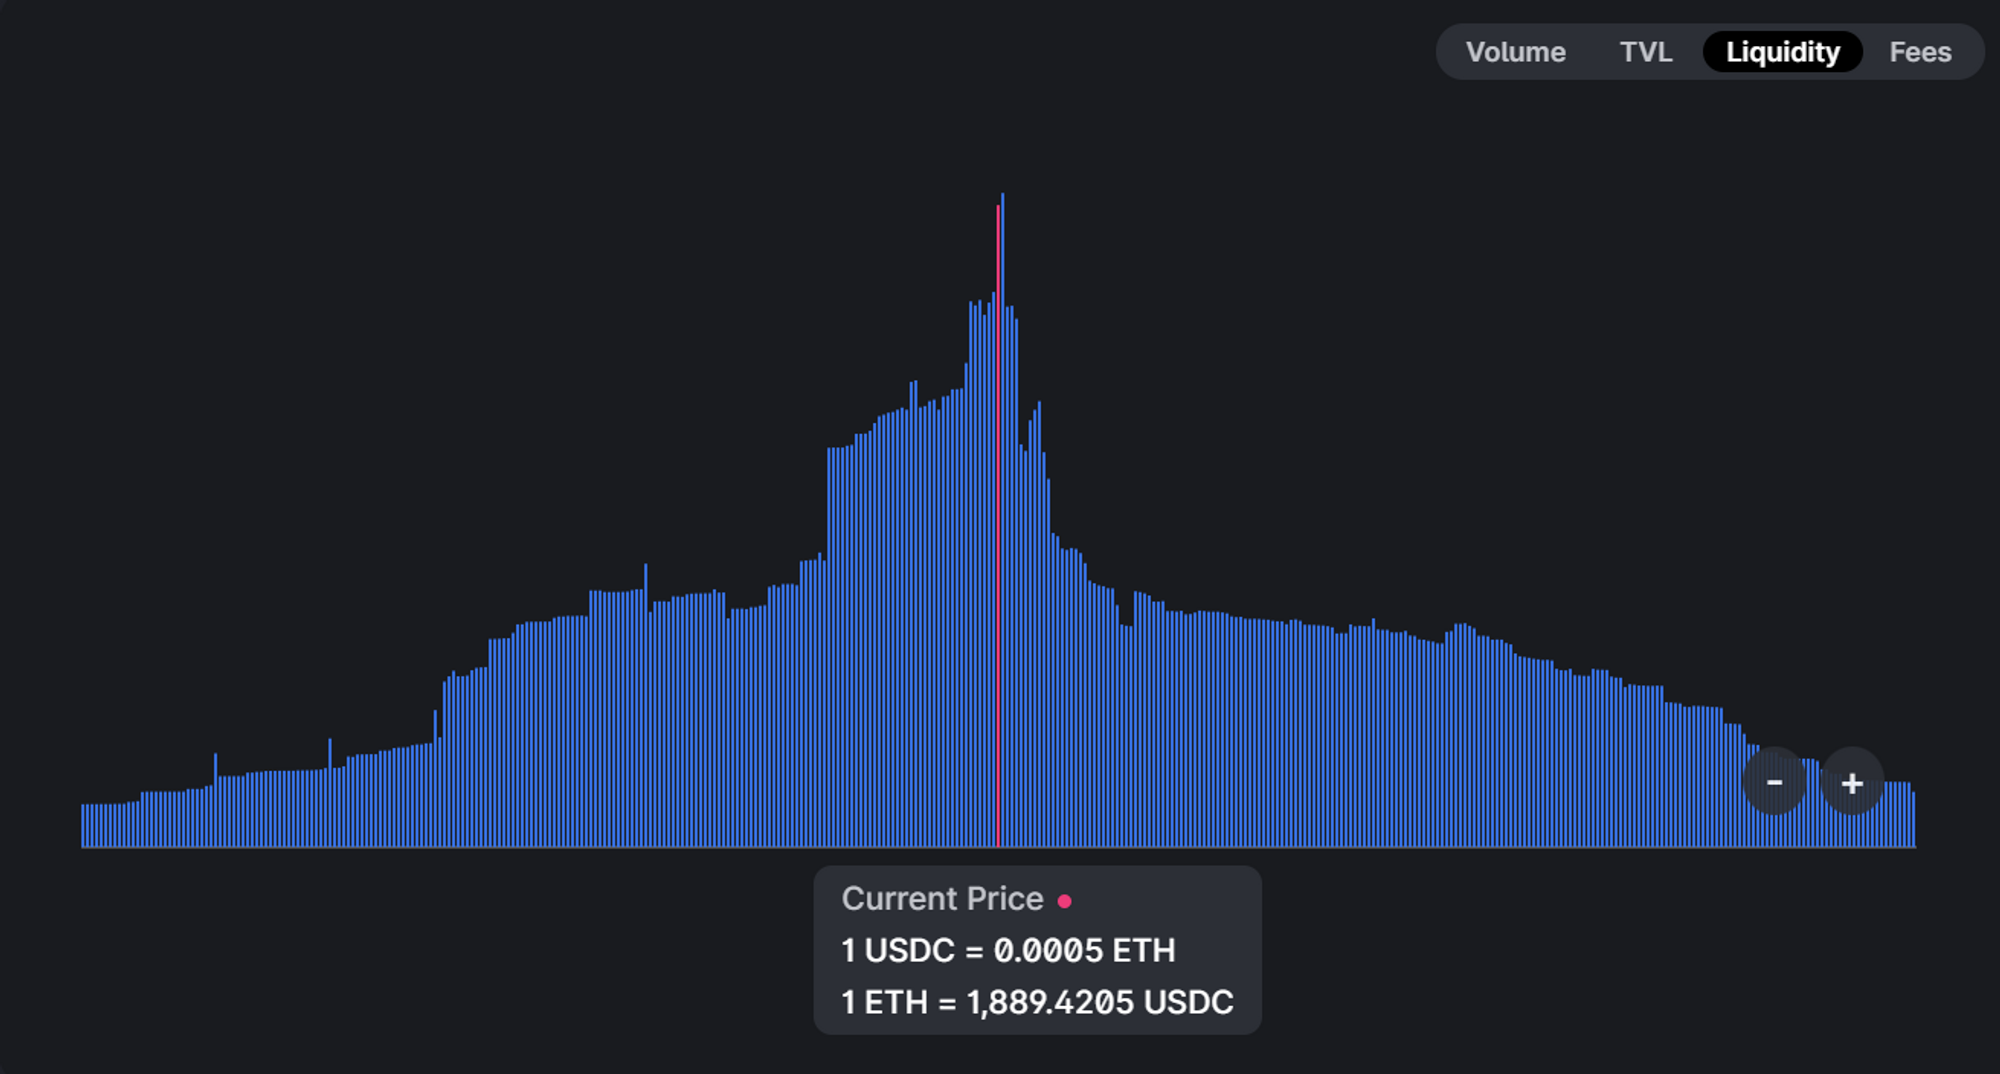
The figure shows that the liquidity of Uni V3's 0.05% WETH/USDC pool has a high liquidity concentration most of the time. The liquidity within 10% accounts for an average of 40% of the total liquidity. It almost achieves concentrated liquidity. Overall, the liquidity concentration of Uni V3's WETH 0.05% pool has maintained a high level over a long period, realizing the design purpose of V3.
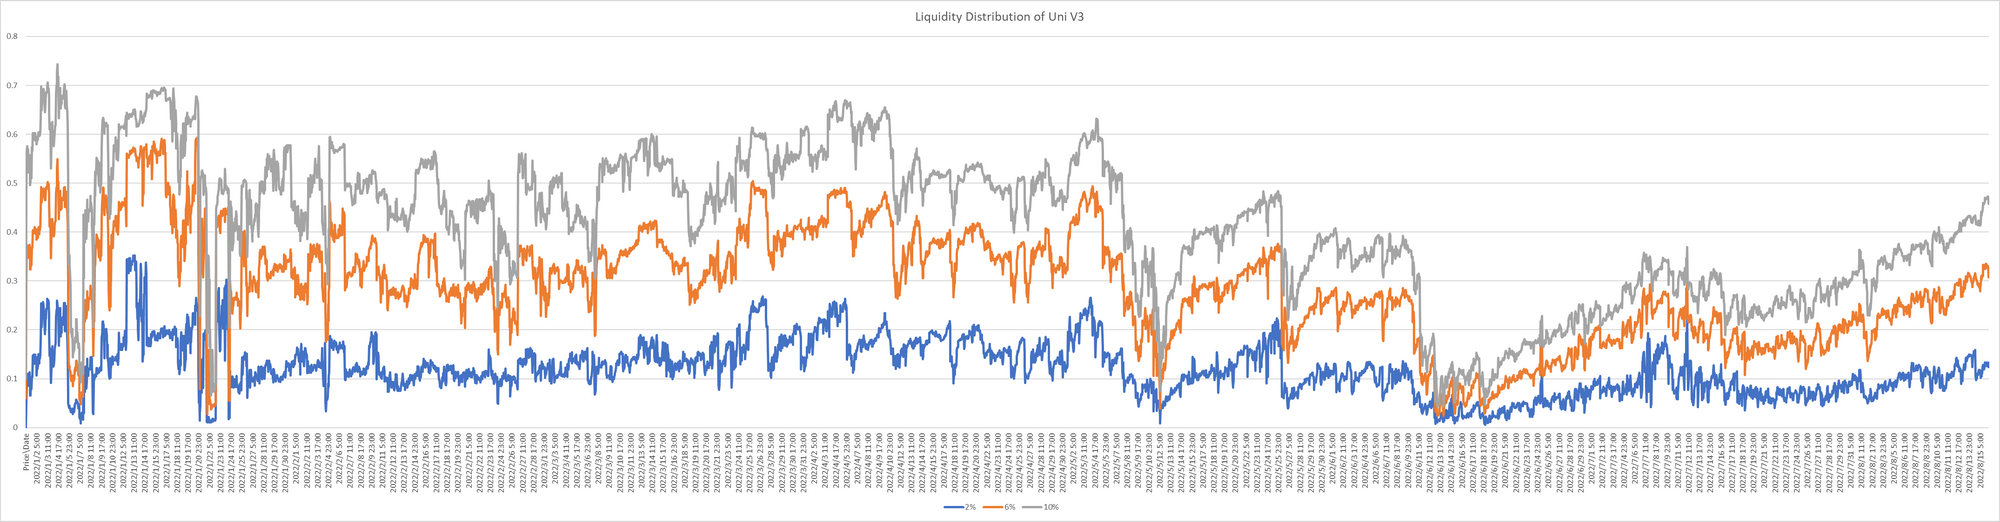
The data shows that when the market fluctuates greatly, the liquidity distribution of the pool will change significantly, and the liquidity concentration near the market price will decrease rapidly. For example, we take two periods: from May 6th to May 13th and from June 10th to June 19th. In these two periods, along with the sharp drop in the price of ETH, the liquidity distribution of the pool had a rapid adjustment. A large number of user behaviors led to a significant decrease in the degree of liquidity concentration near the market price. The market-making range was adjusted to outside the market price, and the liquidity within 10% was reduced to below 10%. Therefore, we conclude that when the market price fluctuates violently due to the mechanism design of Uni V3, users will predict the market and withdraw liquidity in advance, reducing liquidity concentration.
The above picture compares the price with the highest liquidity and the market price. Observing the degree of deviation between the most liquid tick range and the market transaction price range, we can tell that the tick price with the highest liquidity in UniV3 is relatively close to the market price most of the time. But at some point, there is a big deviation.
DODO
💡 The liquidity distribution of DODO's USDC/WETH pool is the most concentrated because DODO market makers generally set the K value to a very small value and update the reference price frequently to concentrate liquidity. Due to the high frequency of quotations by market makers on DODO, the market price and the price with the highest liquidity remain highly anchored.
- Mean of Liquidity Distribution
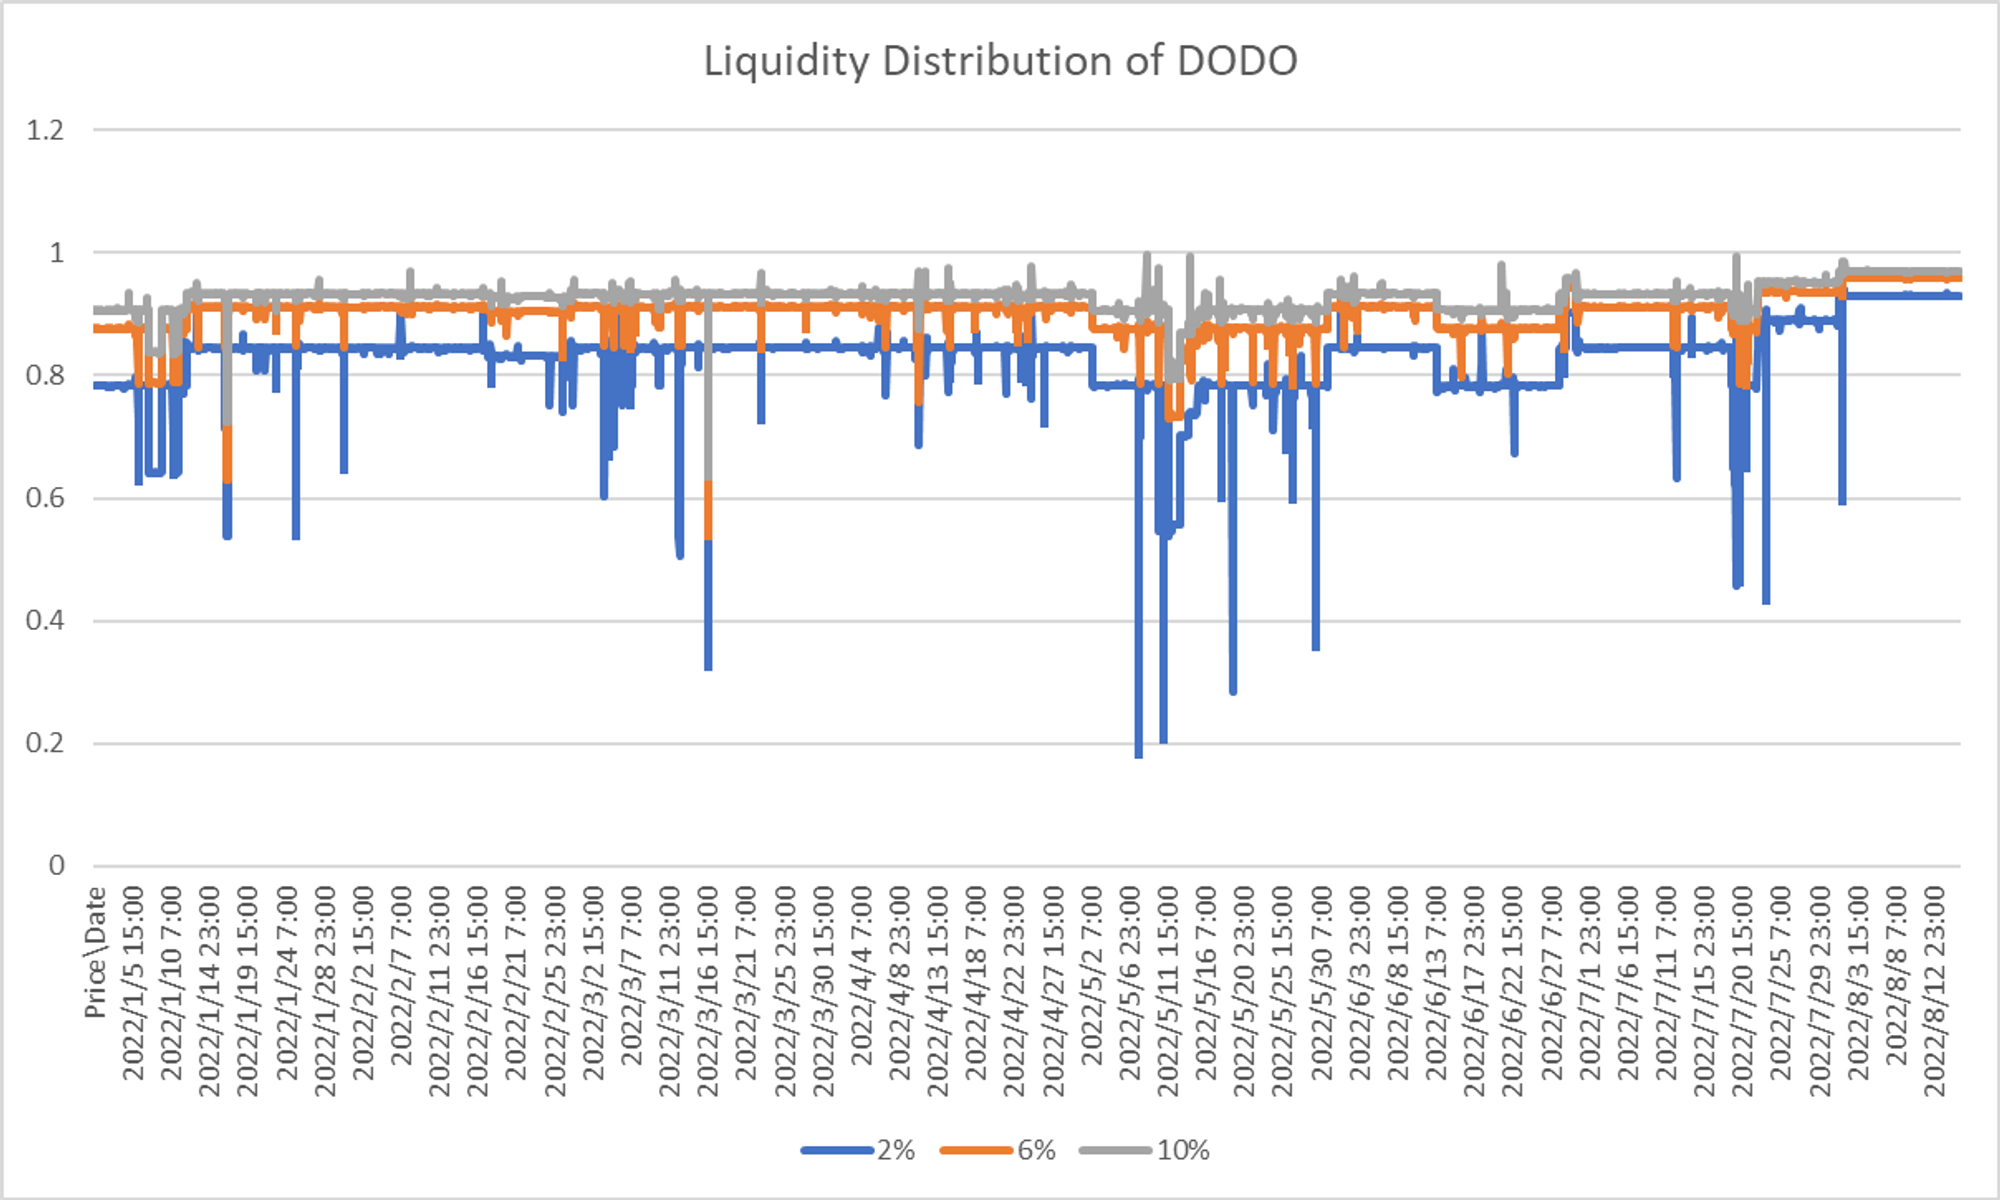
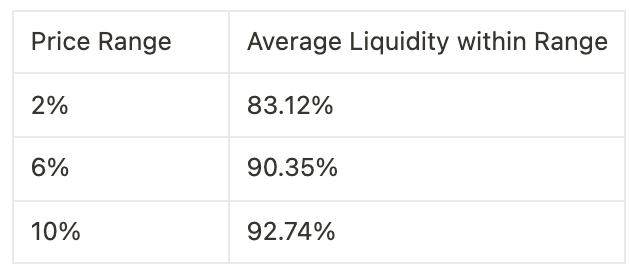
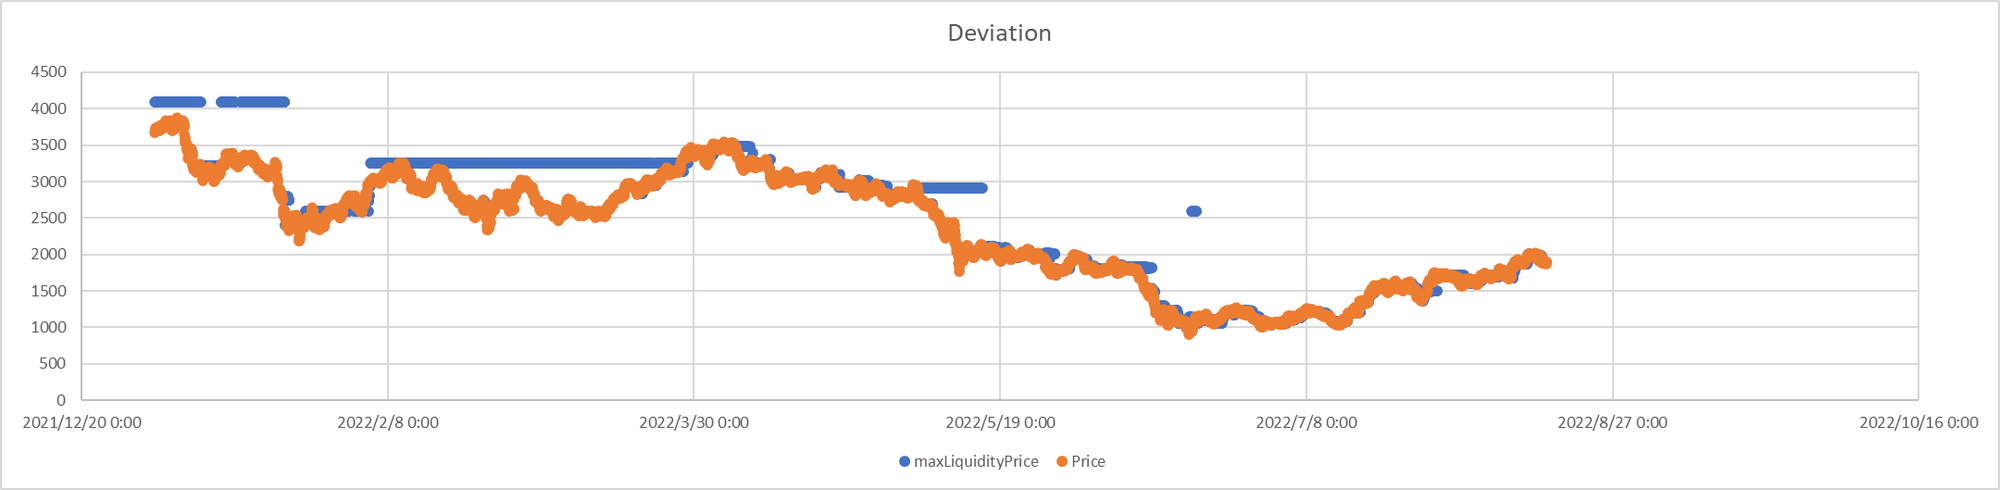
The liquidity distribution of DODO's USDC/WETH pool fluctuates greatly, and the liquidity concentrates around the market price has a very high degree. From the data, DODO's market makers generally set the K value to 0.01 at a minimum to achieve a high concentration of liquidity. However, market makers quickly adjust the external price and liquidity distribution when the market conditions are extremely volatile. Since the PMM algorithm provides very flexible adjusting choices, the adjustments of liquidity distribution are very flexible. Generally speaking, the level of liquidity concentration is relatively high.
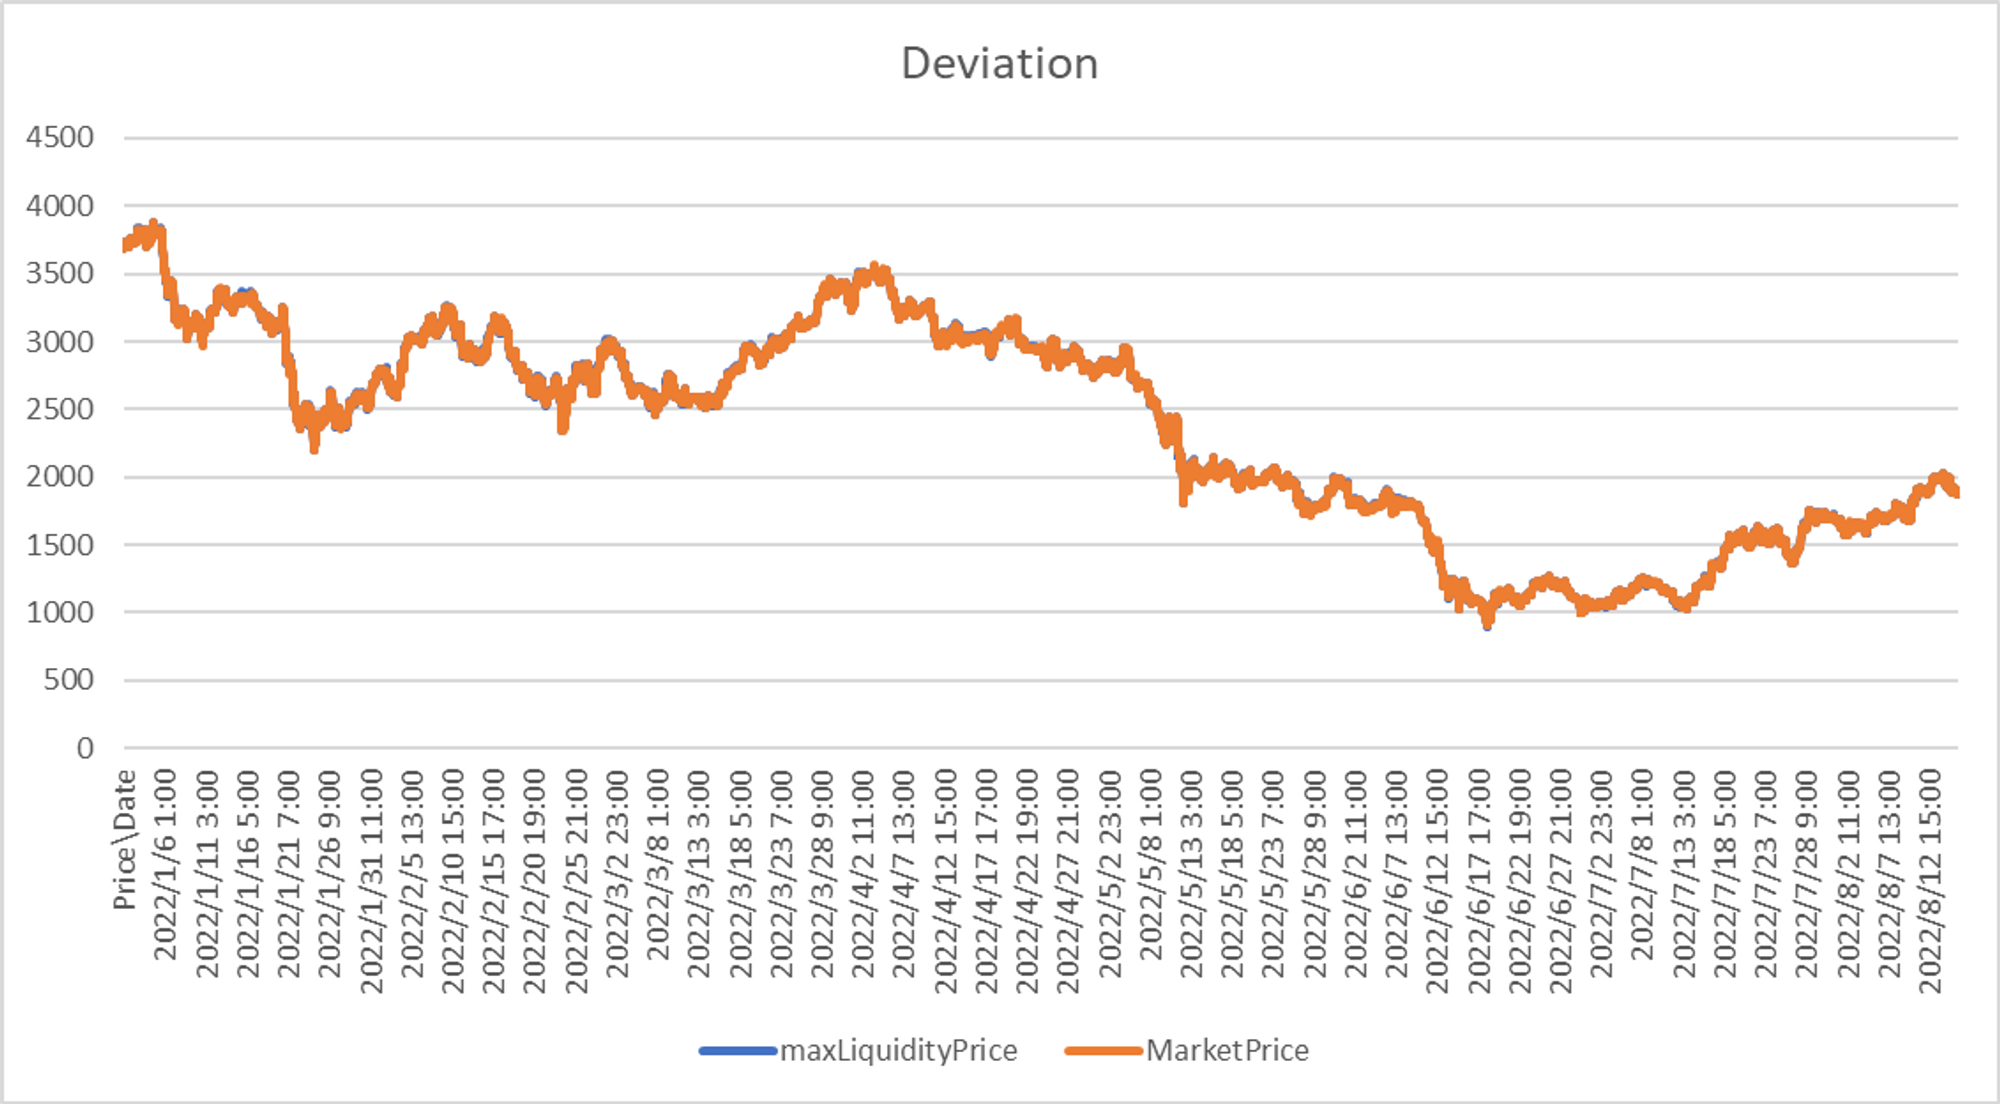
The market price of the pool and the price with the highest liquidity remain highly anchored because market makers provide price quotations with DODO's PMM algorithm. At the same time, the price with the highest liquidity is the external price offered by the market makers. The above figure also shows that the external price is not much different from the market price. It means that no large-scale user transactions will cause the market price to deviate significantly from the market maker's quotation. The DODO market maker's quotations can keep up with market changes promptly.
Curve V2
💡 The USDT/WBTC/WETH pool of Curve V2(the 3crypto pool) has a high degree of liquidity distribution and low volatility. There is some deviation between the market price and the price with the highest liquidity most of the time, in less than 1%. The user behavior will lead to the price adjustment of the internal oracle machine, and the dynamic simulation of the changes of Curve V2 is more complicated. Since there are differences between the off-chain computing environment and the on-chain computing environment, this article does not consider the dynamic changes of Curve V2, the liquidity distribution in a low price range is more informative.
- Mean of Liquidity Distribution
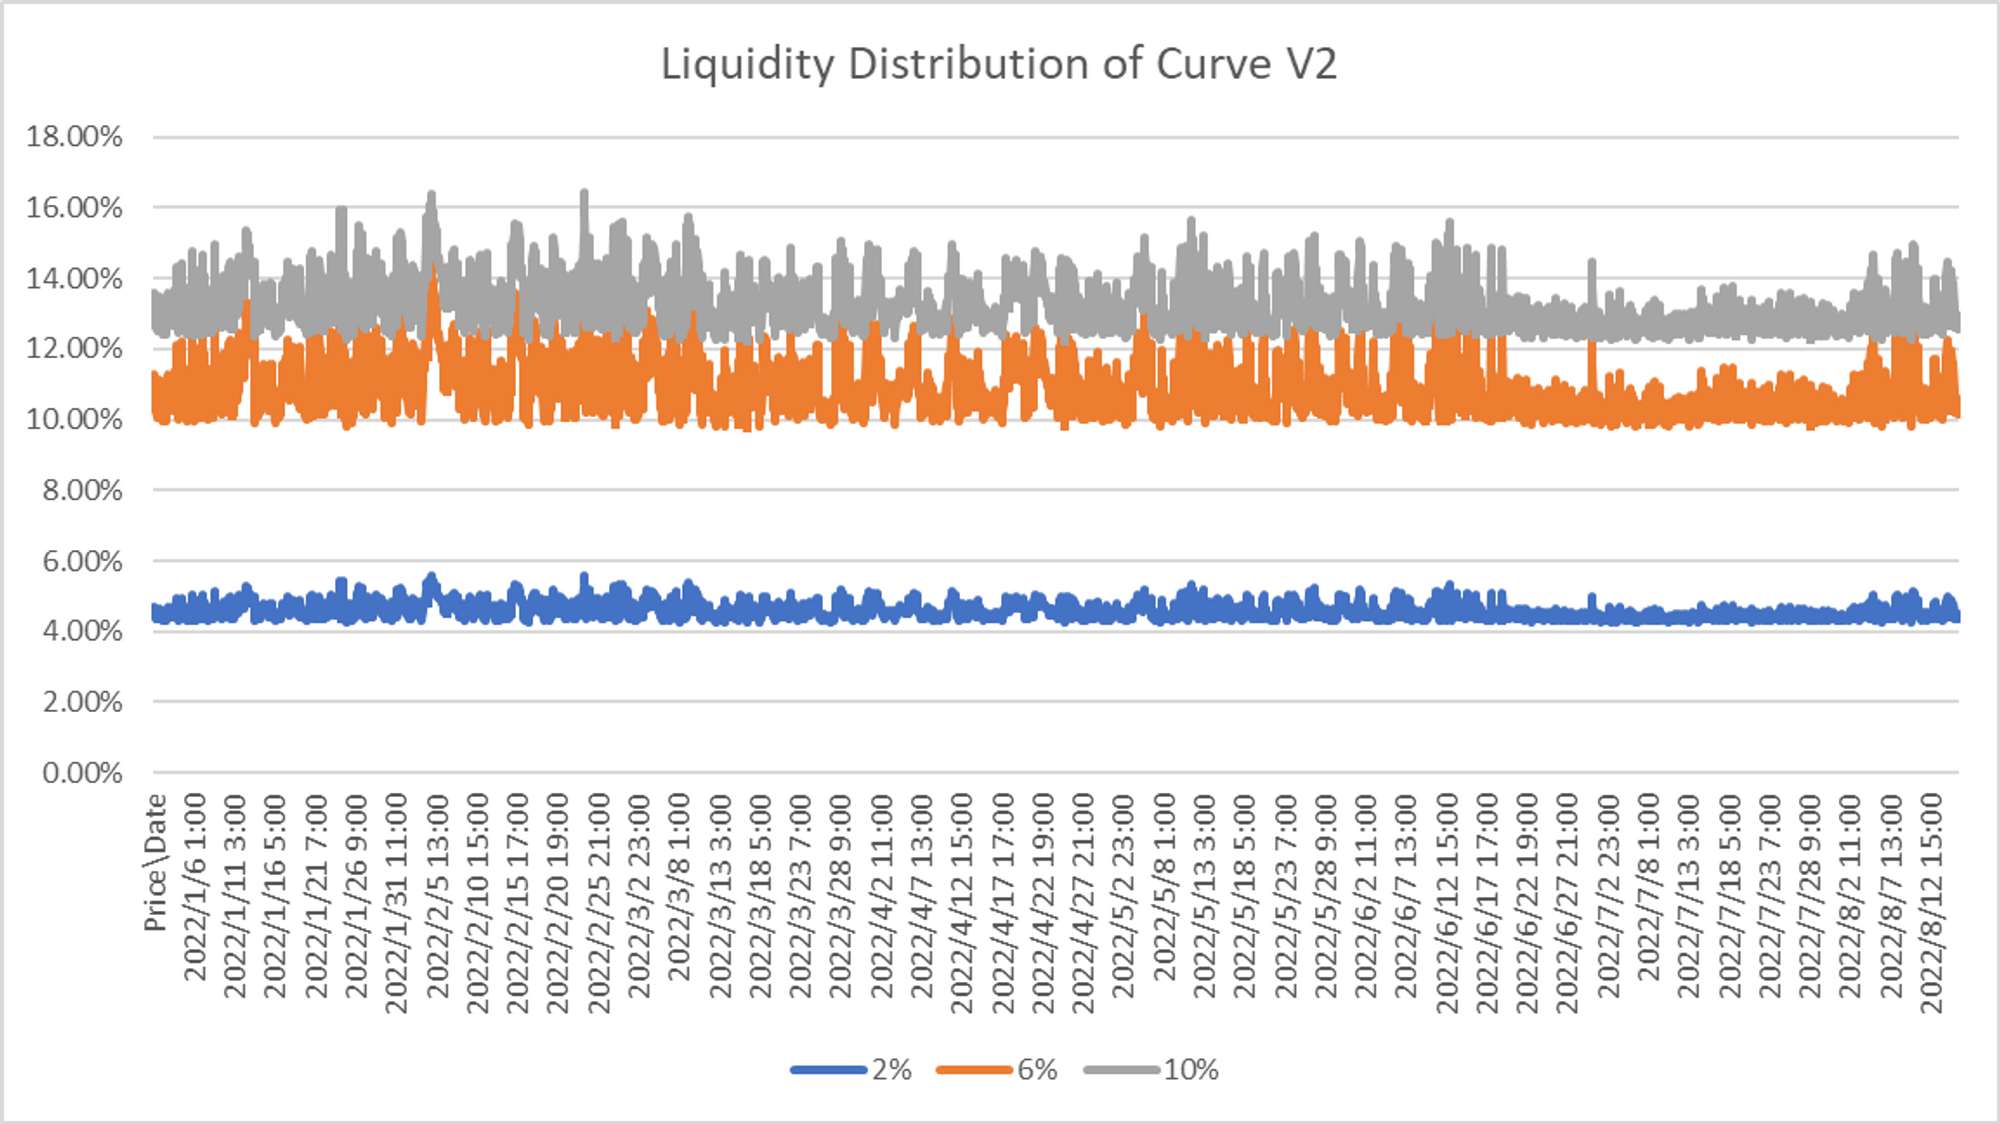
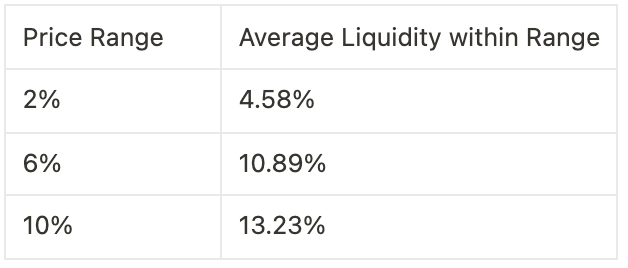
The liquidity distribution of Curve V2's USDT/WBTC/WETH pool has small fluctuations, and the larger the price range is, the higher the volatility. The liquidity concentrates near the market price to a higher degree. Curve V2's algorithm determines its unique volatility characteristics. Curve has a dynamically adjusted curve. The larger the price range is, the greater the impact. Similar to DODO's algorithm, the price of the internal oracle will adjust when the user's trading behavior makes the price deviate, and the internal oracle of Curve V2 will adjust. Thus the liquidity of 6% and 10% of the price range may not mean real market depth in actual trading.
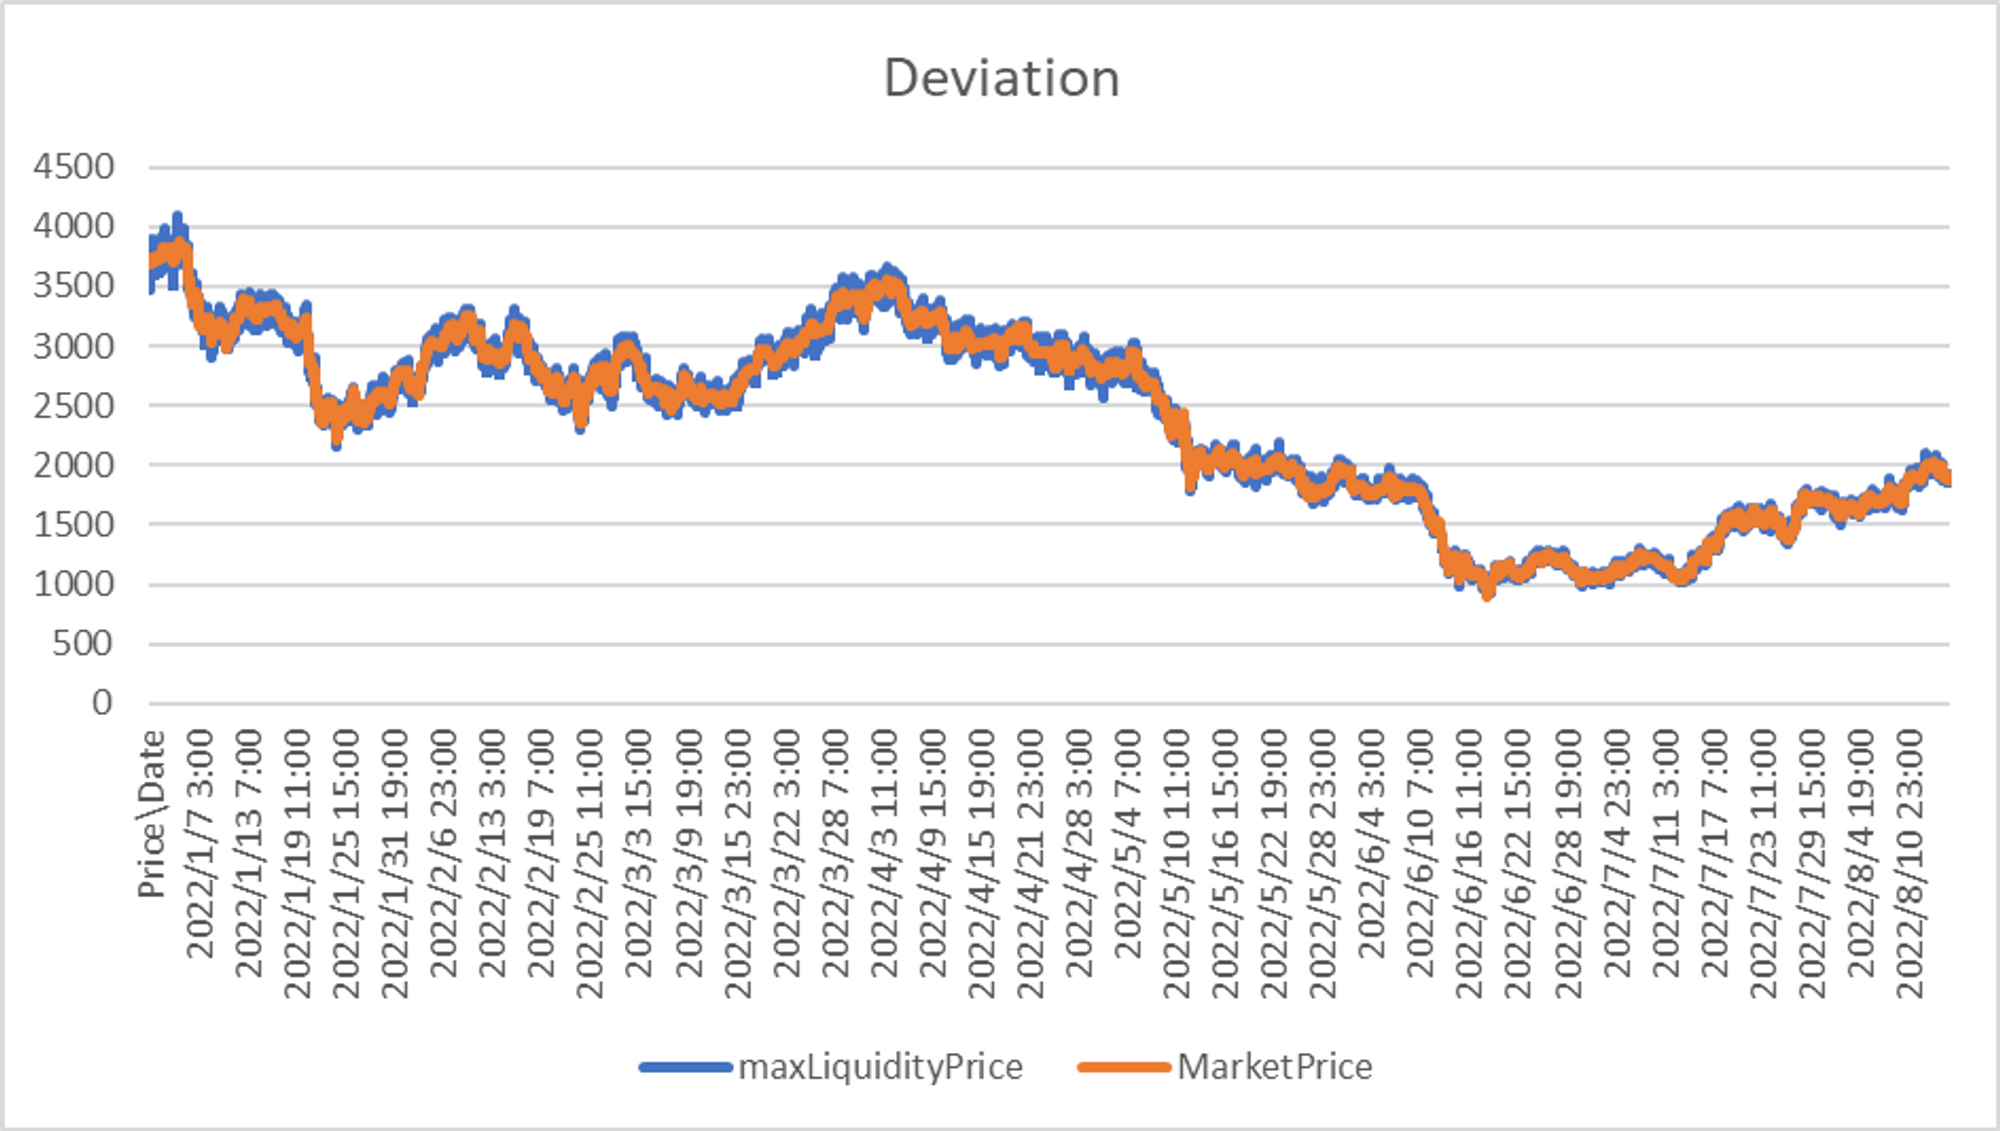
There is still a certain deviation between the price of Curve's internal oracle and the market price. Although the degree of deviation is small, there is a slight deviation in most cases, which shows that the price adjustment of Curve's internal oracle has time stagnation. The characteristics of the algorithm itself bring this about. Since Curve will update the price of the oracle machine when the user's transaction makes the price deviate from a certain threshold, there will be a certain time lag, but the price deviation of Curve is slight.
Market Performance —— Difference of Capital Efficiency?
This paper obtains the transaction volume and TVL data of the three sample pools and uses Volume/TVL as capital efficiency. Capital efficiency measures the transaction volume. There is a large difference in the scale of the transaction volume and TVL among the three sample pools, thus we choose only to compare capital efficiency.
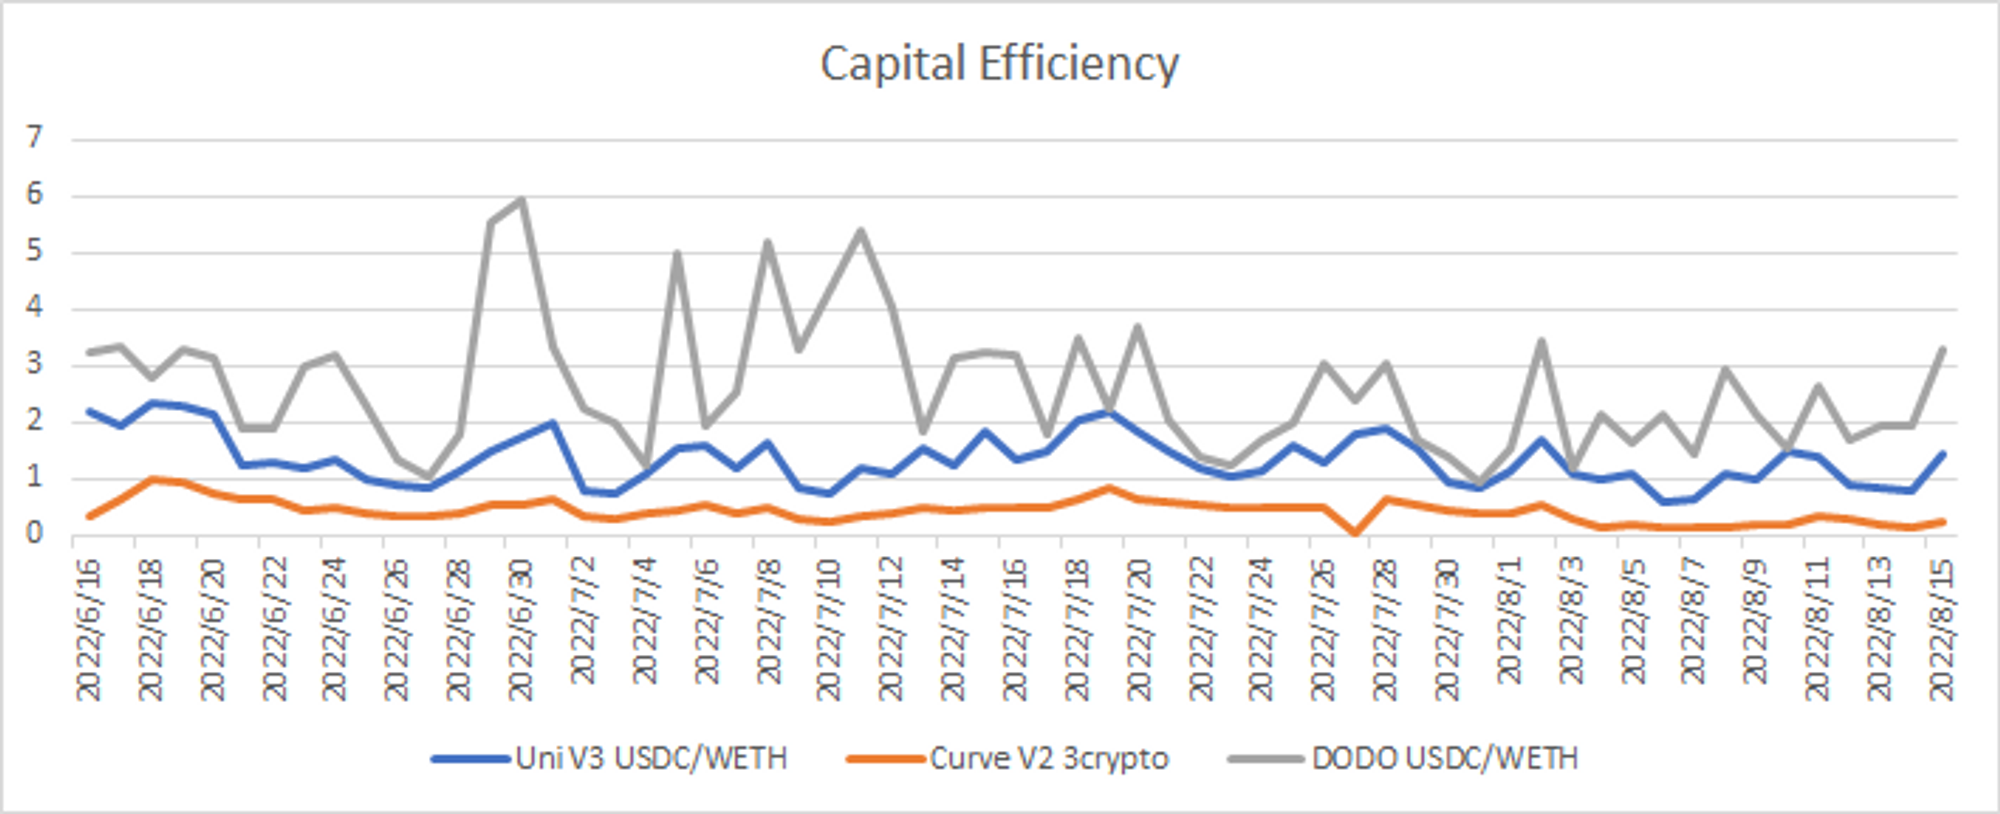
In terms of performance, the capital efficiency of DODO USDC/WETH is higher than that of Uniswap USDC/WETH pool and higher than that of Curve 3crypto pool. It is consistent with the corresponding liquidity distribution performance. DODO's market maker pool has professional market makers to provide quotations, and its capital efficiency is very high. Uniswap's USDC/WETH pool is the top pool in its trading volume, with sufficient liquidity. While for high liquid assets such as ETH, Uni V3 can concentrate liquidity and improve capital efficiency. Moreover, DODO's algorithm works better on stable assets with stable value, such as stablecoin trading pairs.
Overall Market Performance Analysis
The above compares and analyzes different algorithm designs by selecting sample pools of WETH and stablecoin trading pairs. Next, we will compare these three Dexs’ overall market performance.
Trading Volume
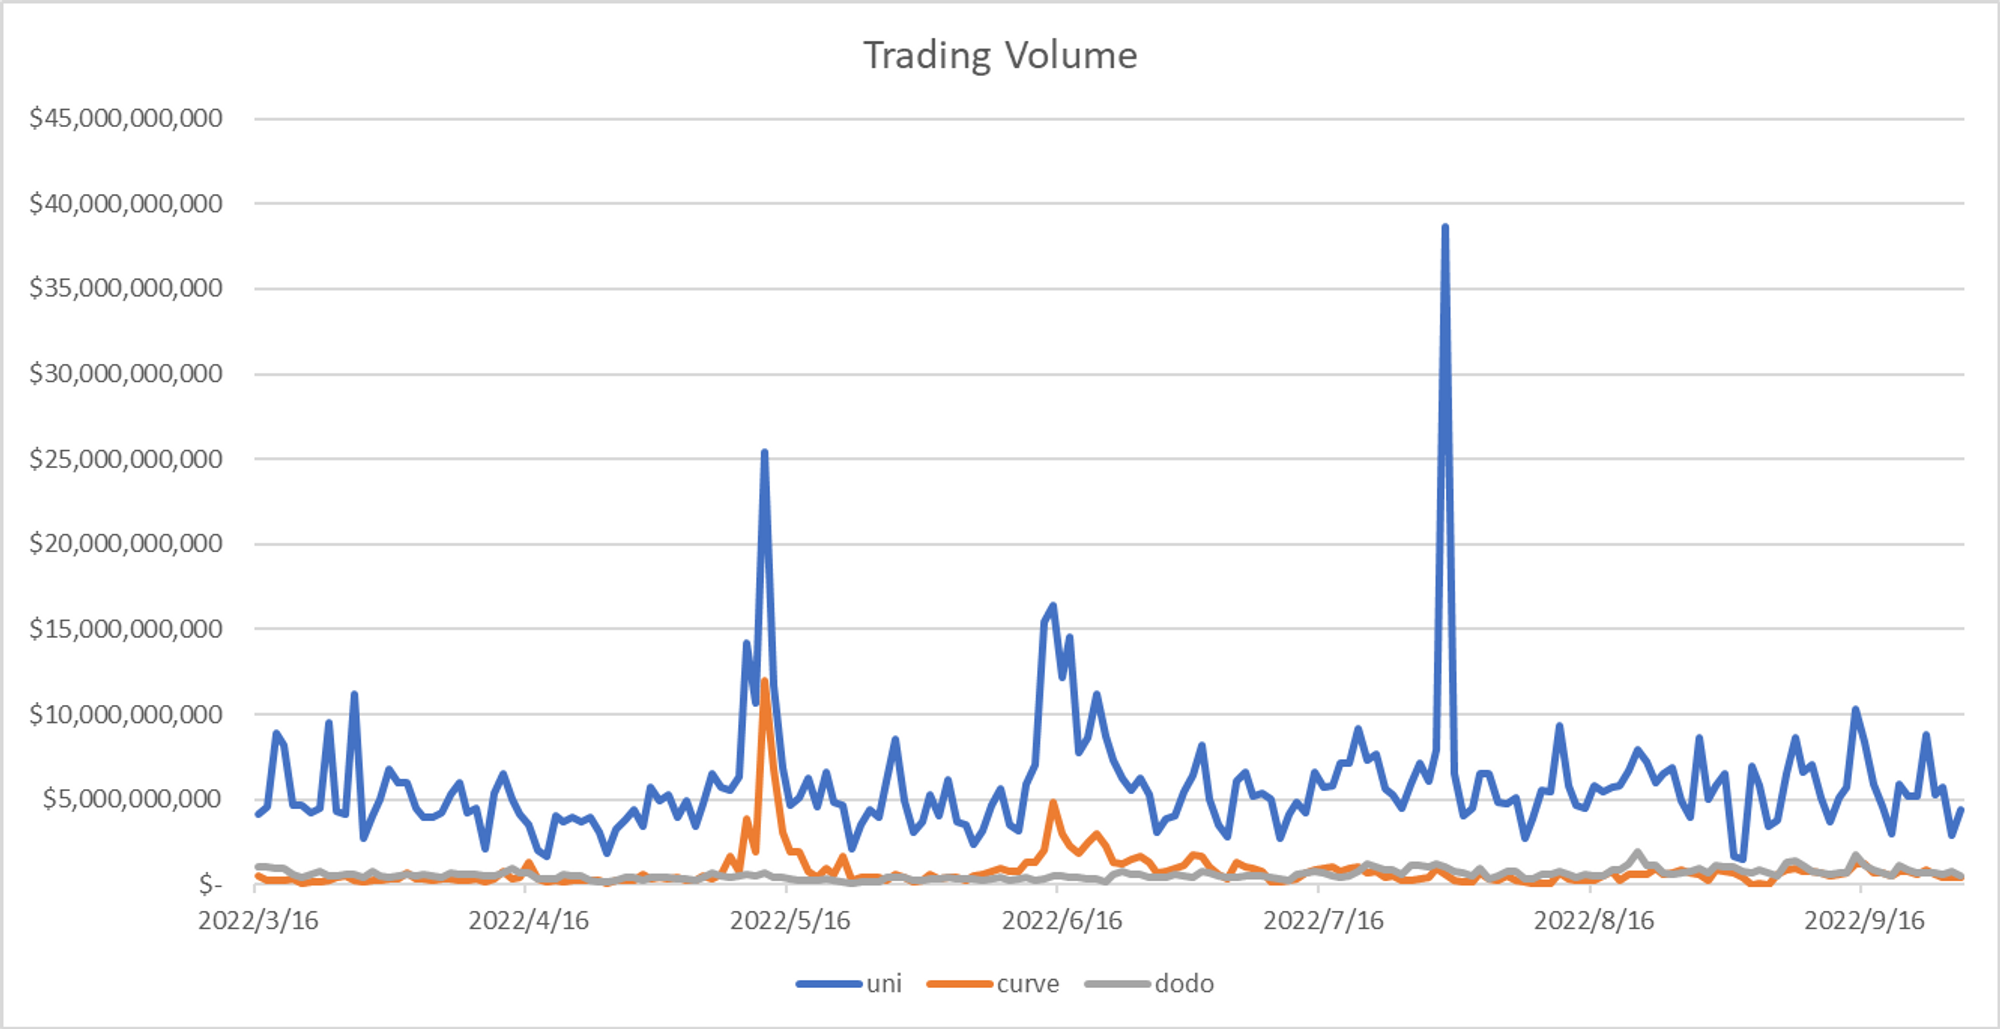
In terms of transaction volume, the absolute scale of Uni V3's transaction volume exceeds that of Curve and DODO. The growth rate of DODO is relatively high. After mid-July, the transaction volume continued to lead Curve. The jump in Curve's trading volume in May and June was all due to the volatility of the stablecoin market.
TVL
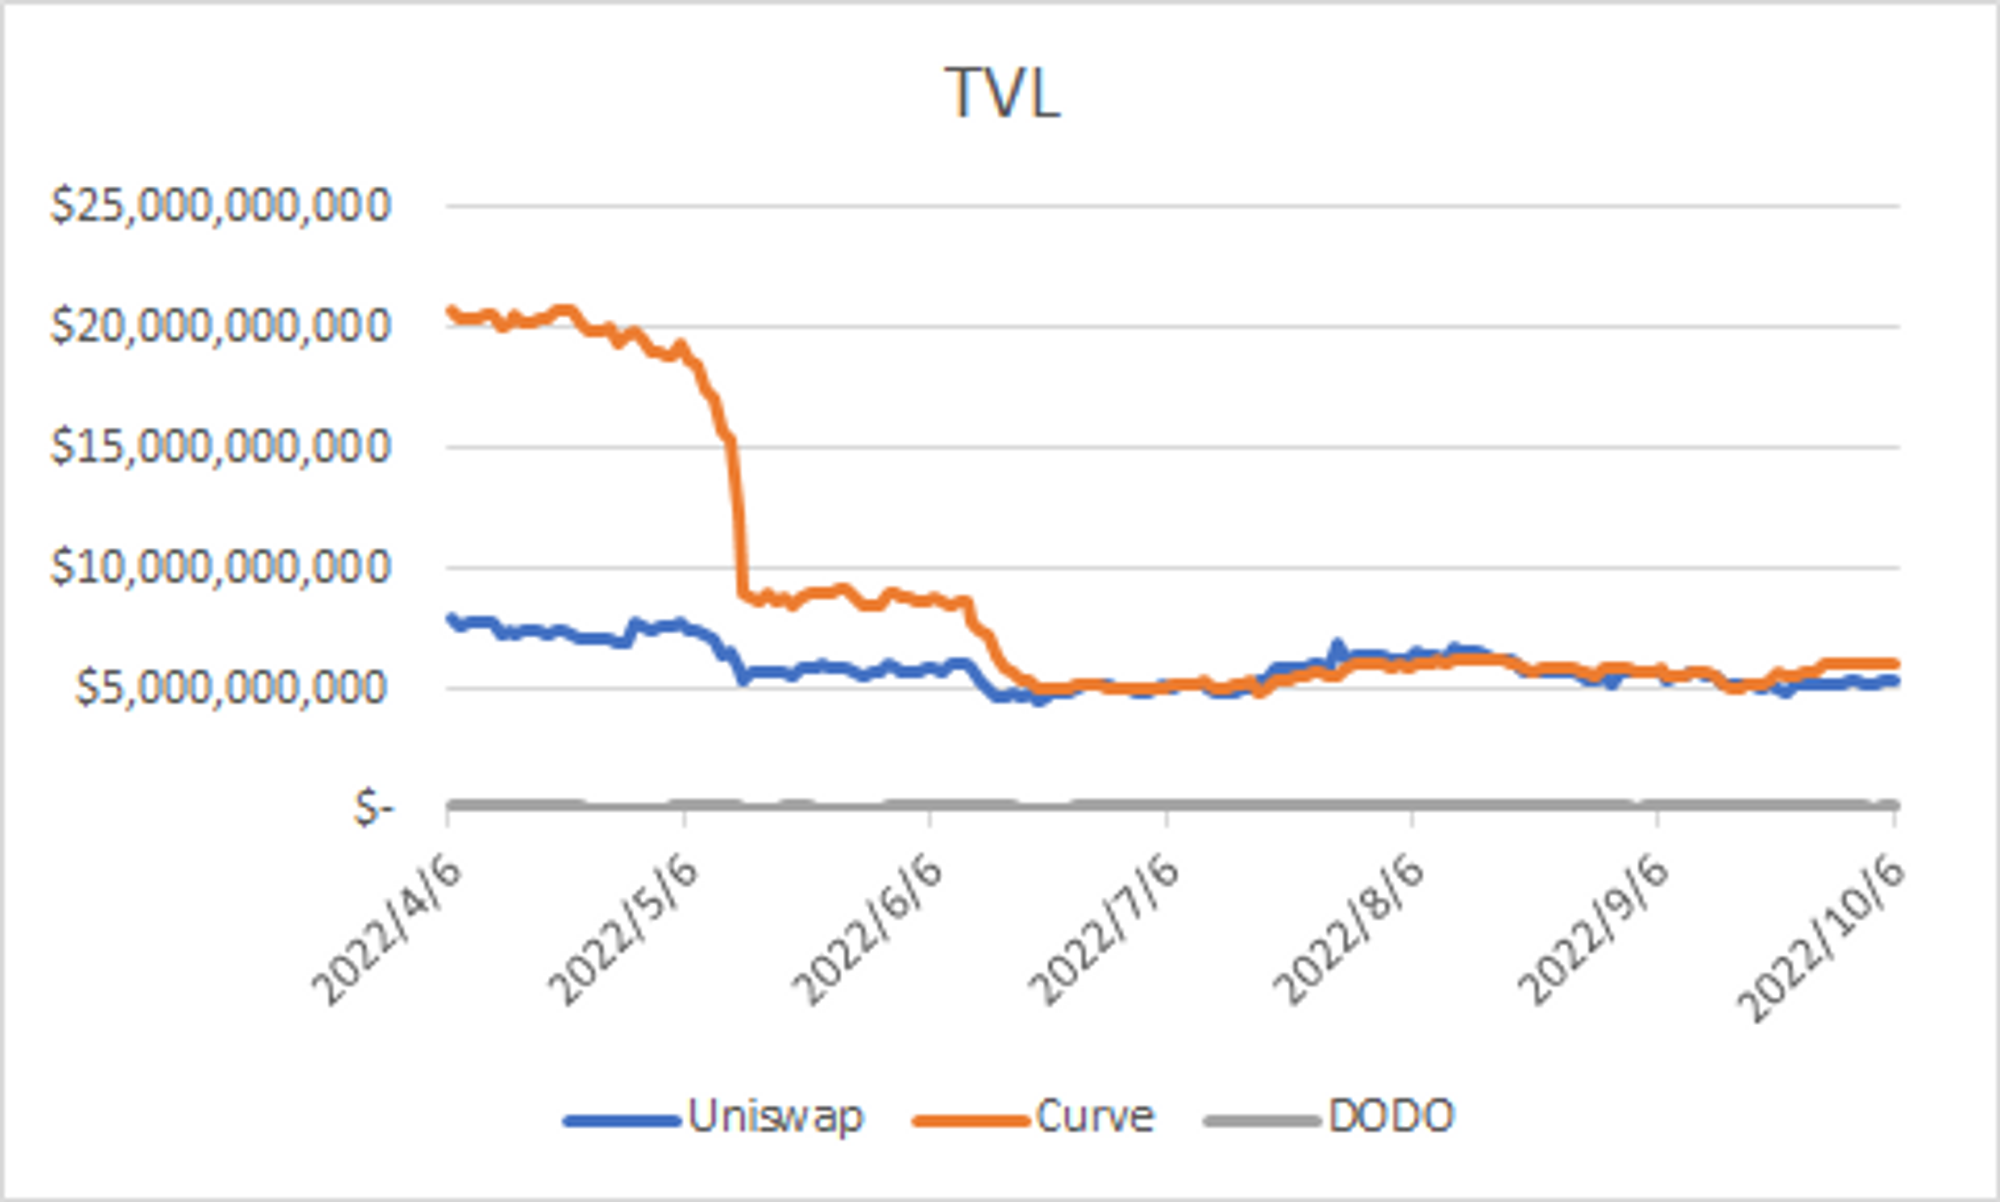
Curve has high TVL. After the fluctuation of the stablecoins market, Curve dropped rapidly, less than half of the peak value. Uni's TVL volume is large, less volatile, and is stable under poor market conditions. DODO's TVL is low, and stablecoins account for a high proportion.
Capital Efficiency
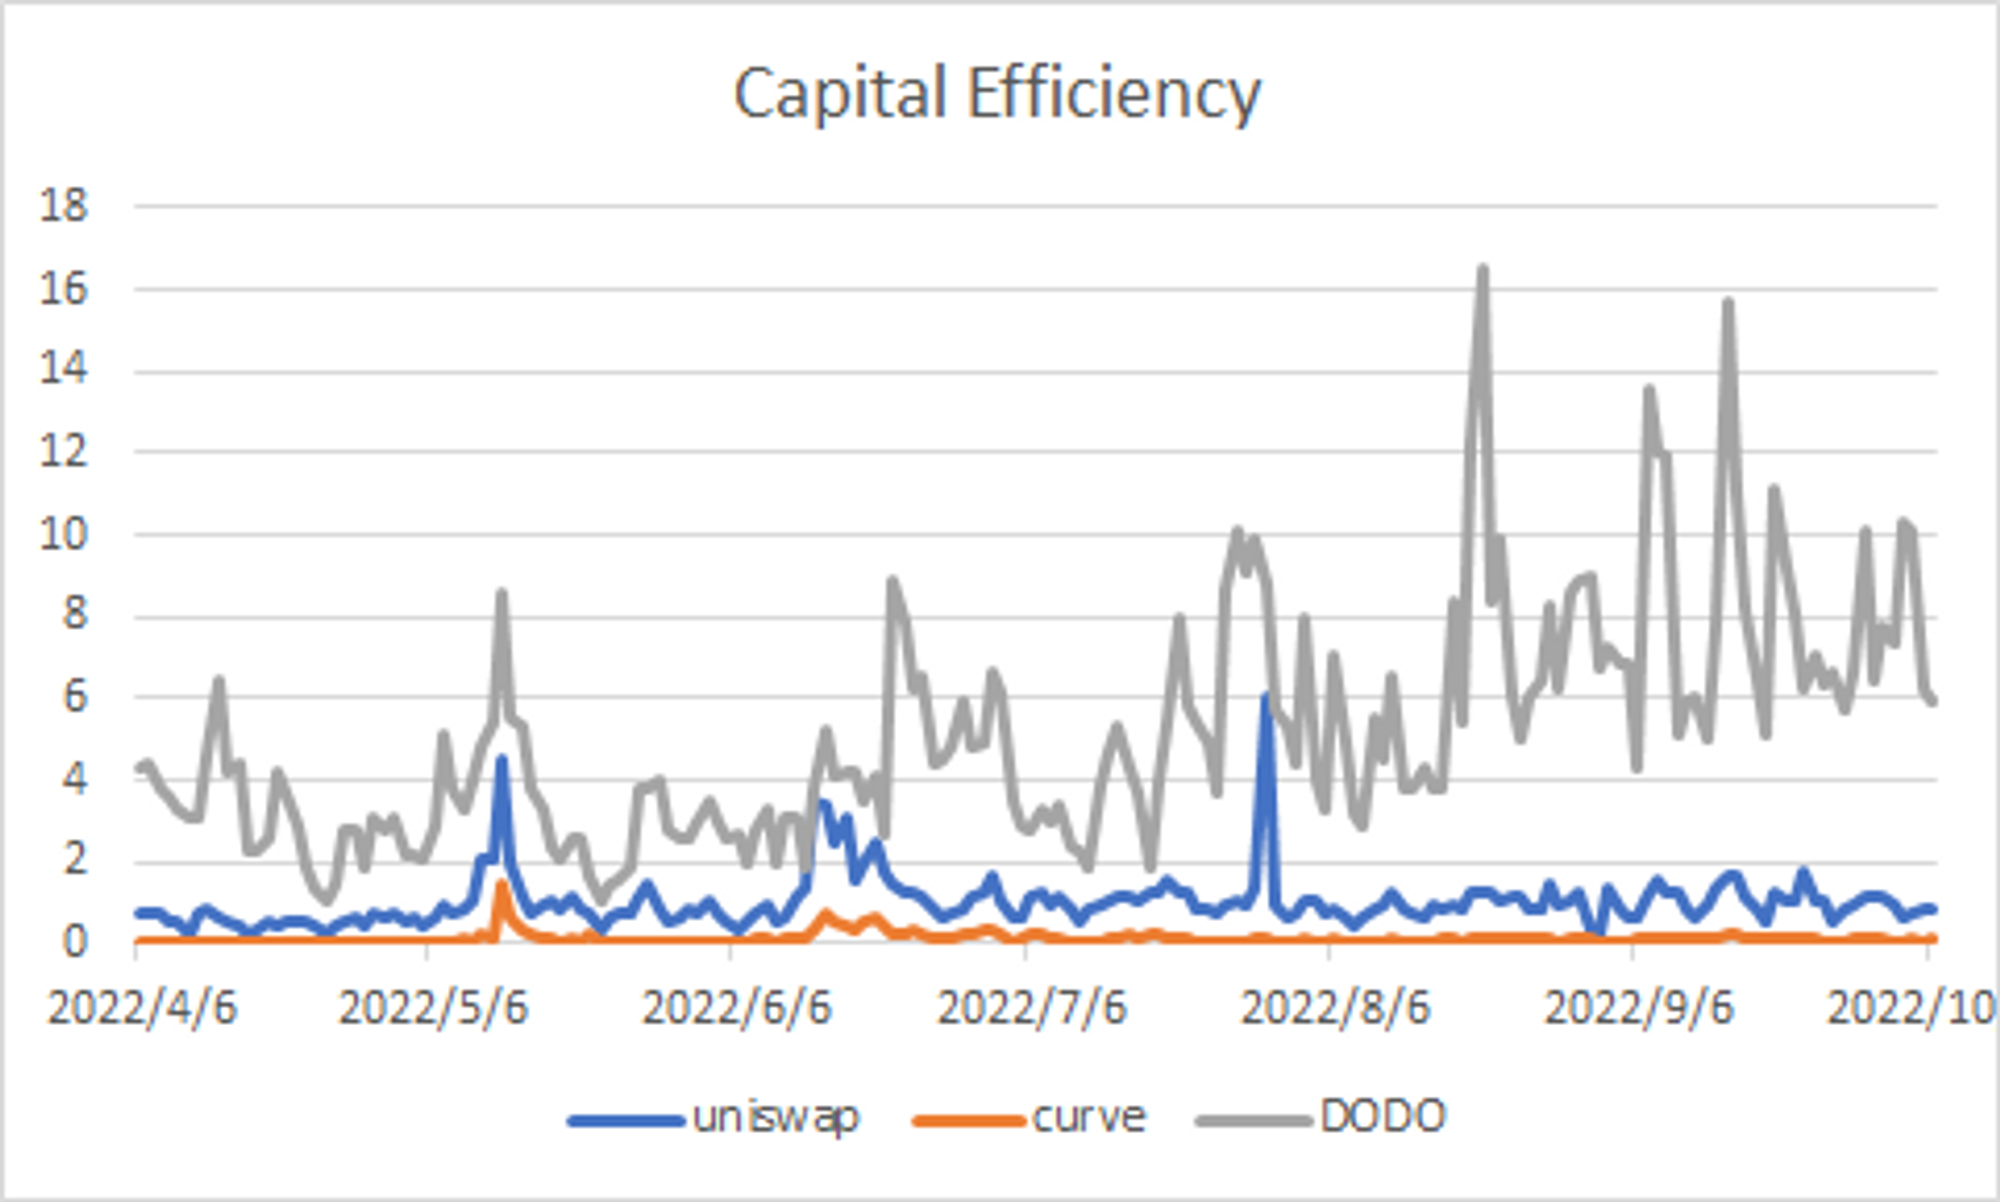
As the figure shows, DODO has the highest overall capital efficiency, followed by Uniswap, and Curve is the lowest. DODO has a leading position in capital efficiency because of the stablecoin trading pairs and professional market makers. The trading volume of stablecoin trading pairs accounts for a high proportion of DODO, and the PMM algorithm sets the k value for stablecoin trading pairs to 0.01. Thus the liquidity concentration of stablecoin trading pairs near the market price is high, resulting in better capital efficiency. The Uniswap Lab team also mentioned the advantages of DODO in stablecoin trading in Dunecon.
Reference
Dr.DODO is Hiring: