
During the past week, the market has been trying to figure out the optimal way to react to the geopolitical landscape. This has caused a huge downfall in stock prices and cryptocurrencies, and the NFT market has been hit by this situation as well.
This article analyzes the surprising performance of Blue Chip NFTs, as well as summarizing the market trends.
General Trends
The market cap graph below from NFTGo helps visualize the pumps and dumps that happened during the last week. The market quickly got back up and recovered from the downfall. The recovery occurred as a result of new projects continuing to enter the ecosystem.
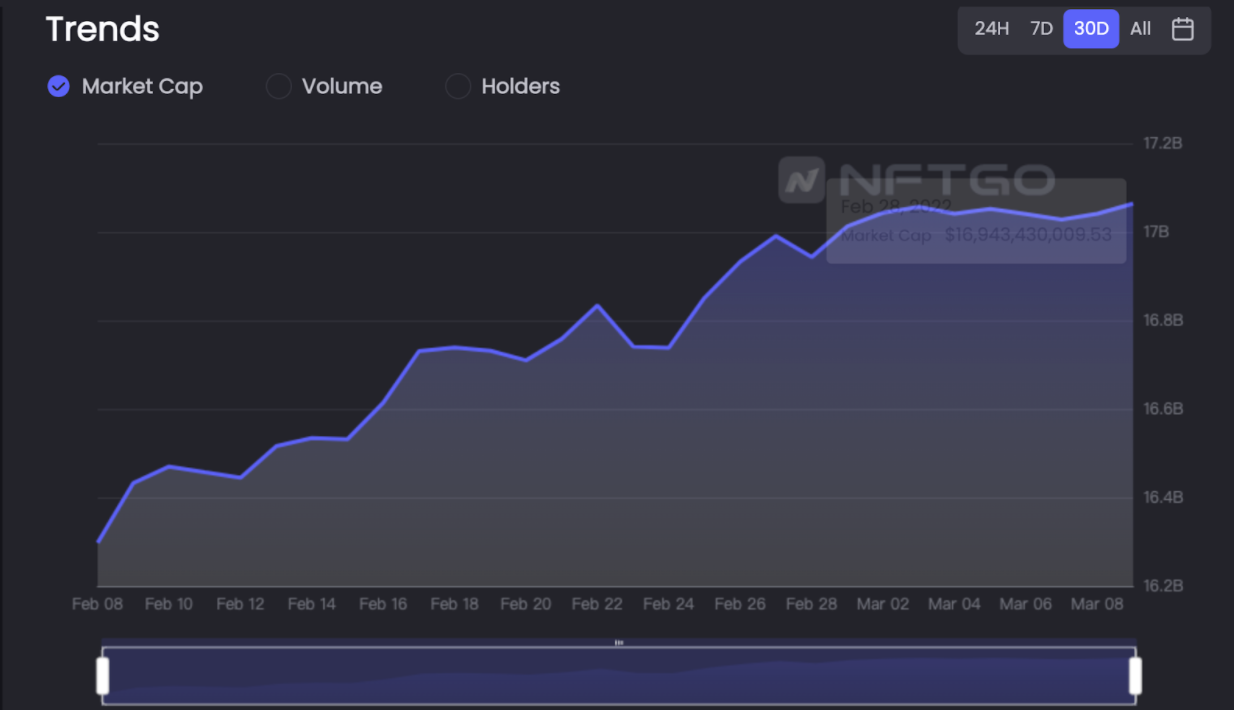
In the past week, the NFT market witnessed historical all-time highs. While the NFT market has a vast potential to grow into one of the world’s leading markets, the NFT market cap continues to be impacted by the intrinsic connection to the cryptocurrency space. The recent developments regarding the Russian invasion of Ukraine have left the world economy, and therefore the various financial markets, volatile and uncertain.
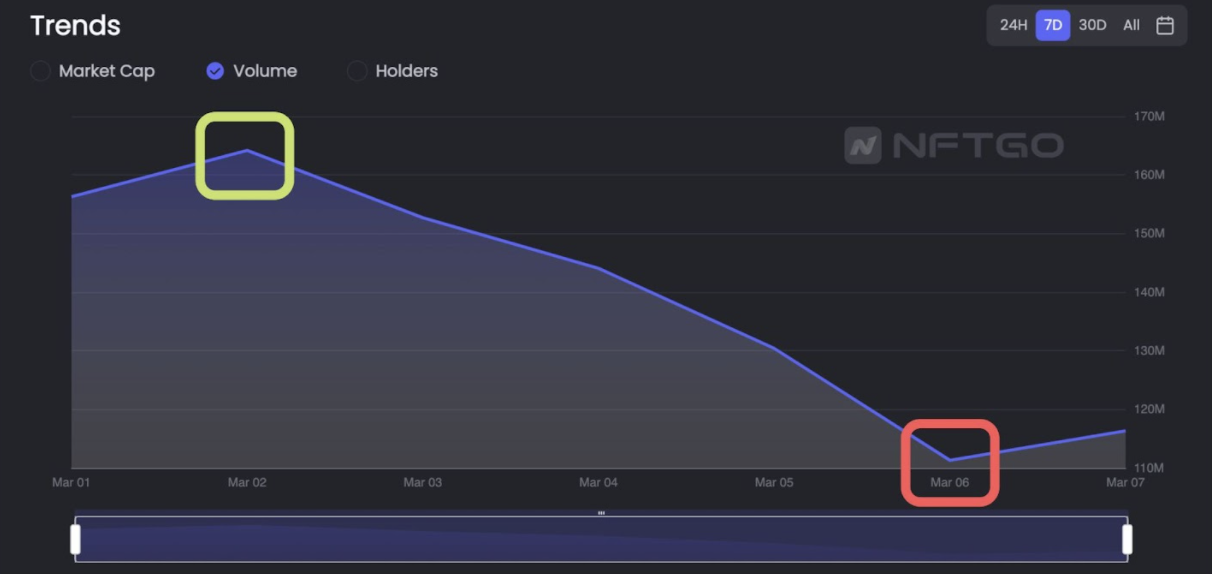
However, the NFT trading volume has fallen drastically from the ATH. The all-time high for NFTs happened at the beginning of February 2022, before ending the month with a 150% loss, resulting in a crash.
Due to the uncertainty and volatility present in the current market, some blue-chip projects are probably undervalued.
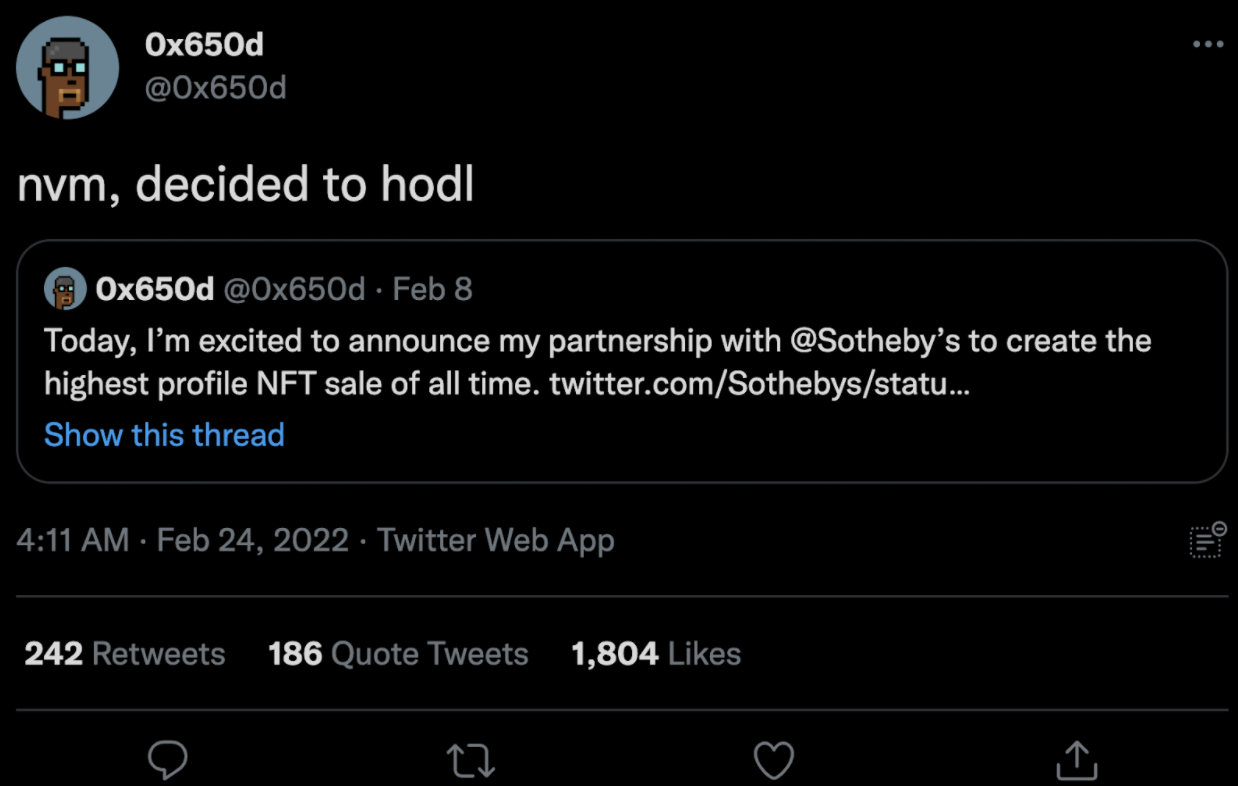
Most recently, a $30 million CryptoPunks auction at Sotheby’s got canceled. The holder Tweeted out:
So when the low trading volume has happened, is there an undervaluation of NFTs? What's the driving factor of NFT market cap growth?
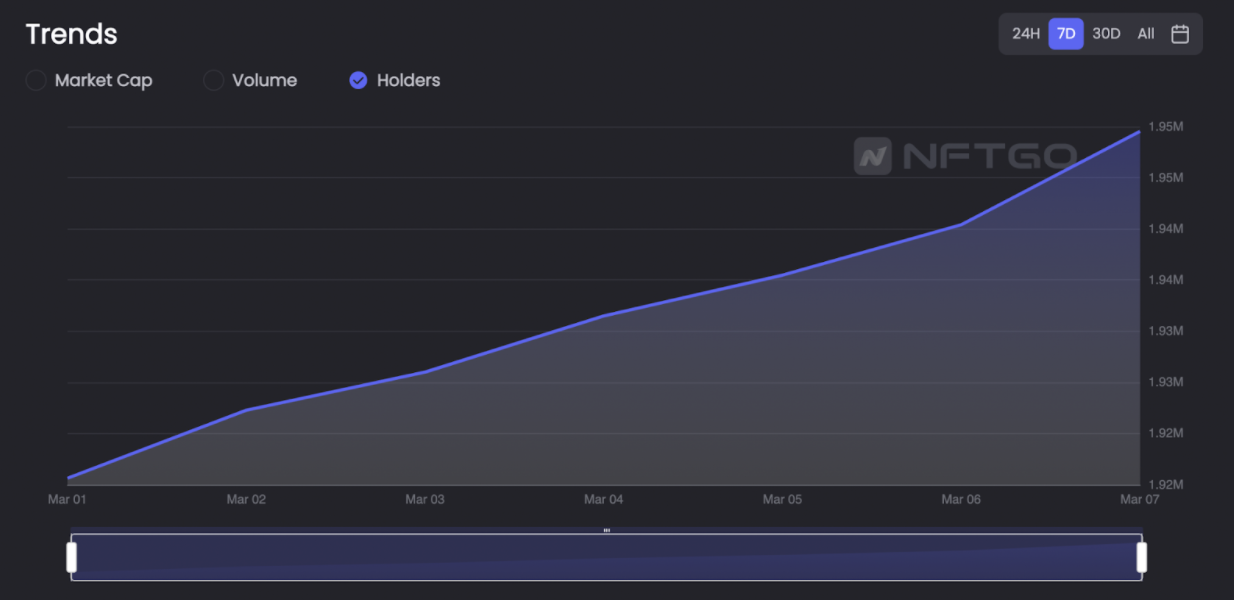
NFTGo’s holder trends through time show the answer to the continued growth of NFTs. Although many NFT holders are holding on to their assets, new projects are still blooming. The positive rate of NFT adoption is the main driving factor for the market cap.
Blue Chips performance analysis
Blue Chip projects are sitting right at the top of the charts. NFTGo rankings give us insights into the most valuable NFT projects by market cap.
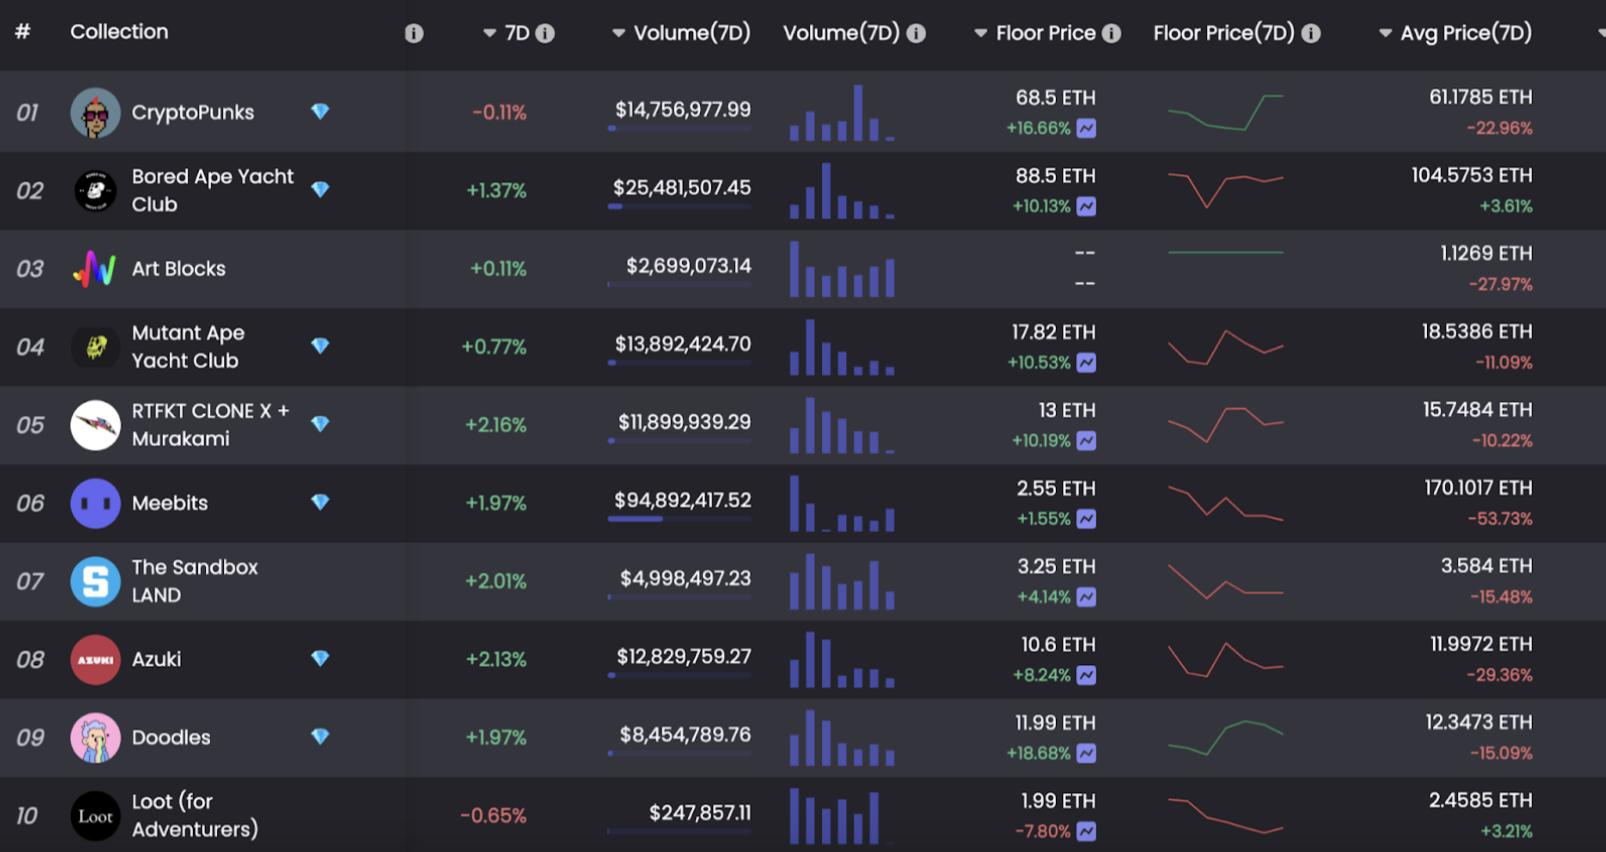
The devaluation of Blue-Chips NFT
The most valuable project by market cap is CryptoPunks, which accounts for 11% of the total NFT market cap. The floor price for CryptoPunks has had a 3.79% increase over the last week. The average price of a Punk has fallen 16.89% over the last week.
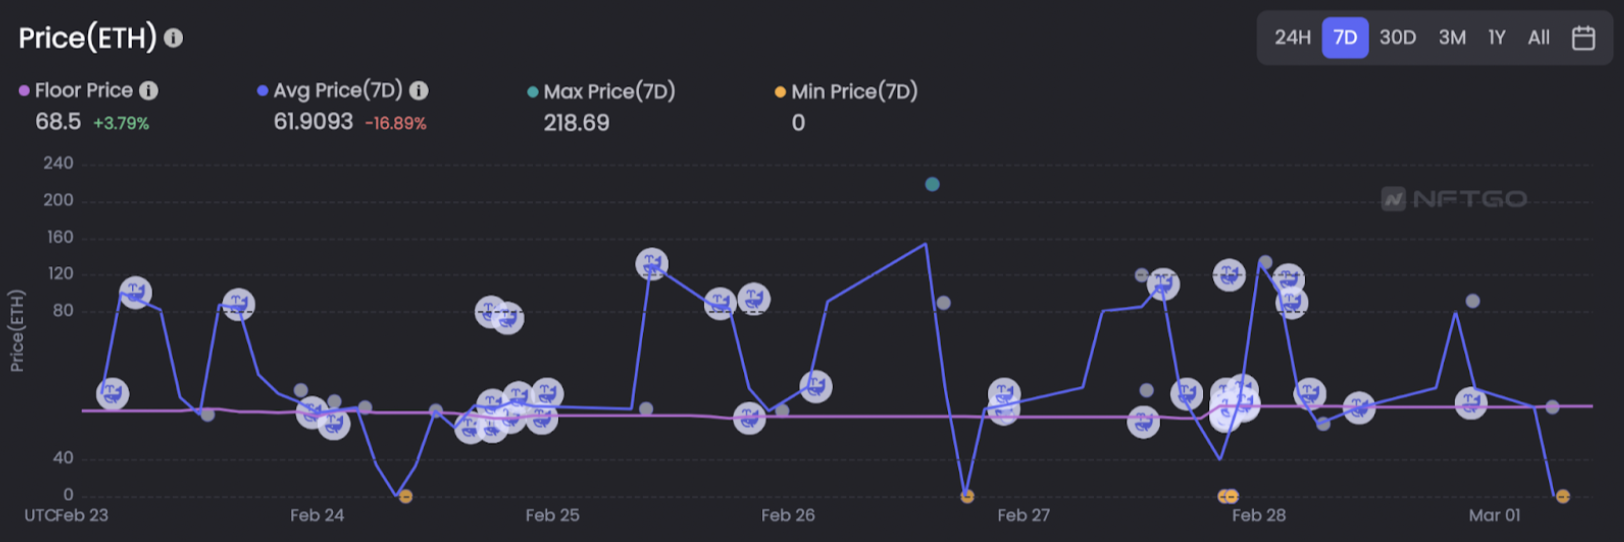
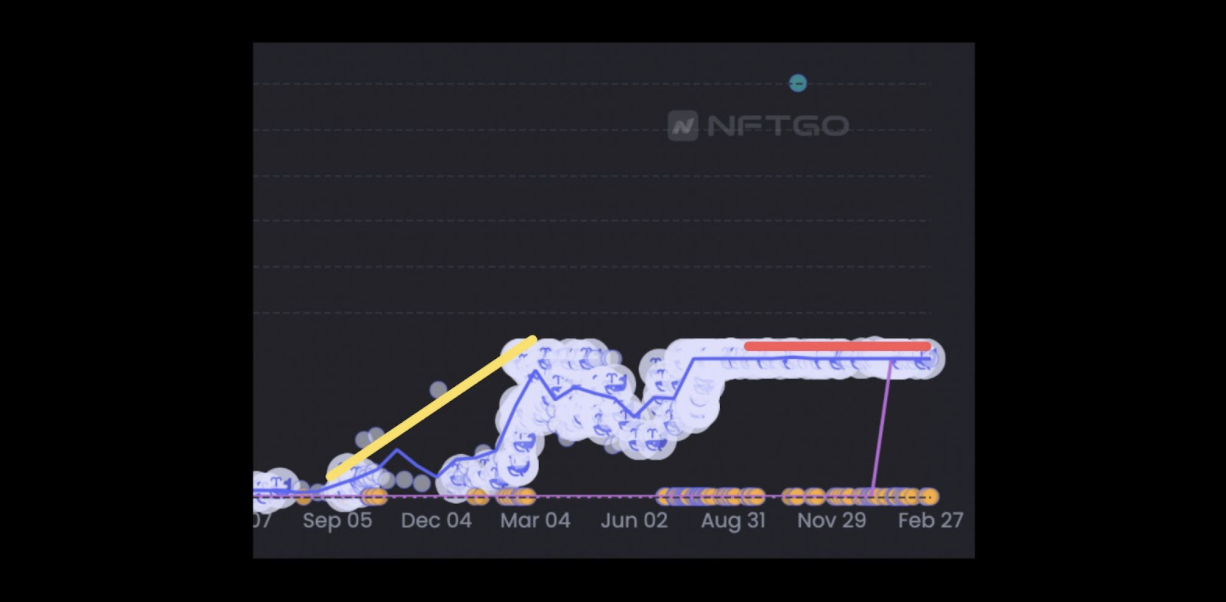
Compared with the project’s hottest days, the CryptoPunks price curve has been relatively flat recently. From the price graph of CryptoPunks, we can see that the average price has had the fastest growth rate from September to March of 2021. During that time, the average price of a CryptoPunk went from 1 ETH to 20 ETH. Afterward, the price jumped to 40 ETH, and it has not moved much ever since.
- Rarity Matters
Azuki
Another blue-chip collection that has received a lot of attention is Azuki. Azuki has been a massive success and it has to be noted that it is one of the youngest independent top blue-chip projects.
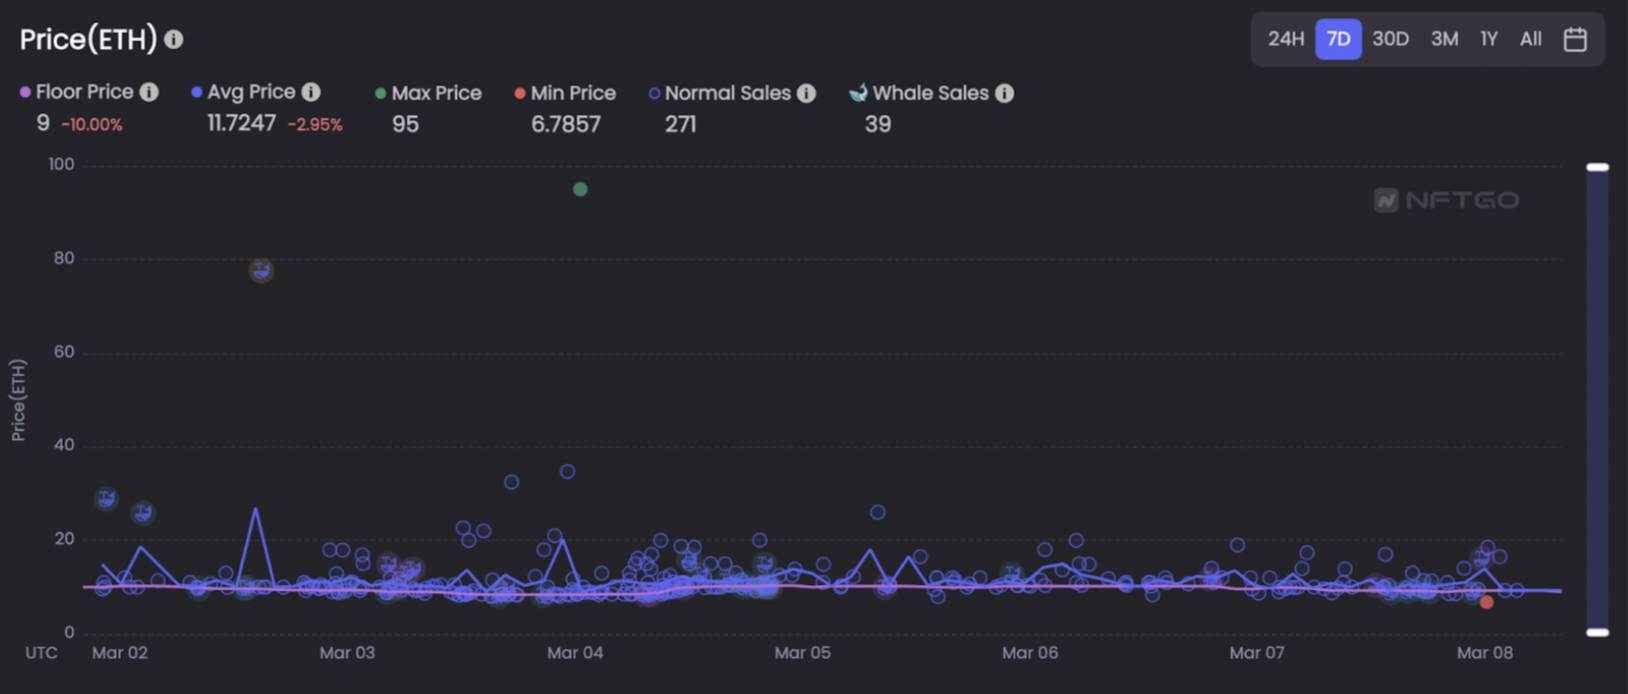
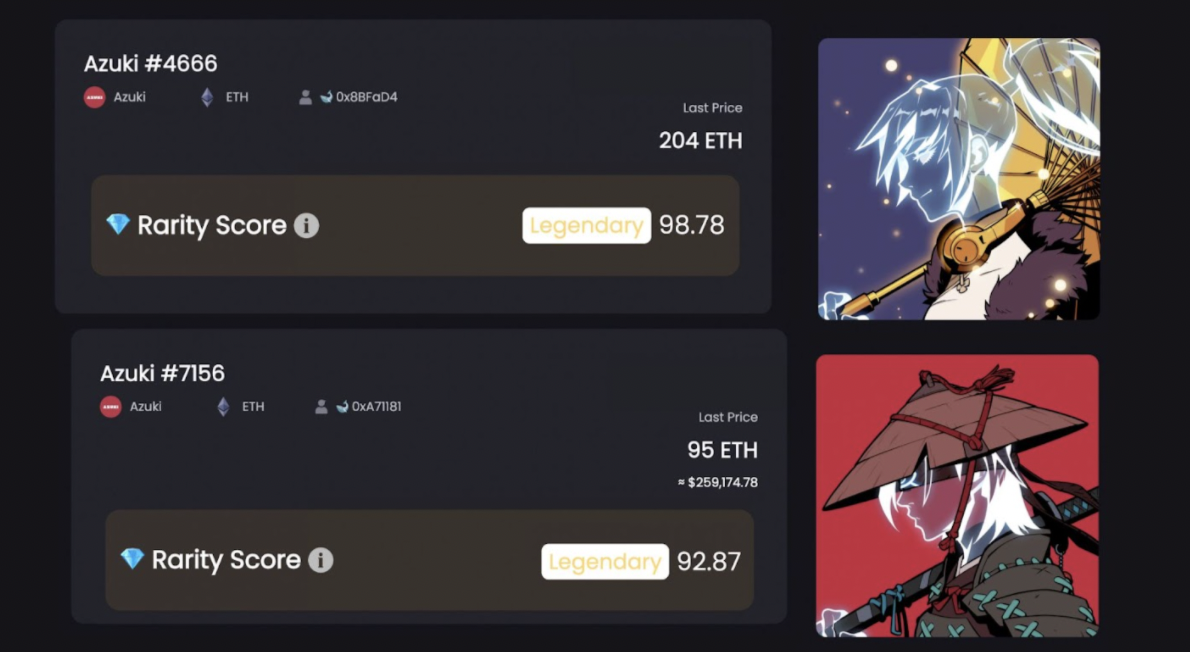
Over the past week, the largest sell price for Azuki has been 95 ETH.
The average price has had ups and downs but it’s staying within the 10-15 ETH range. One of the biggest sales of the past week is still ⅕ of one of the biggest sales of the month. However, when considering the rarity metric for the two NFTs involved, the reason for the large price gap is evident.
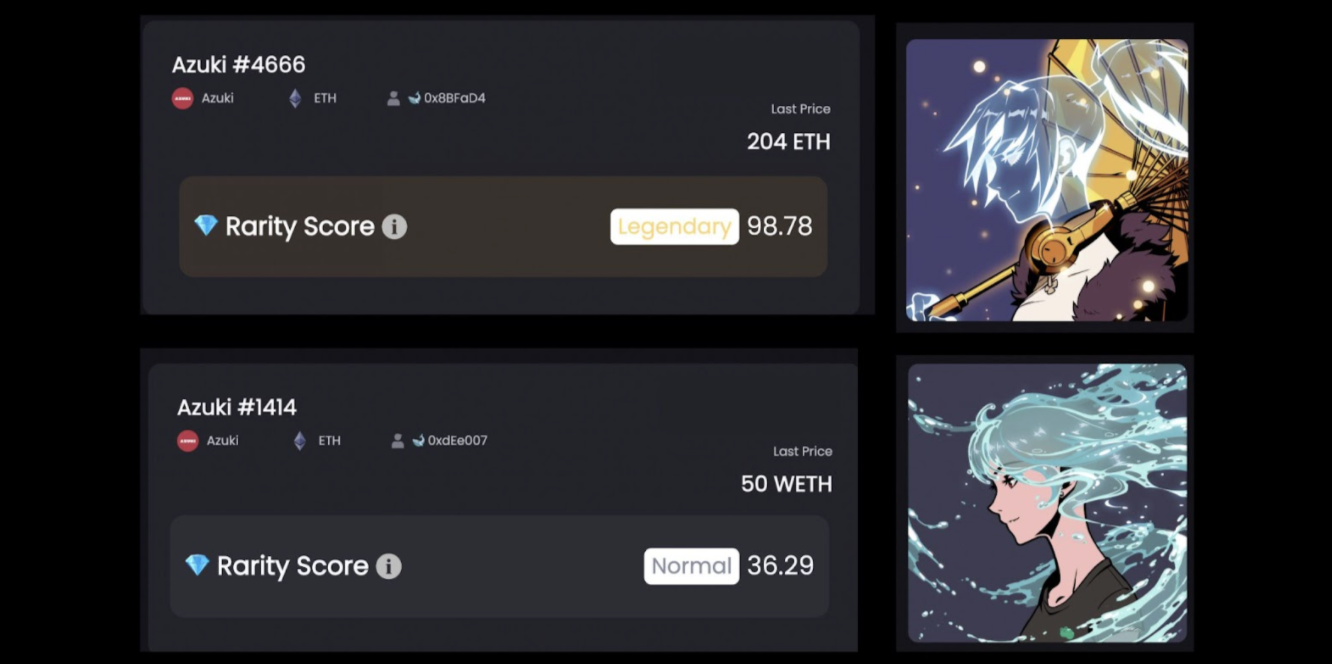
There are always two sides to a medal and while a drop is evident, recently a 95 ETH sale has been made for an Azuki NFT with a legendary rarity rank. This piece of evidence would suggest that Rarity has the power to outweigh market downturns and even enhance the relative valuation of an NFT.
Both the average and floor price of Azuki NFTs have fallen dramatically since the ATH sale of 204 ETH, nevertheless, holding a 1/1 collection would be more beneficial during the uncertain time.
- Whales still have faith
RTFKT
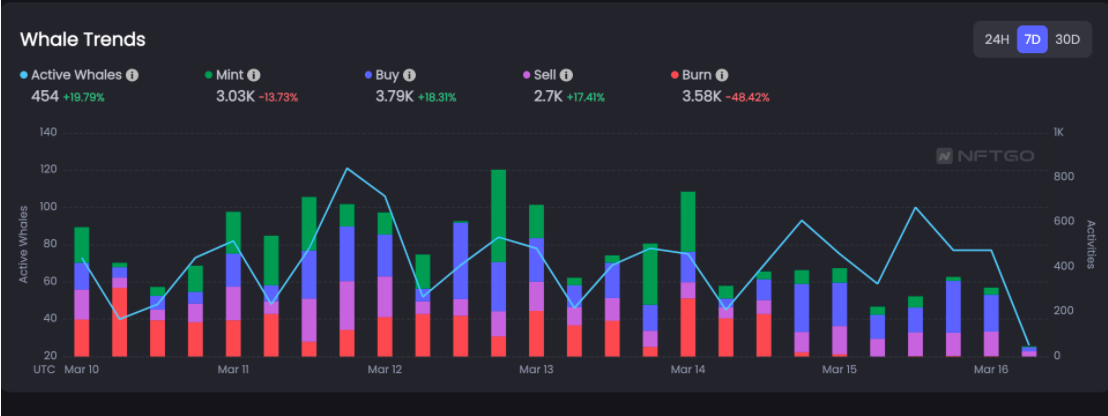
RTFKT is one of the most unique projects in the Top 10 list of the most valuable NFT collections. The project is on a mission to transform the fashion industry and the metaverse. RTFKT has been a very profitable project for a lot of Whale holders. These profits range from $1 million up to $12 million. We’re analyzing the unrealized profit metrics, meaning given the current situation of the project, these profits could be made if the addresses sell all of their RTFKT NFTs.
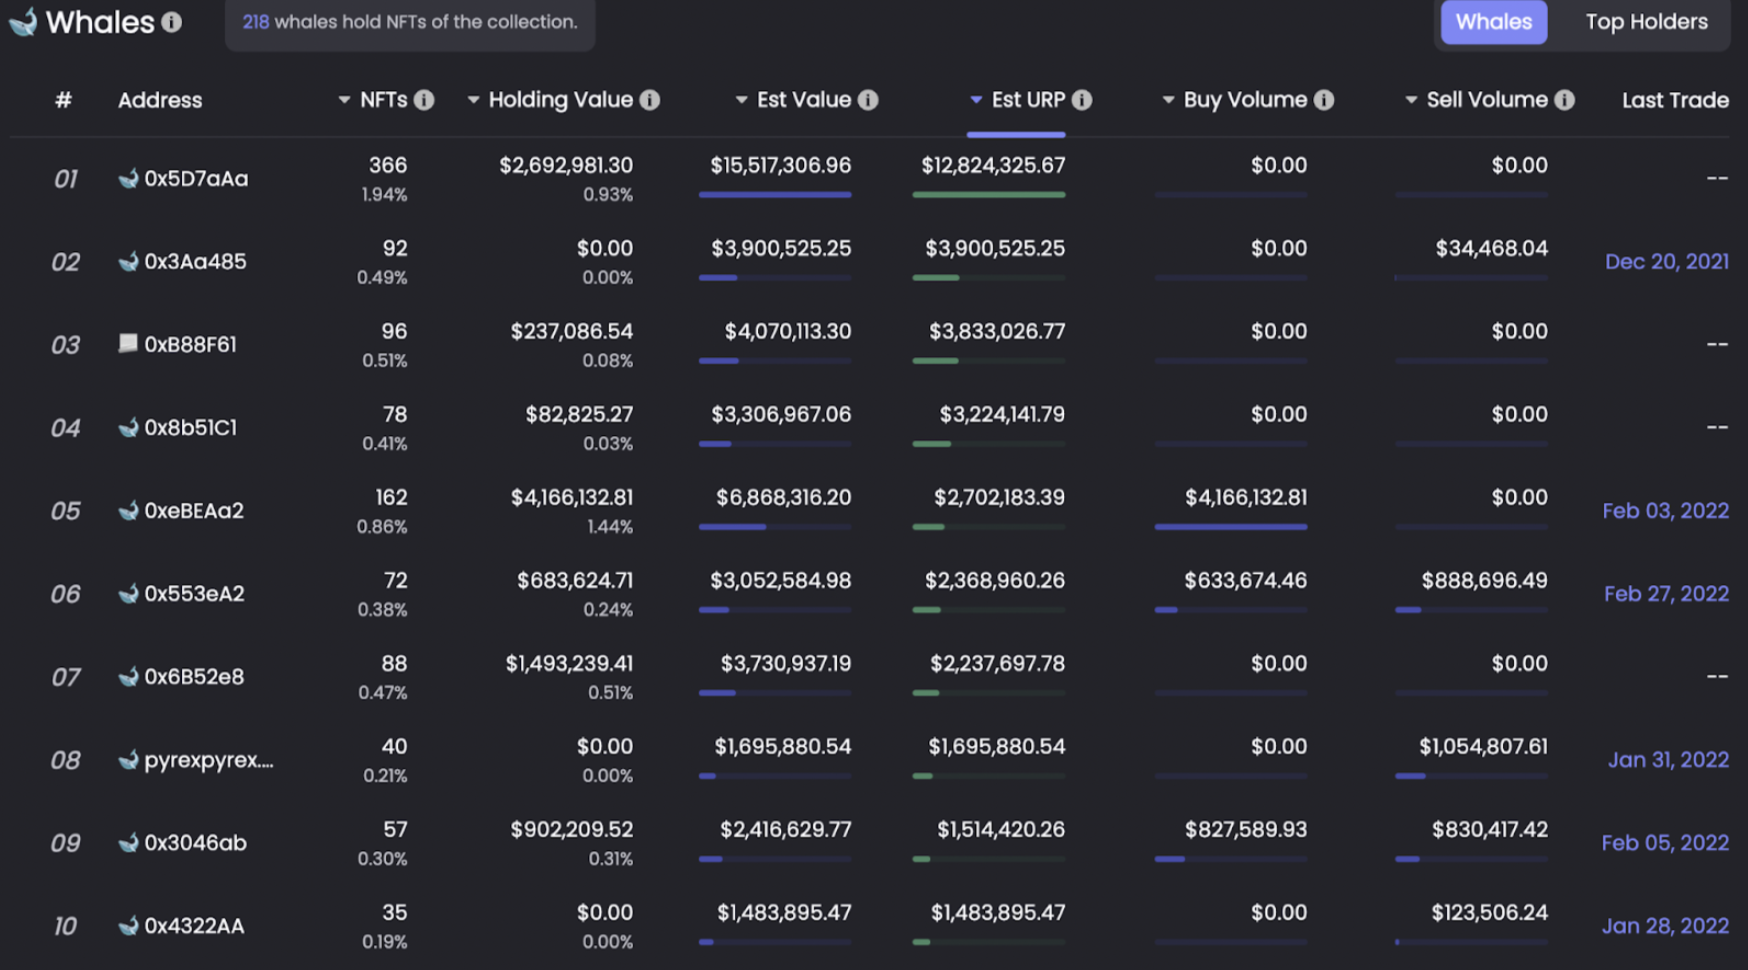
However, some Whales are holding on to their NFTs. And the minting activities has been slowing down, while buy and sell activities are going up.
Moving on to the 11-20th places in the rankings, we have other NFT blue chips such as Cool Cats NFT and Decentraland.
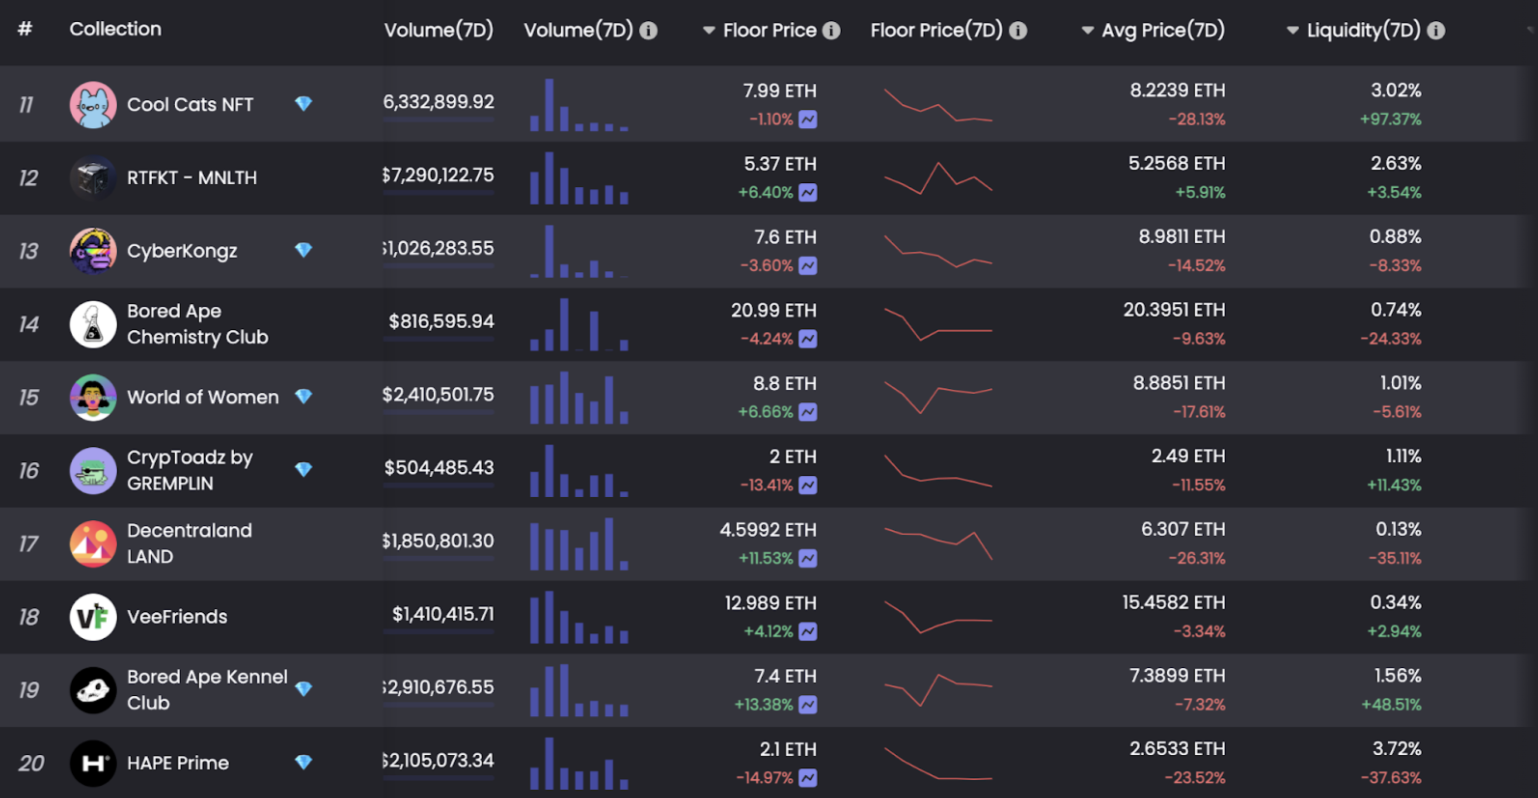
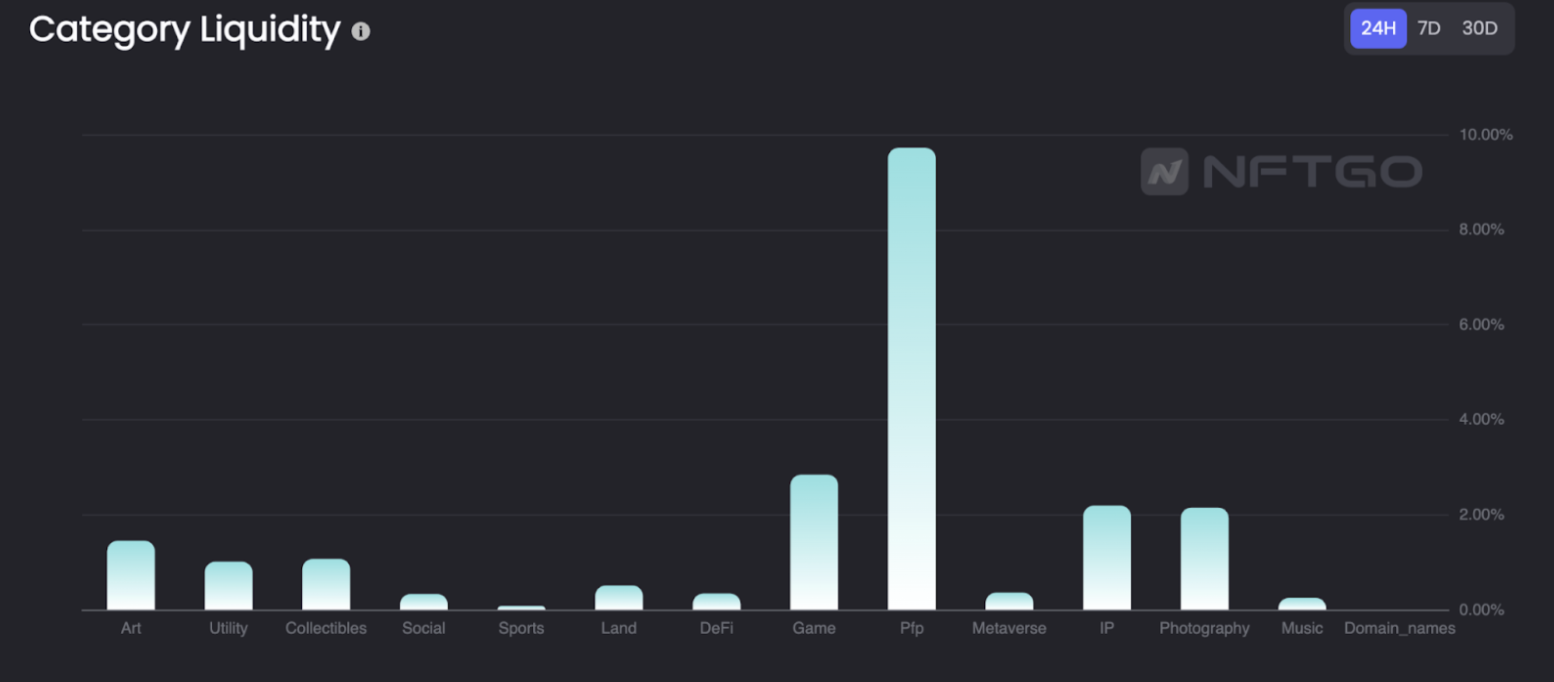
- PFP is still the most liquid NFT asset
Avatar NFTs are one of the most liquid NFT categories. Most of the traders consider buying into PFP projects as they’re the most popular NFT category. In the Category Liquidity chart from NFTGo, we can see that PFP projects are by far the most liquid NFT category. PFP projects are about 4 times more liquid than game NFTs.
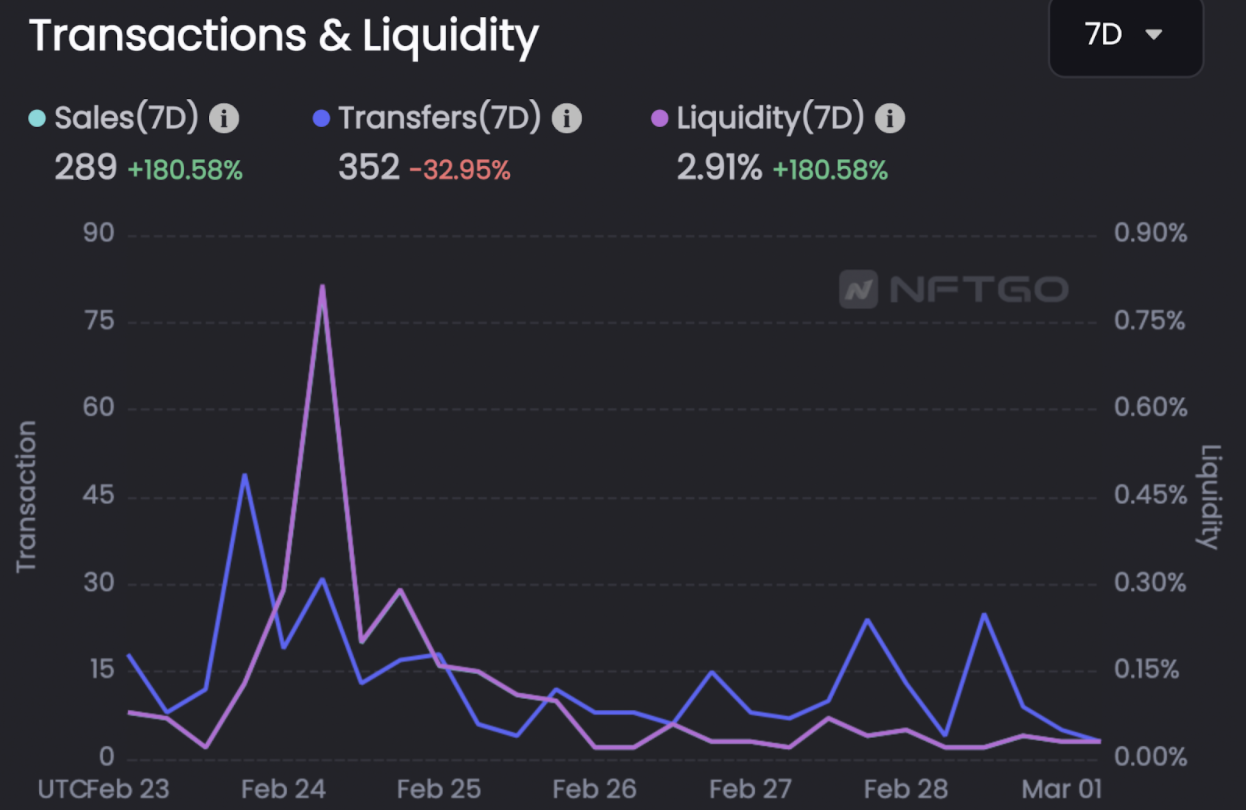
Take Cool Cats as an example. During the last week, the surge in sales for Cool Cats NFT drove up the liquidity of the project by 180%. The surge in liquidity shows the willingness of people to buy NFTs during the dip. This is in contrast to a bearish market where there's an imbalance between the number of sellers and buyers.
- The Metaverse hype is slowing down
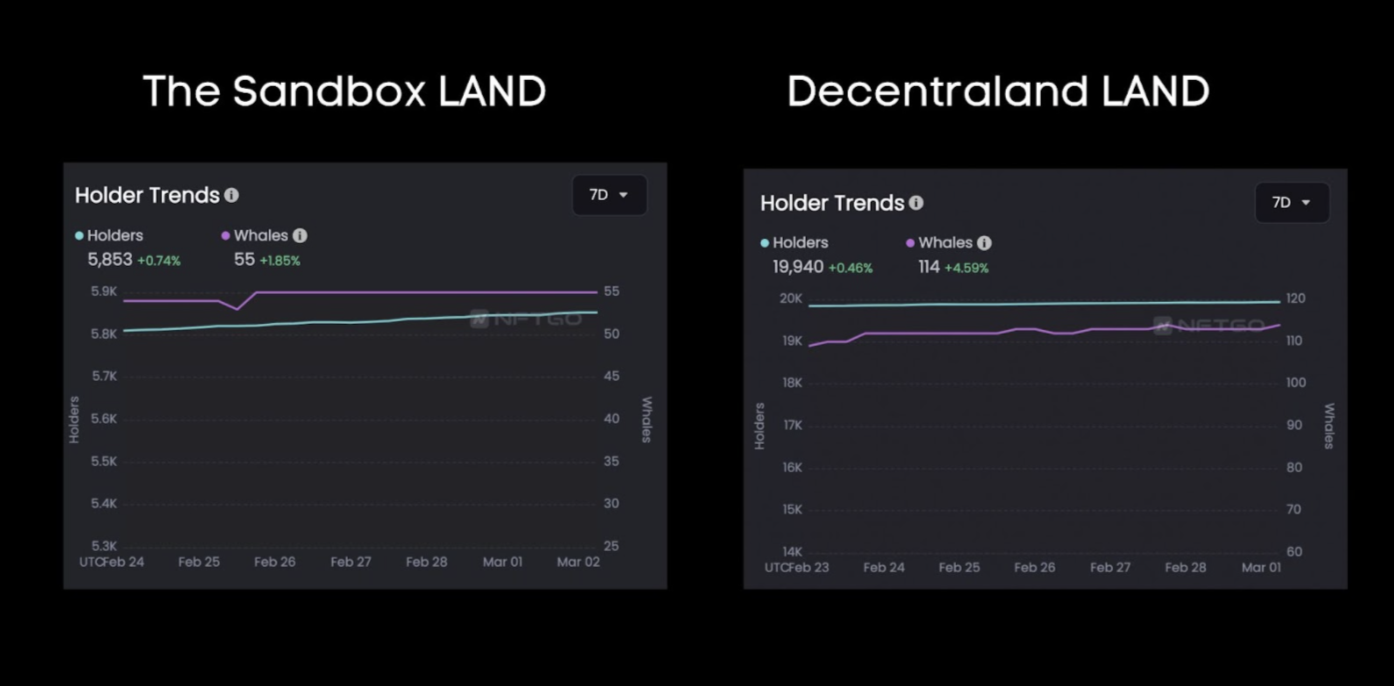
Decentraland LAND
Metaverse LAND has less popularity among market participants, and both the Sandbox and Decentraland has dropped by around 41% trading volume in the past 30 days. In the Metaverse world, participants trade LAND to build their own spaces on the plots. Compared to The Sandbox LAND project, Decentraland has received more attention from Whales and other holders over the past week.
The project has been moving very fast. Over the last week, LAND in the dencetraland world has gone down by about 30%. However, the lands are still selling for prices such as 29.96 ETH. The large price differences suggest the clear distinction of different LANDs, similarly to the rarity price difference observed before with Azuki.
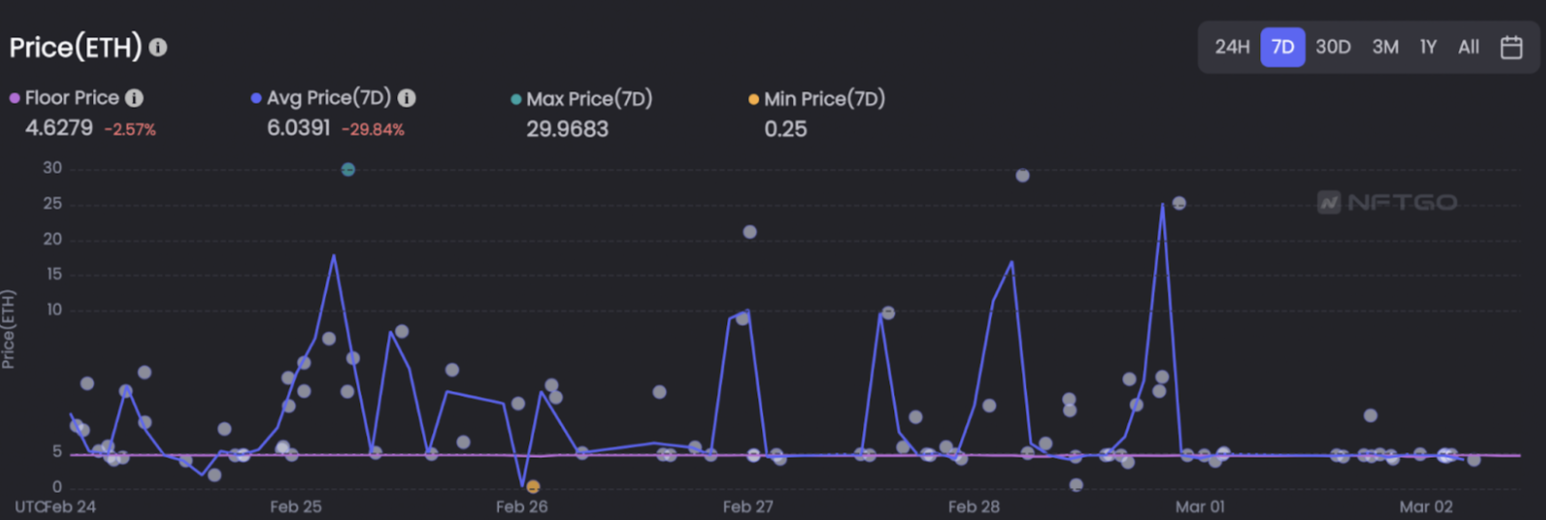
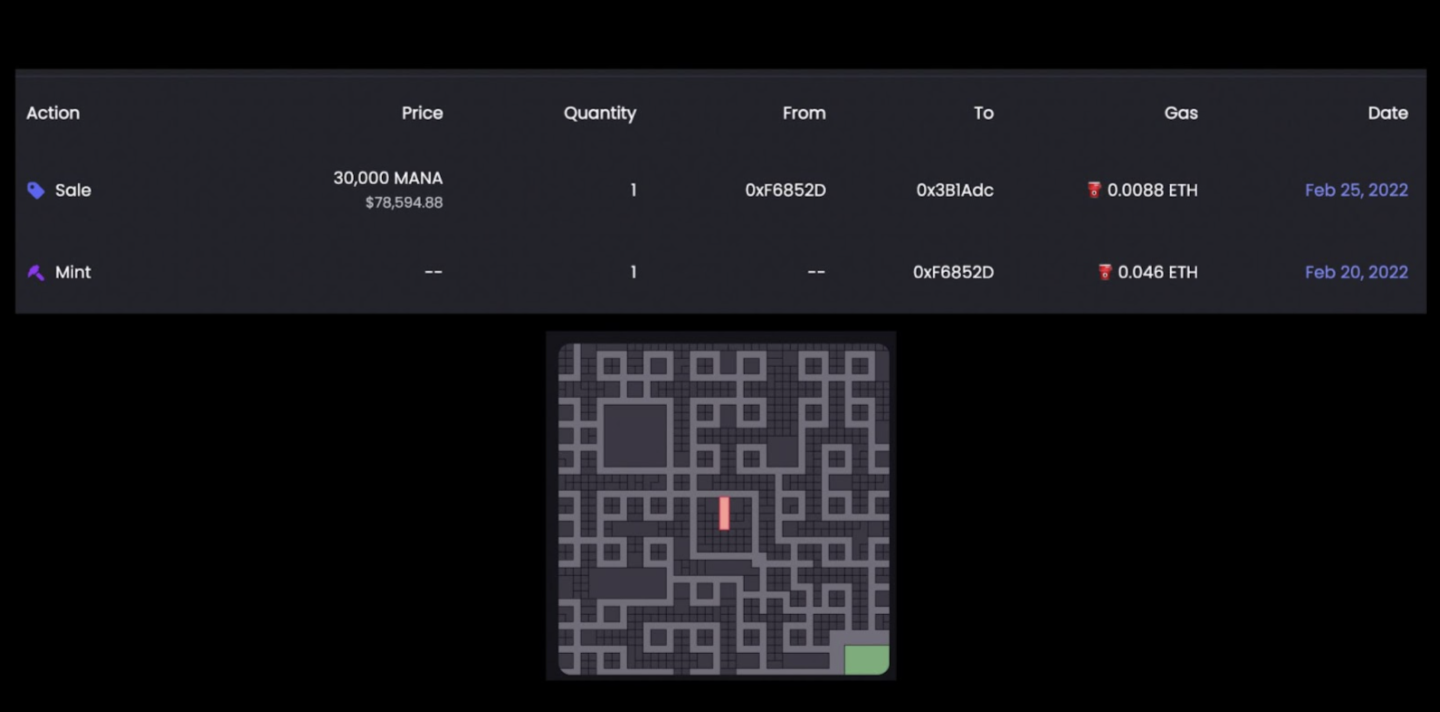
The most expensive item over the last week was sold at over 8 times the floor price. The LAND made a net profit of $78,594.881 for the seller. This huge sale happened after just 5 days from minting the LAND.
Conclusion
During times of market downturn, holders tend to pull out their money from risky assets. However, during the research what’s been clear is that although the recent events have impacted the price and growth rate of blue-chip NFT, the market has shown some stability and a lot of room for growth in the future. Rare blue-chip NFTs are selling for thousands of dollars and PFP projects are getting exposure to more traders.
The best course of action during unprecedented times is to avoid reacting impulsively while trying to mitigate the risk, and then to analyze market data to find potential upsides.