
Understanding the influential parameters driving the NFT market assists investors in mitigating risks and making strategic bets with high profits. The uncertain geopolitical situation in Ukraine is impacting many asset classes and the riskier assets like cryptocurrencies and NFTs are experiencing the largest crash in the past few months.
This article explores:
- How dependent are NFT prices on the cryptocurrency market?
- How can we leverage the data from other markets to make strategic investment decisions?
- What’s the Blue Chip collection’s performance during this crisis?
Crypto currencies Vs. NFTs
Part 1 -Macro Trends
During the crisis, the launch of Russia’s attack on Ukraine tremendously impacted the global economy. Traditional and crypto sectors were all impacted by the whispers of a new war. The chart below displays the past week’s downward trend in cryptocurrencies.
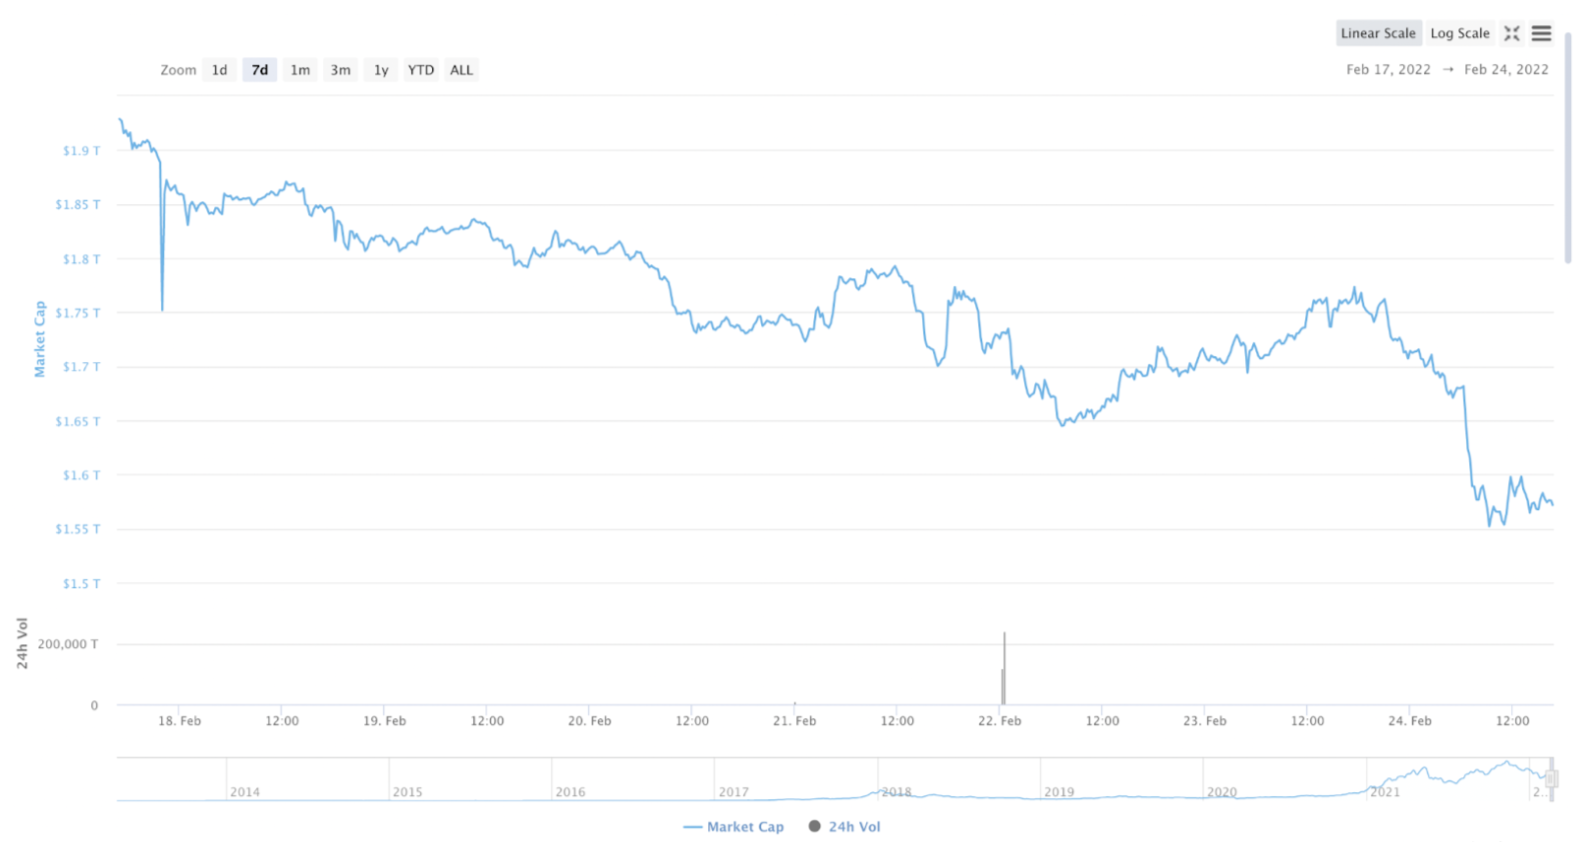
The macro trends of the post-pandemic world continue to raise concerns about the economy.
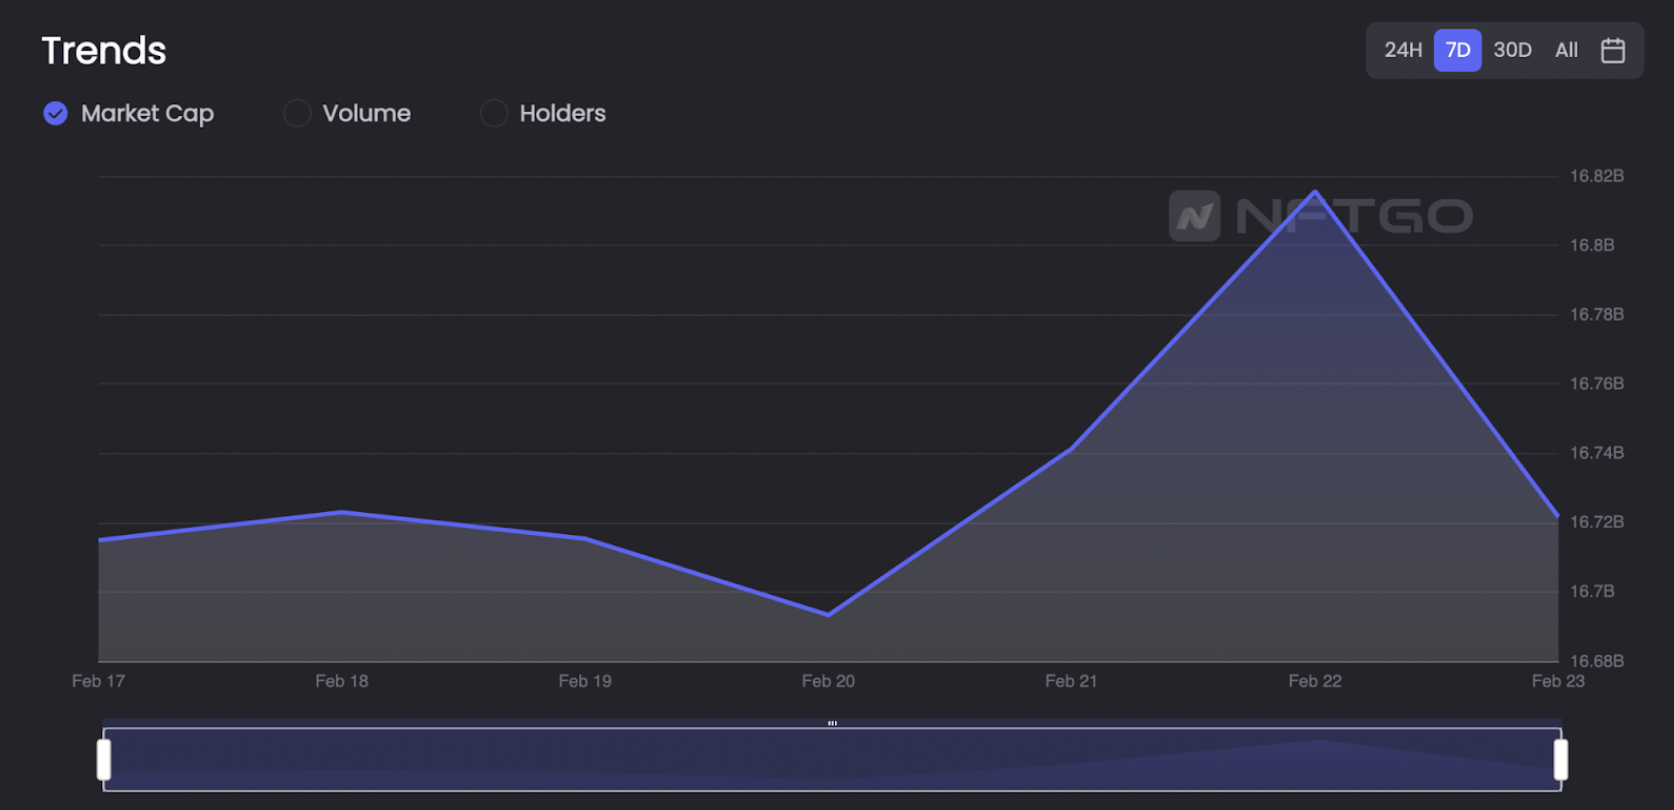
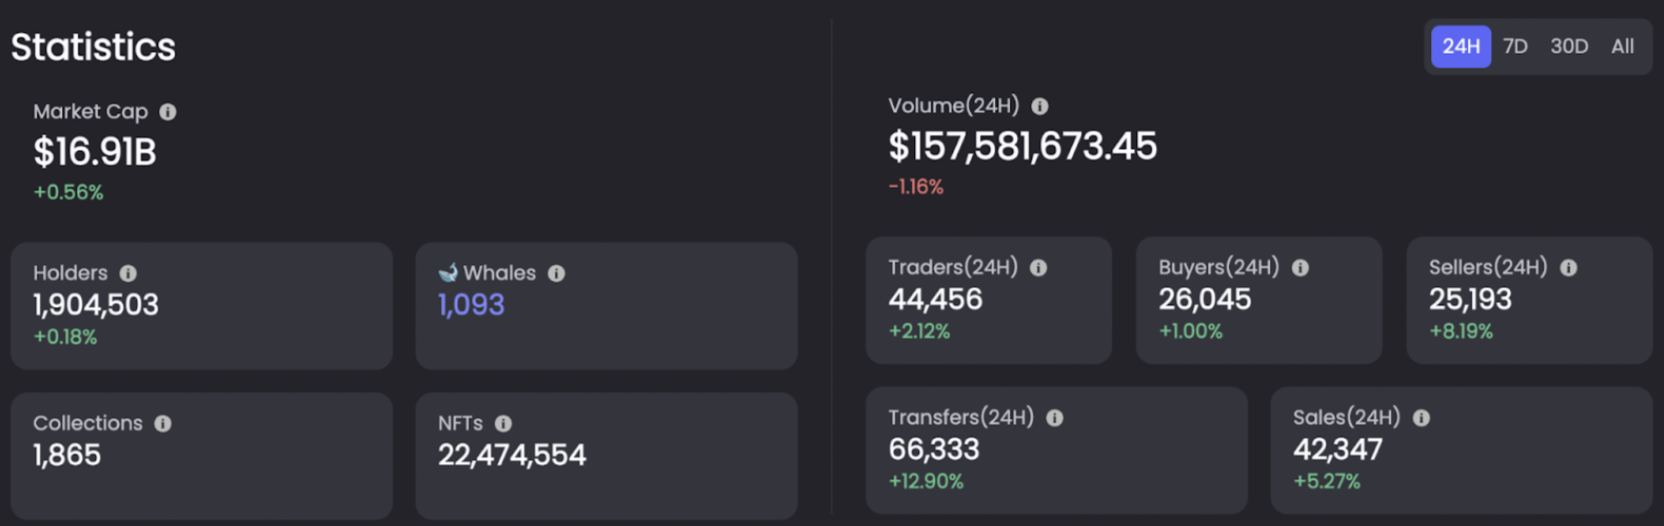
The chart from NFTGo shows that over the last week, the NFT market cap has experienced volatility. It hit a high of $16.8 billion with a low of $16.69 billion and overall up only 0.05% on the entire week.
However, by broadening the time window to 30 days, the trend in the market cap has been upward. The NFT market cap has increased by 33.3% in the last month.
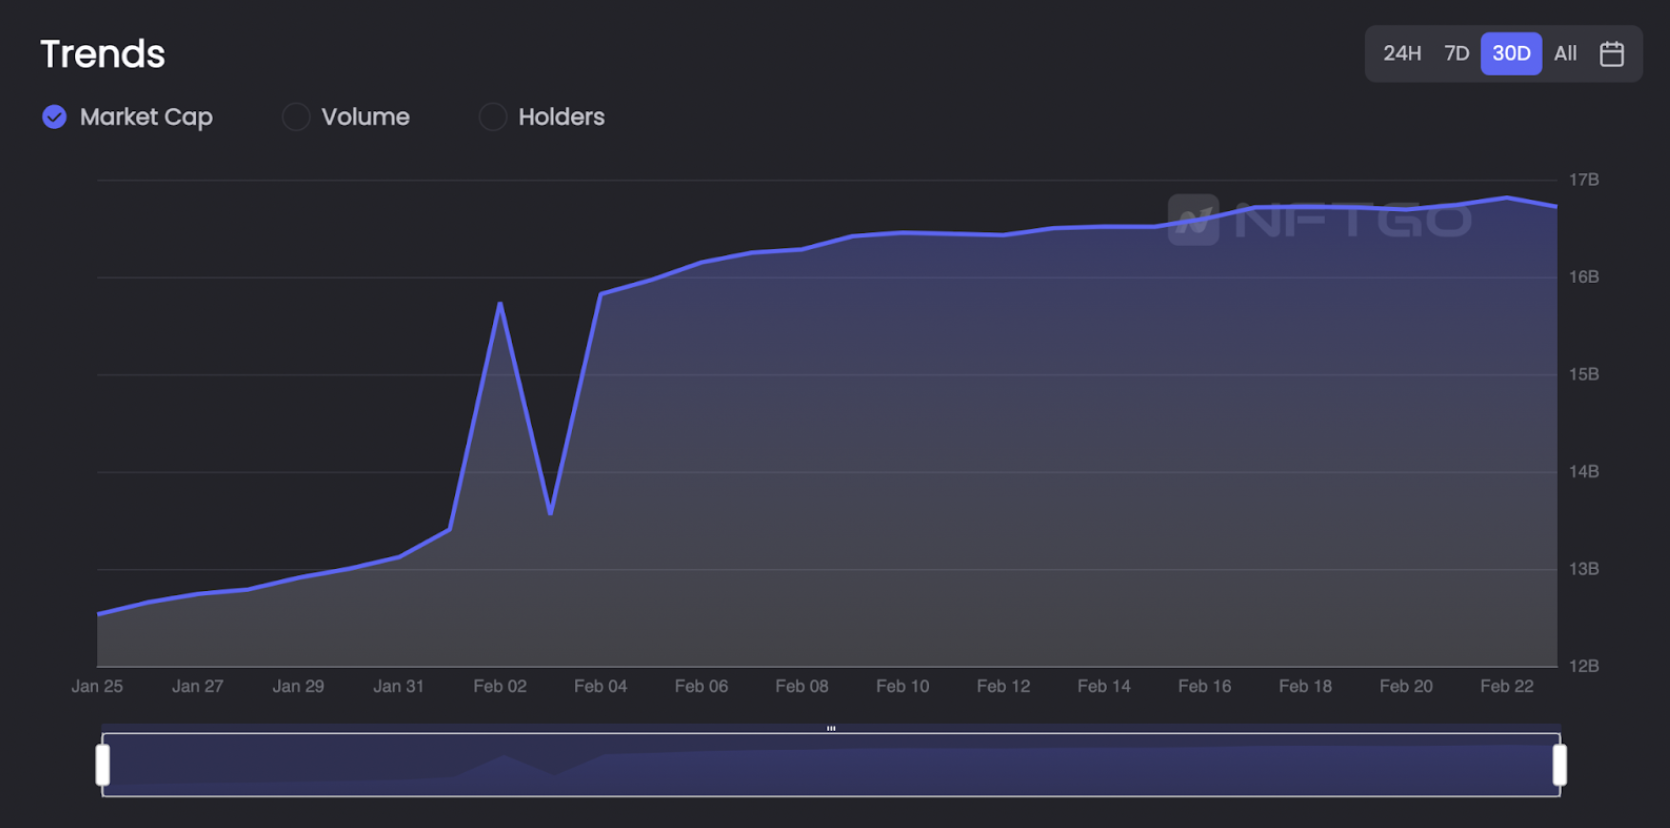
On the other hand, the cryptocurrency market has experienced a mild increase of 4.6%.
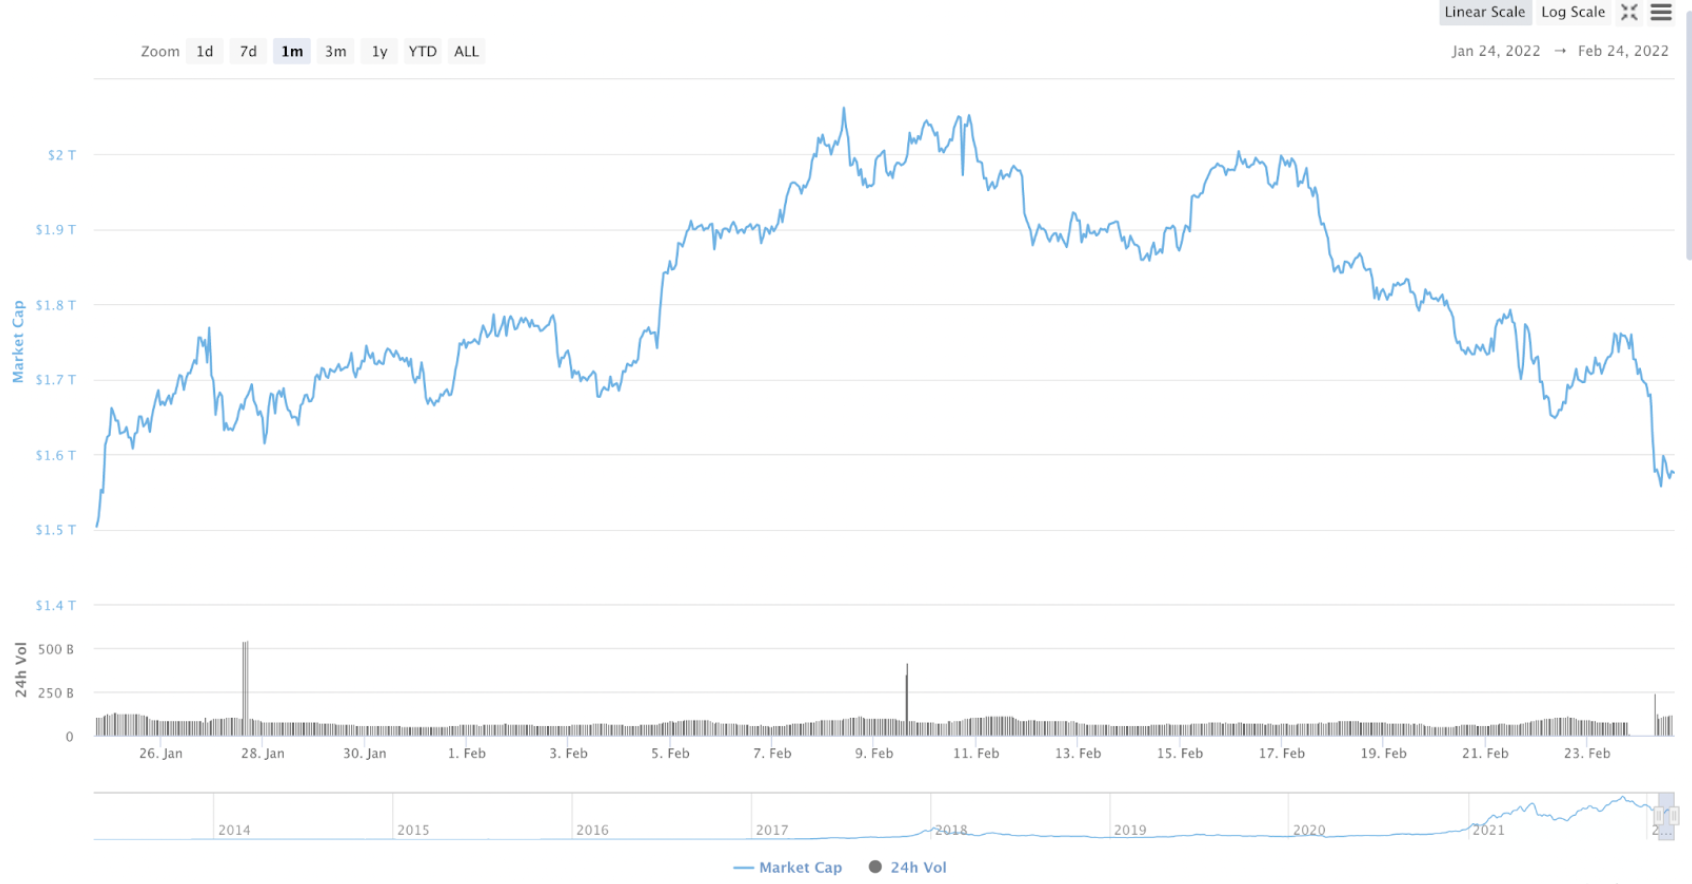
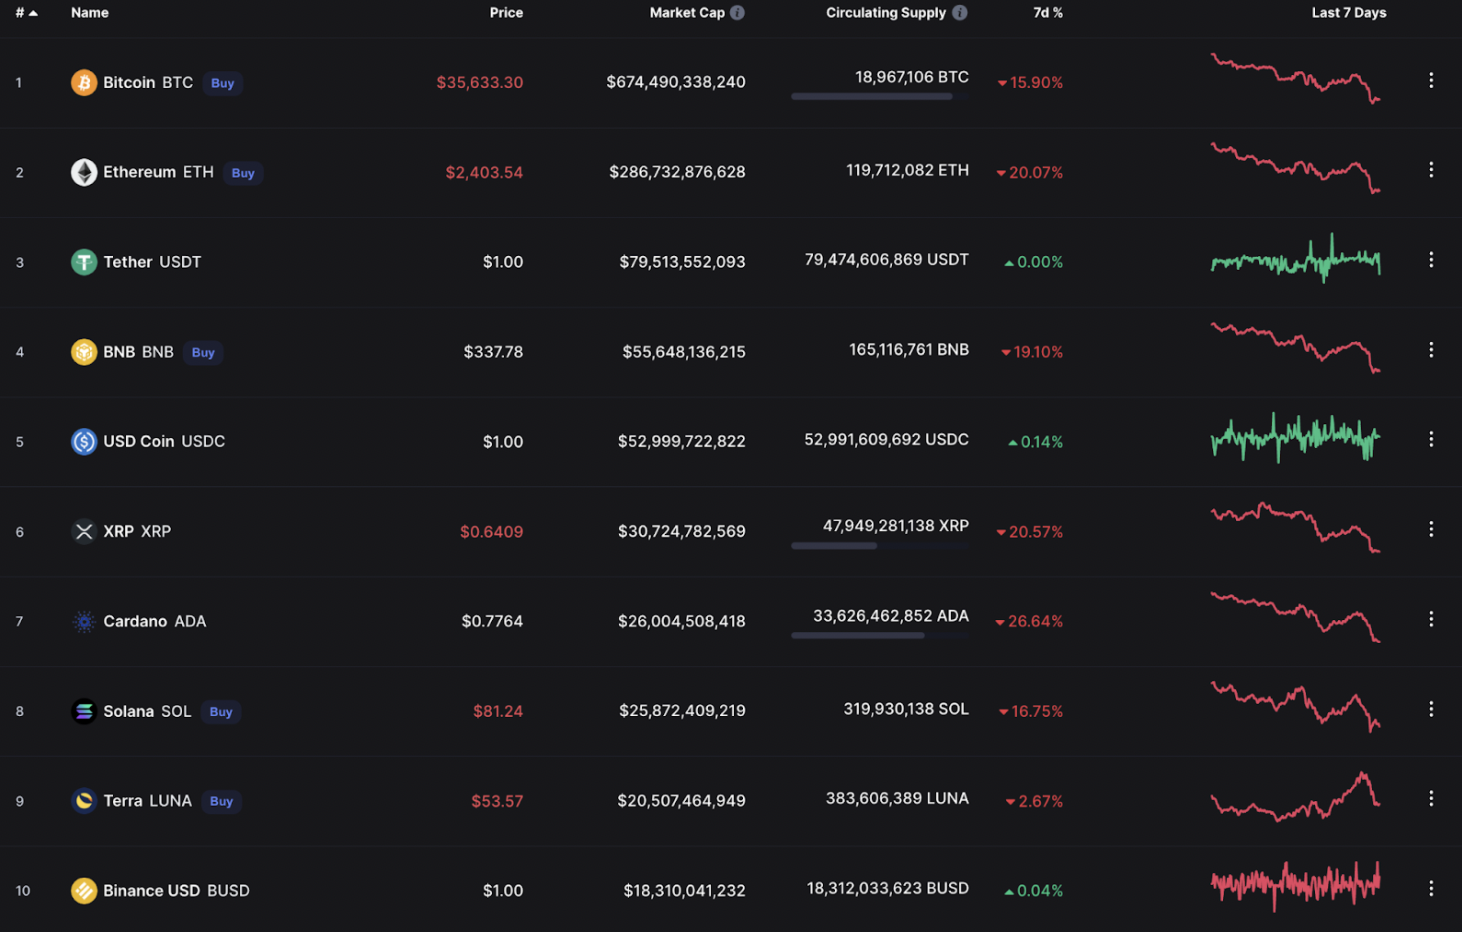
This is not the first time in 2022 that cryptocurrency prices are impacted by a larger trend in the economy. The rise in interest rates at the beginning of 2022 and the rumors of the Biden administration possibly implying regulations on digital assets triggered a decrease in cryptocurrency prices. The top 10 cryptocurrencies have tumbled from 2% up to 25% in price.
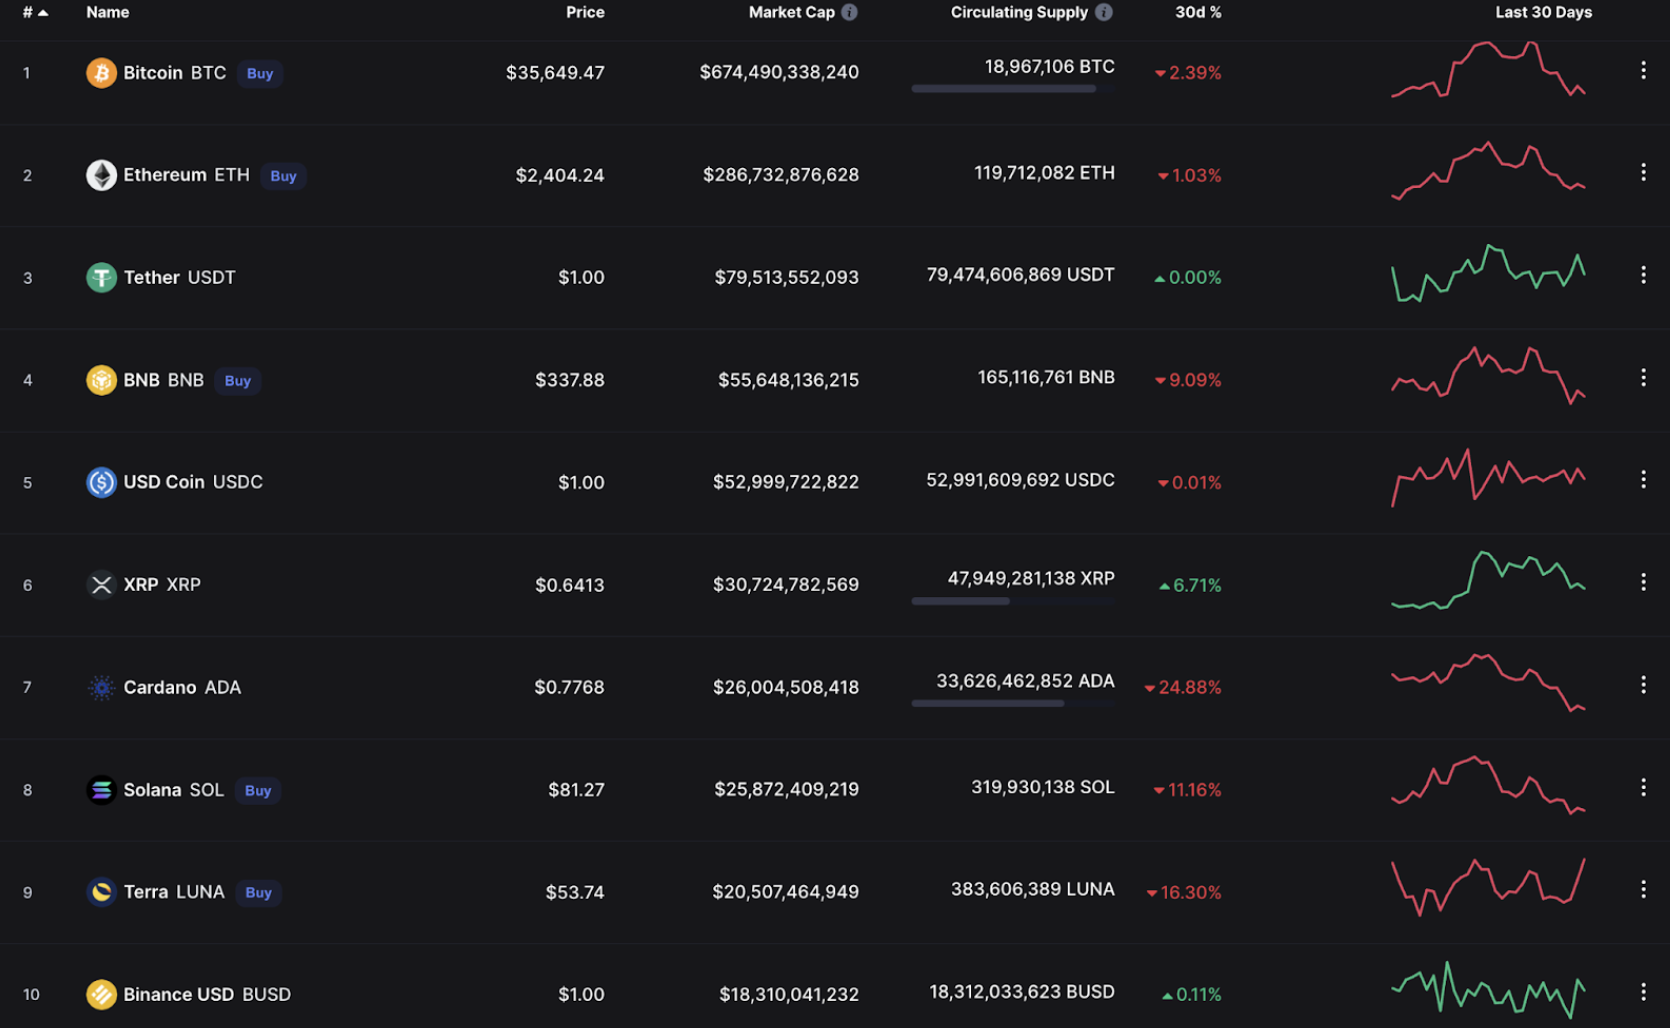
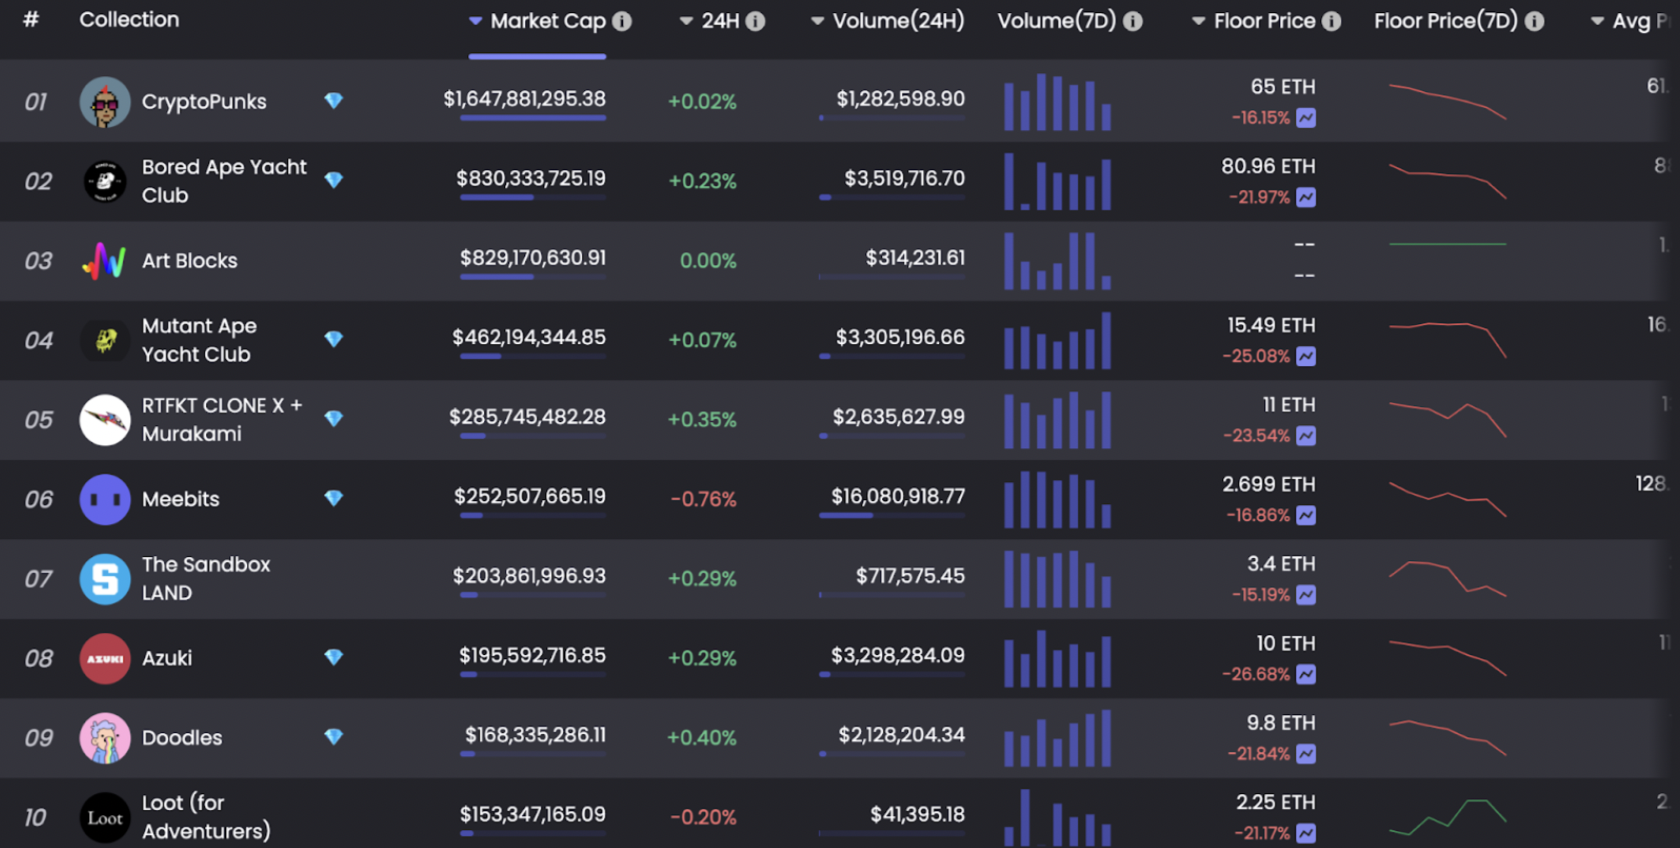
However, in the NFT market, on February 25, 2022, 90% of the top 10 collections by market cap have been escalating, this trend is present in 9 out of 10 top collections.
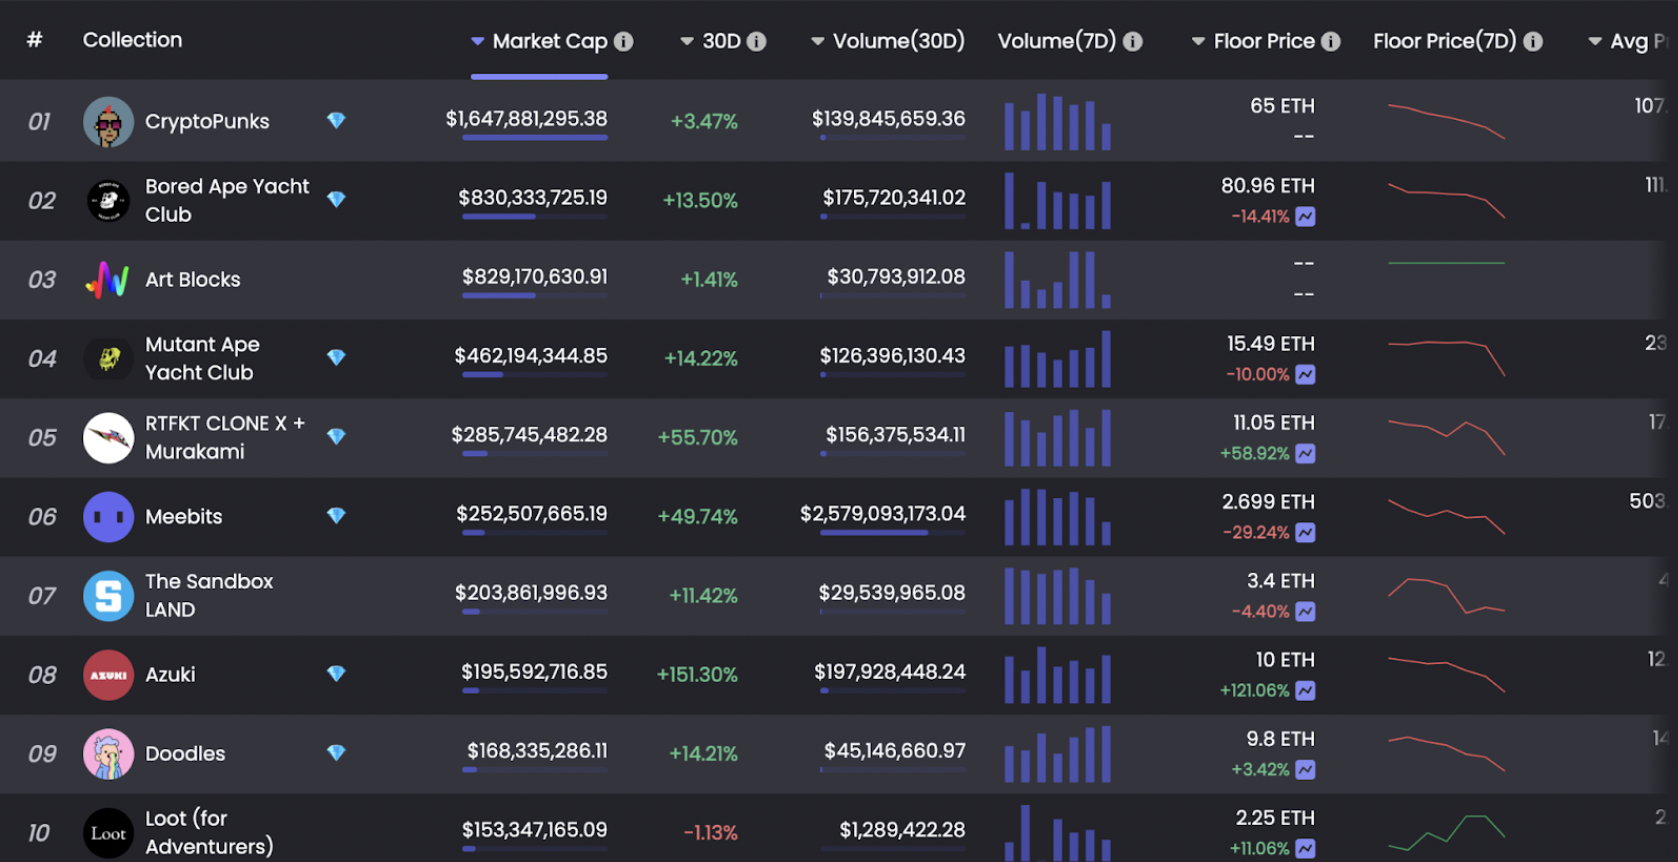
On February 25, 2022, The highest performing NFT collection in price among these top collections was Azuki with an increase of 121.06% in floor price in the past 30 days.
As the easing of panic in the market, the market value of blue-chip NFTs has been stable in recent fluctuations, and the prices of small-cap projects are greatly affected due to high gas fees. The overall price of blue-chip NFTs has also corrected with the sharp drop in the currency market. Because the buying order is large enough, there is a quick rebound when the price of eth stabilizes. During the downturn, the perception of blue-chip NFTs in various communities is usdt-based rather than eth-based.
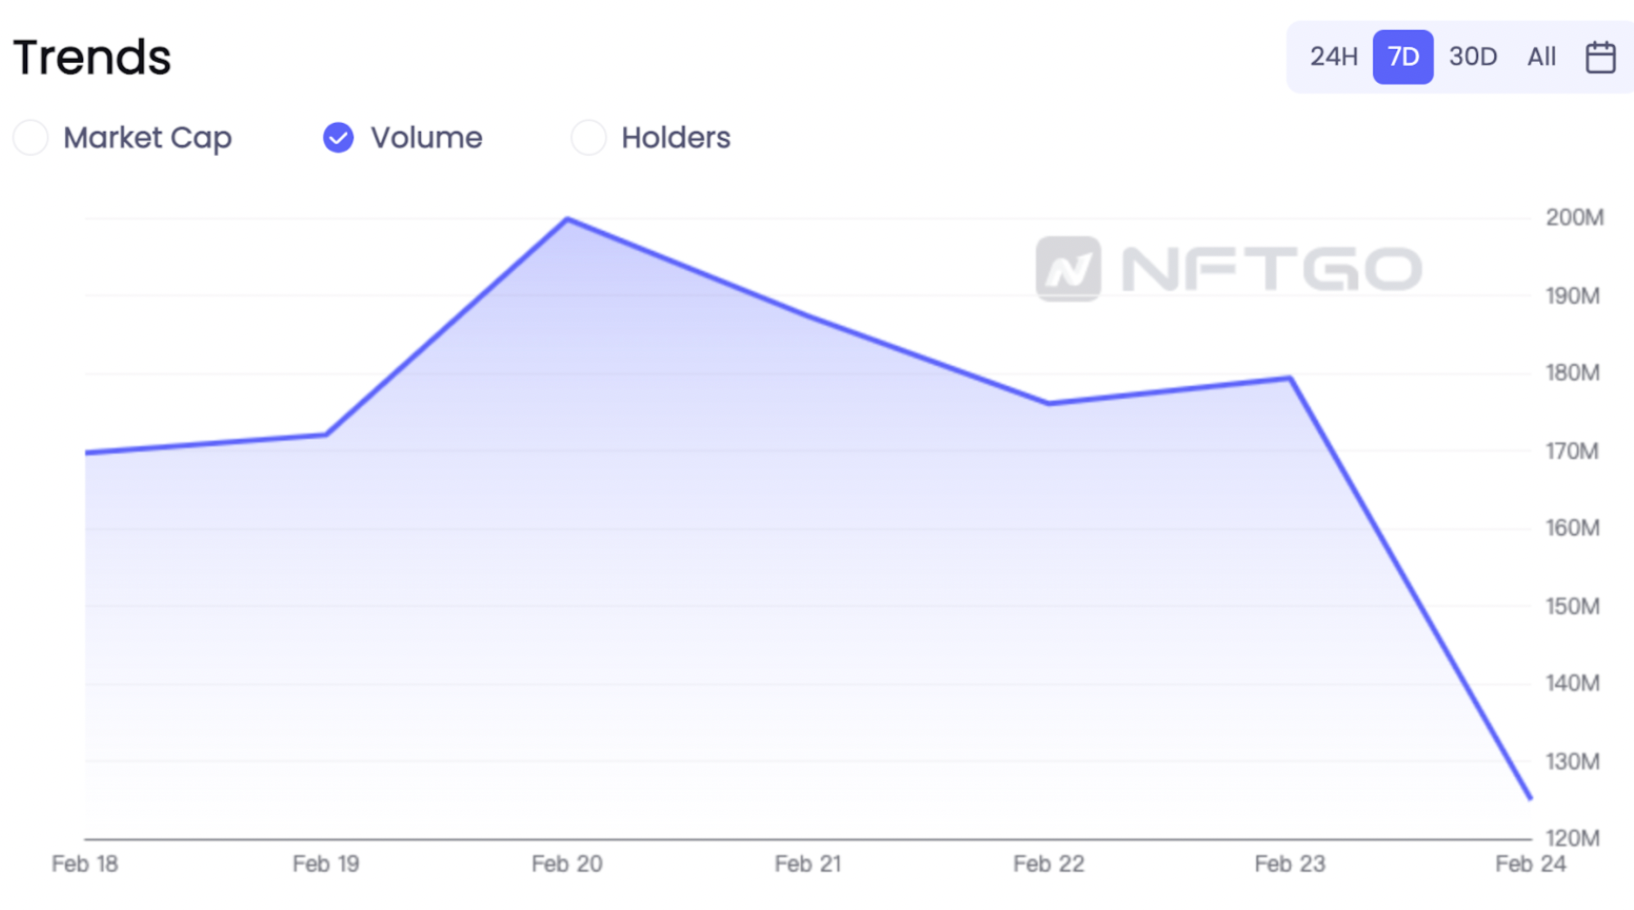
Volume trends
Volume in the NFT market is an important indicator of the demand for NFTs in the market. The NFT volume suggests high prominence among the public. The wave of enthusiasm starting in the summer of 2021 caused a spike in volume.
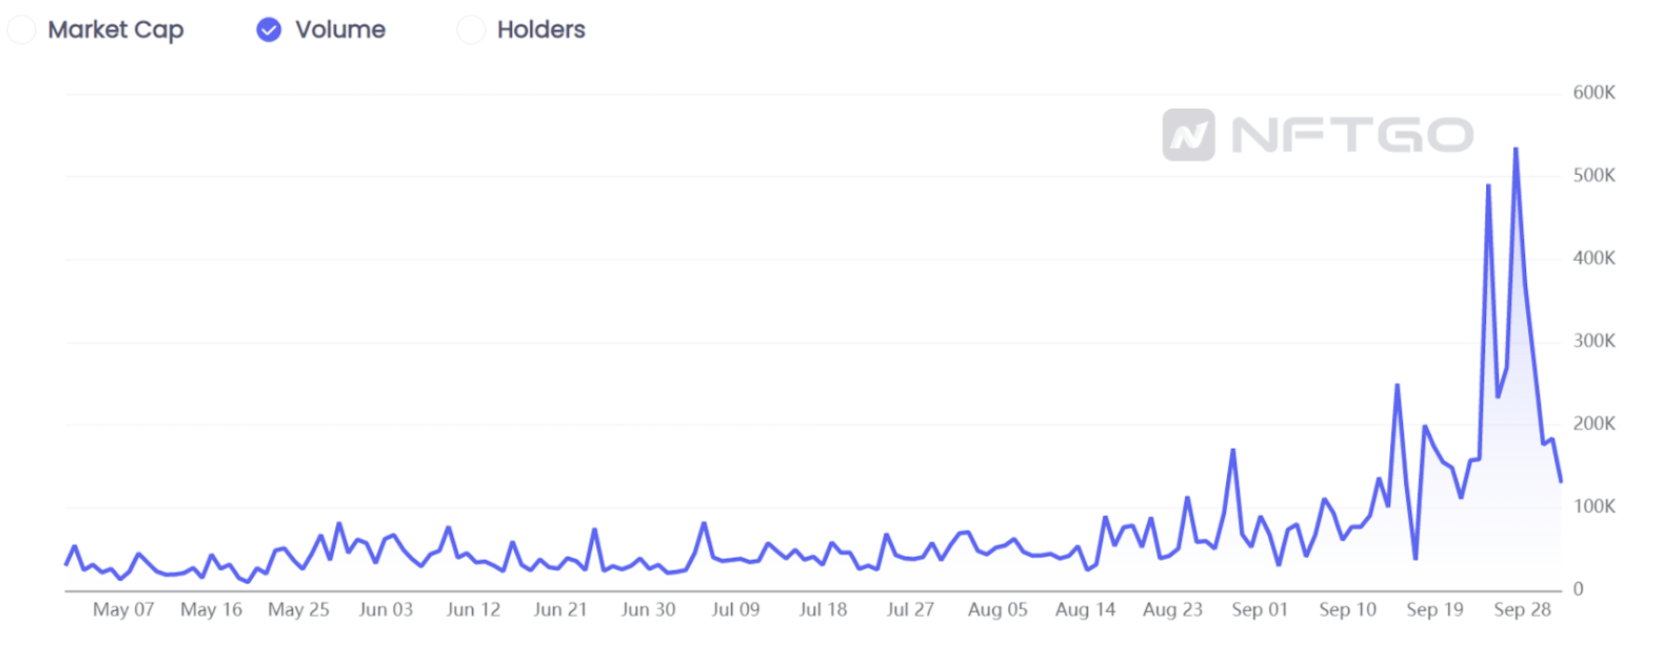
The trading volume continued to escalate until January of 2022. This increase was a consequence of the attention of the mainstream media to NFTs and more celebrities and influencers entering the space.
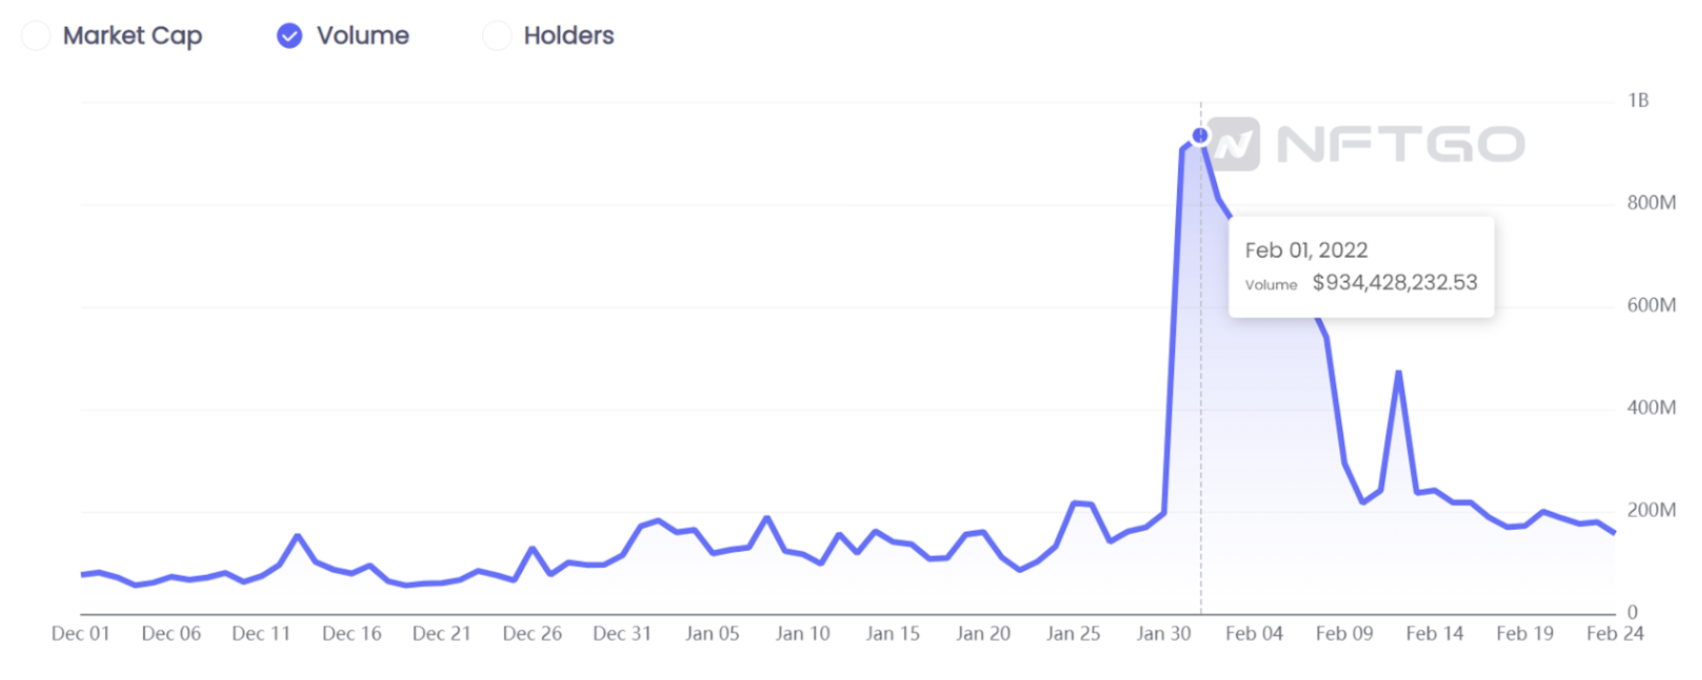
The volume in the market peaked on the first day of February and since then, it’s been on a decline. As we shorten the time range, the downward trend in NFT volume becomes more conspicuous.
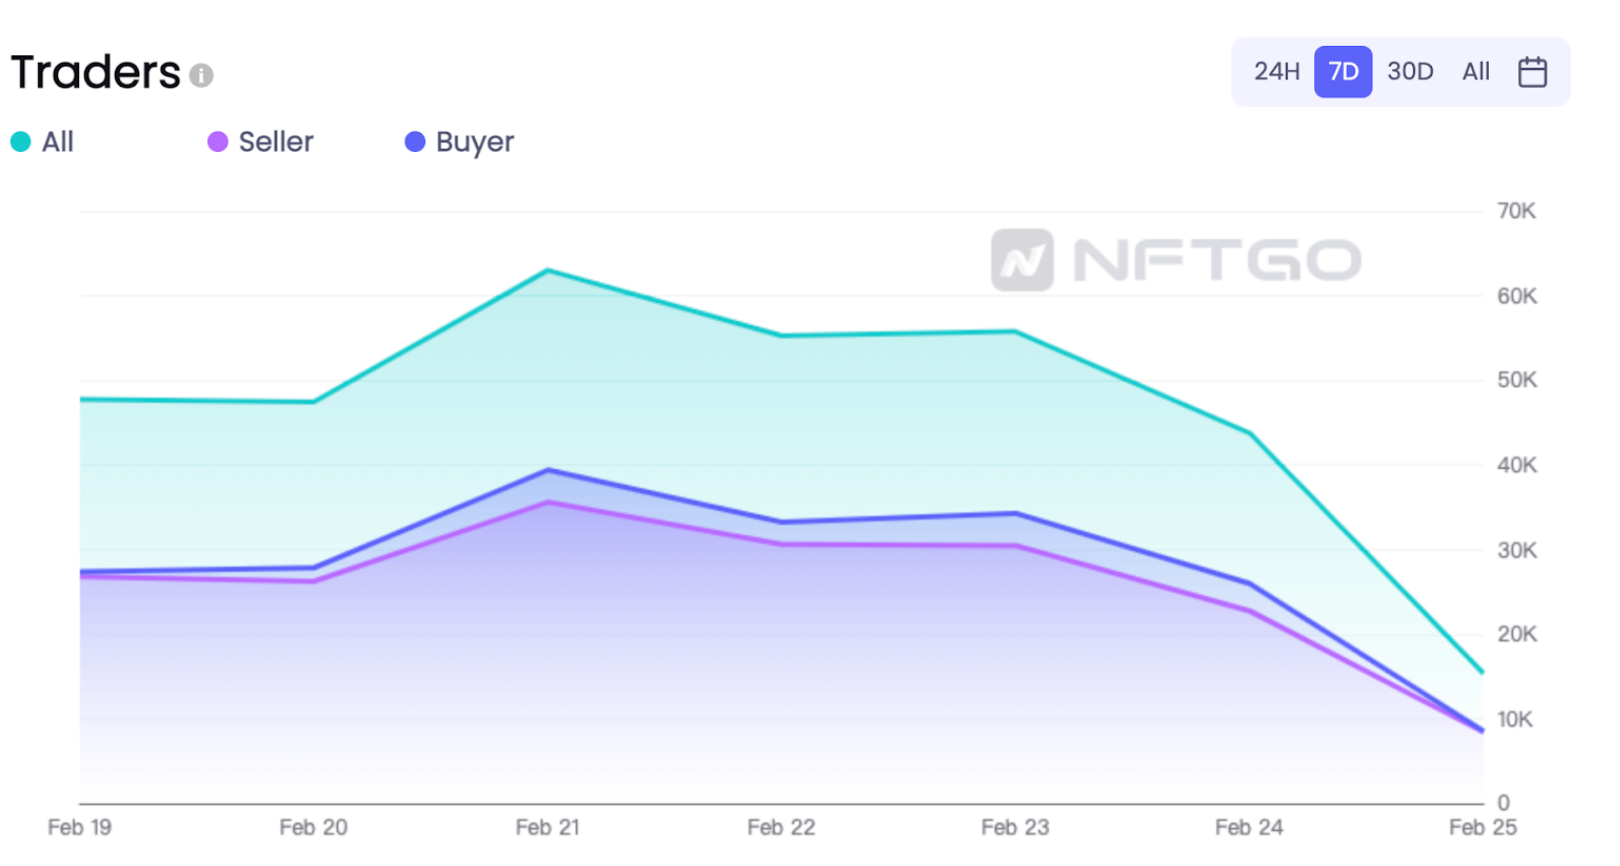
Volume is a measurement of the total value created through NFT trades in USD. This makes the traders themselves the primary driving factor of this trend. From the trends in the NFT traders count chart from NFTGo, we can observe a clear diminish in trader count. The number of buyers and sellers is highly overlapping. The decline in the number of NFT buyers signals a lowering of demand. The number of both sellers and buyers has fallen below 10,000. Generally, in bull markets, the number of sellers is about 3,000 less than the number of buyers. This is a sign of liquidity in the market and high demand. From the chart below, we can observe a clear decline in the market over the last week.
Part 2 -MicroTrends
Although the previous declines in price didn’t quite impact the excitement around the NFT market, the recent news about the war has impacted both NFTs and cryptocurrencies to a large degree. Over the past week, the price of all the major non-stable coin crypto currencies has been decreasing drastically. From 14% to even 26.64% in just one week.
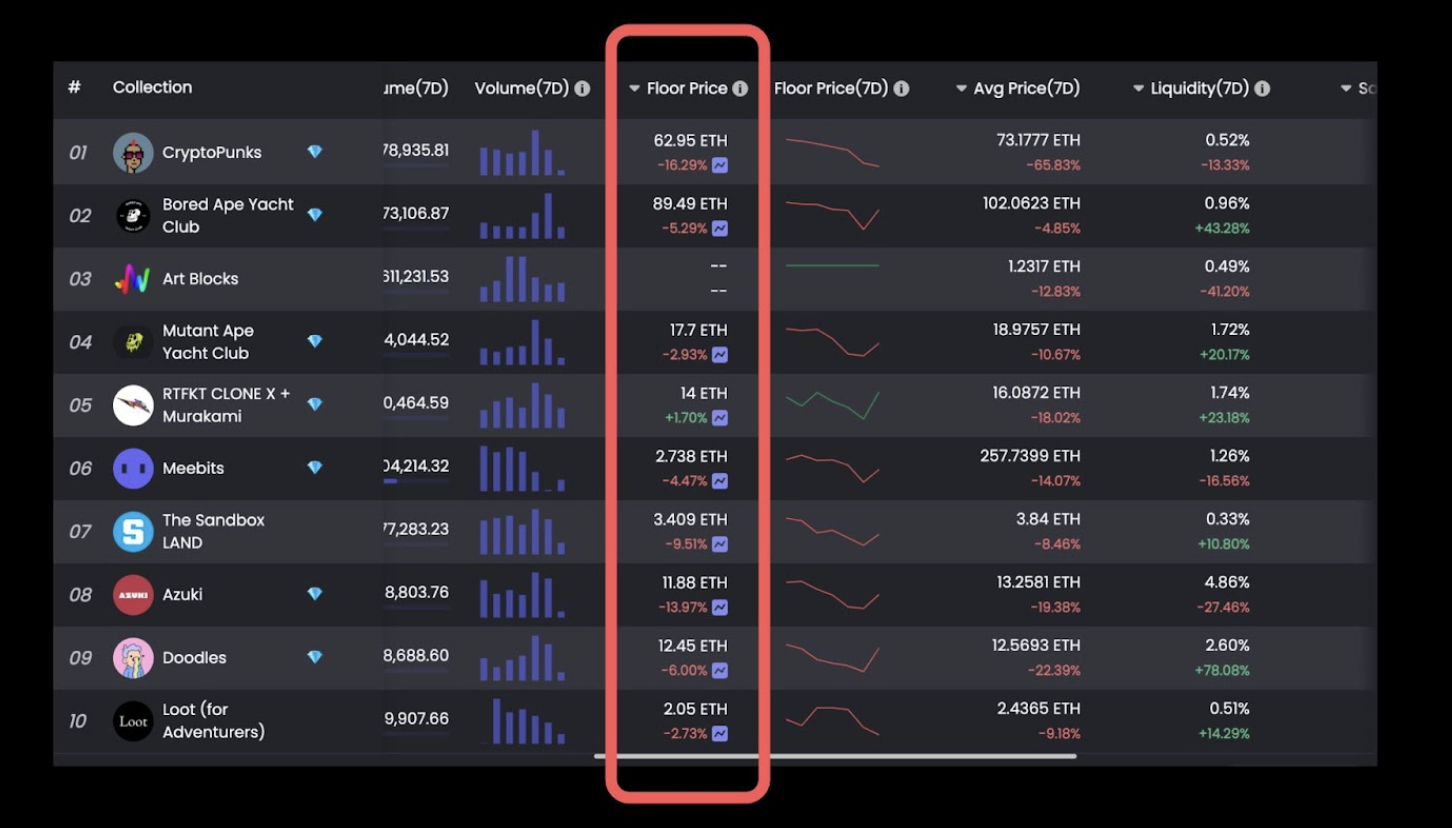
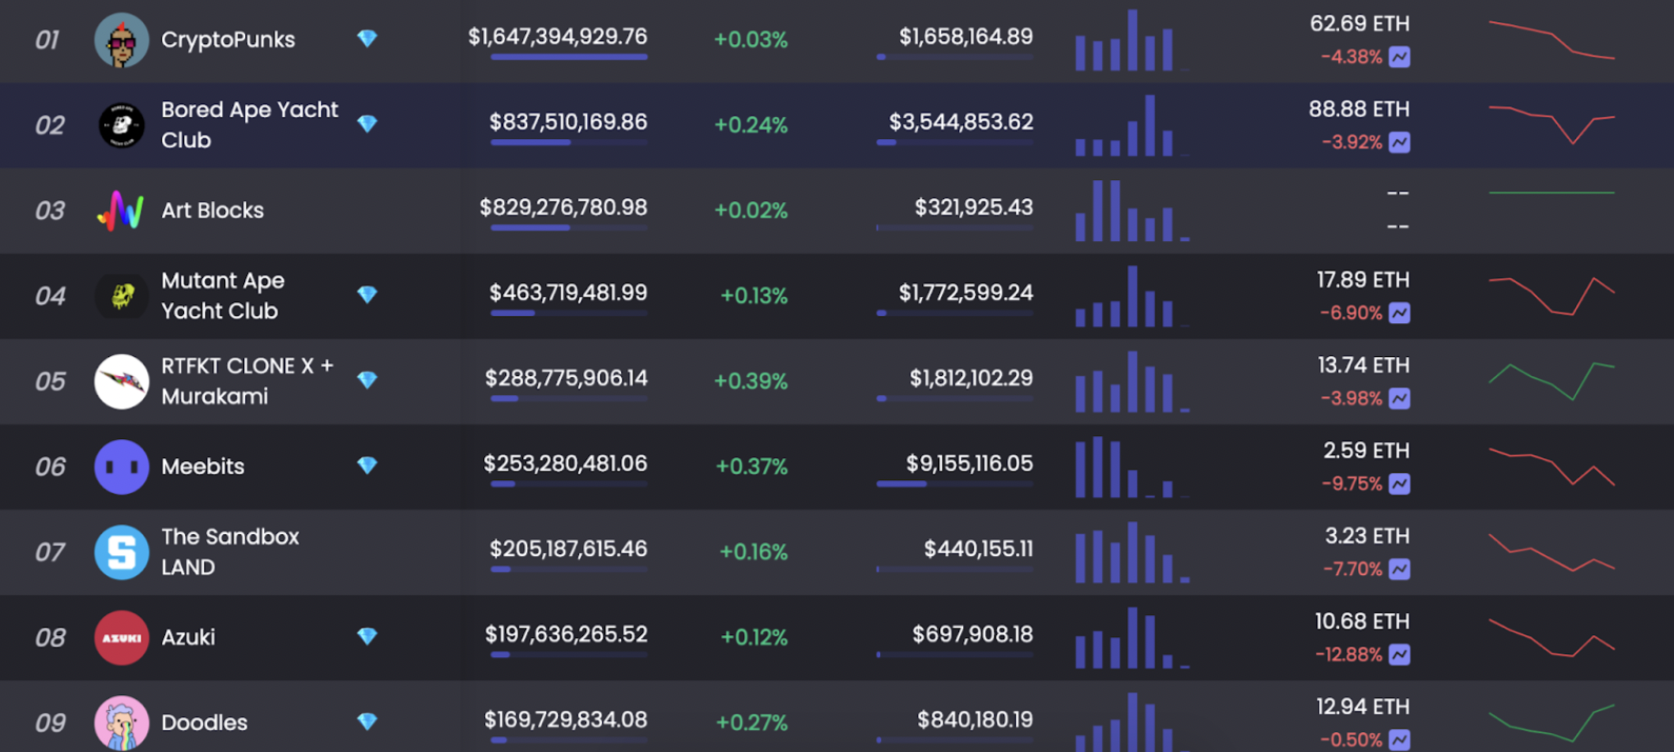
Quite the same trend is present in the NFT market. Among all the top 10 collections, MAYC has had the lowest decrease with -2.83% and CryptoPunks has had the highest decrease in price with over -16.29%.
We can observe that as we zoom in and look into the microtrends of the market, the impact of the current downturn on the NFT ecosystem starts to become more apparent.
The weekly holder and buyer trends are important phenomena that affect fluctuations in prices and are critical to forecasting the market performance of a given project, particularly when in times of crisis, the market participants tend to move away from assets into cash holdings.
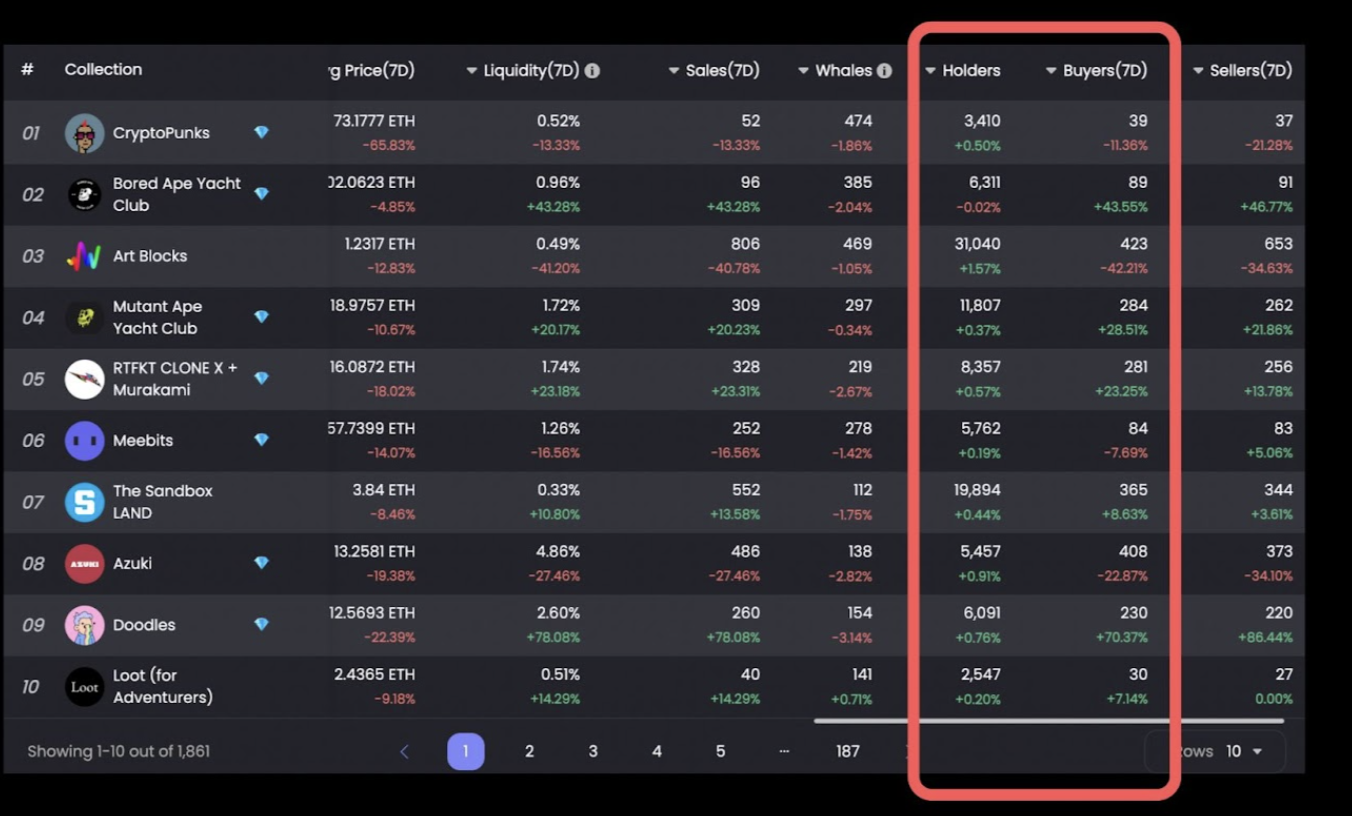
Unlike crypto markets where assets tend to generally have a 1/1 relationship, the declines in some NFT projects seem to have not only made competitors fall down but also made room for other projects to benefit. Most notably, Doodles had a 70% increase in buyers during the last week. However, the larger increase in sellers on the other hand evened out the wave of buyers and mildly affected the net holder count.
The large increase in trading activity for Doodles has spiked the liquidity up. Doodles have had the largest increase in liquidity during the last week.
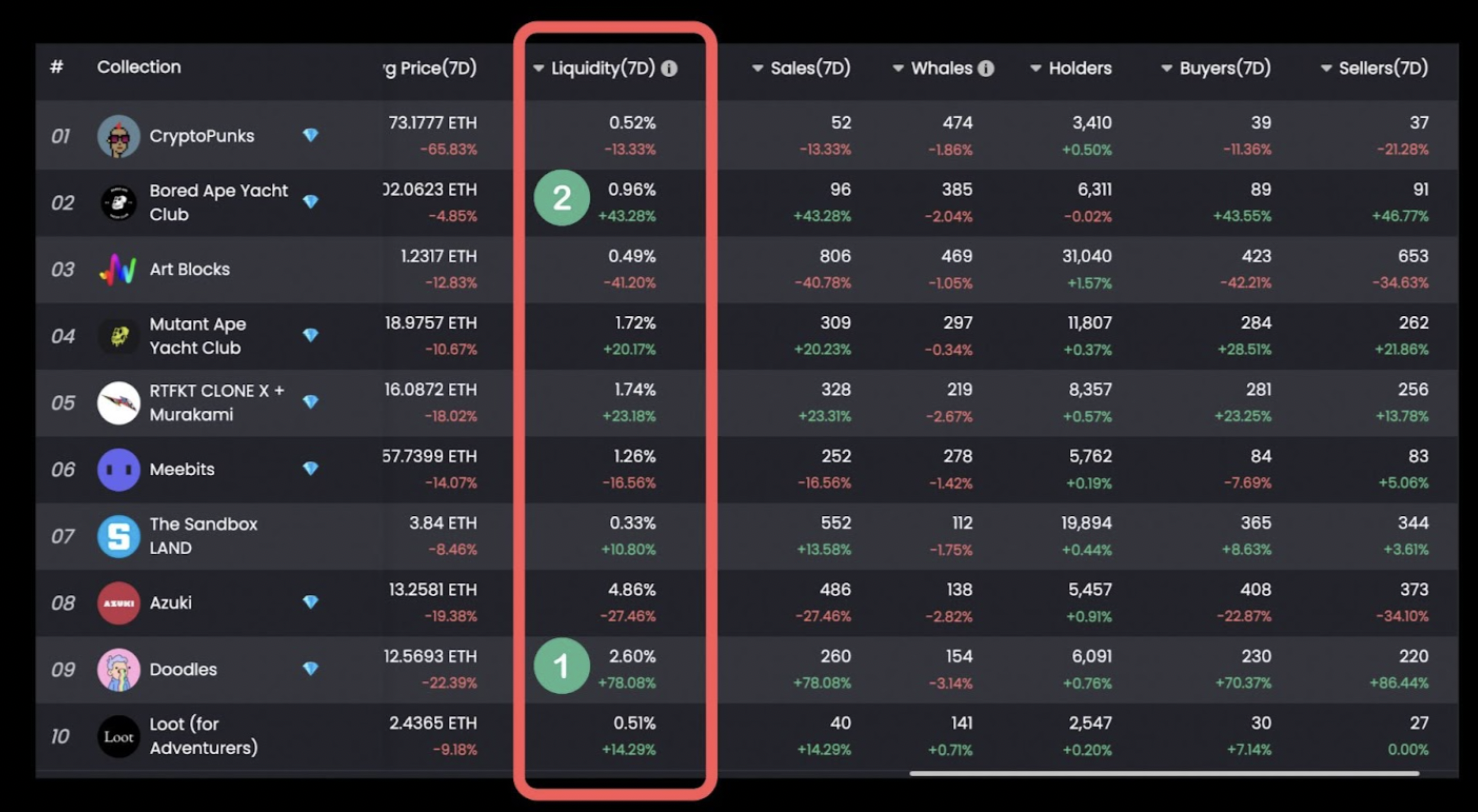
This trend is showing how even though some NFT projects are less liquid during this time, others are out-performing them to a large degree. Doodles’ liquidity is almost twice as large as the second place, BAYC with just under 1% liquidity. There is also another phenomenon when the average price falls and the floor price reaches 9eth, most transactions are not floored NFTs, but some relatively better-looking NFTs at 10 or even 12, 14, and 16eth.
During times of market crash, traders have a lot of options to choose from. The decrease in prices is a double-edged sword that might as well bring buyers with high conviction into the ecosystem.
According to NFTGo data, it can be seen that the funds flow of BAYC sellers. Yesterday, there should be a large number of BAYC holders shipped, and then they bought other blue chips. This shows that some big funds in the market are optimistic about the new blue-chip market outlook.
On February 25, 2022, the price of cryptocurrencies fell. The cryptocurrency prices reflect the fact that in times of crisis, people tend to lean into safer and more liquid assets. This trend in cryptocurrencies was followed by decreases in the NFT market as well.
The minor increases in market cap don’t even reach the 1% mark for large NFT projects. The price of these projects continues to shrink over time as well. However, after two day, many projects are rebounding quickly such as BAYC and Azuki, while some other projects like CryptoPunks are still falling down, which also reflects its community cohesion and consensus.
NFT and crypto correlation
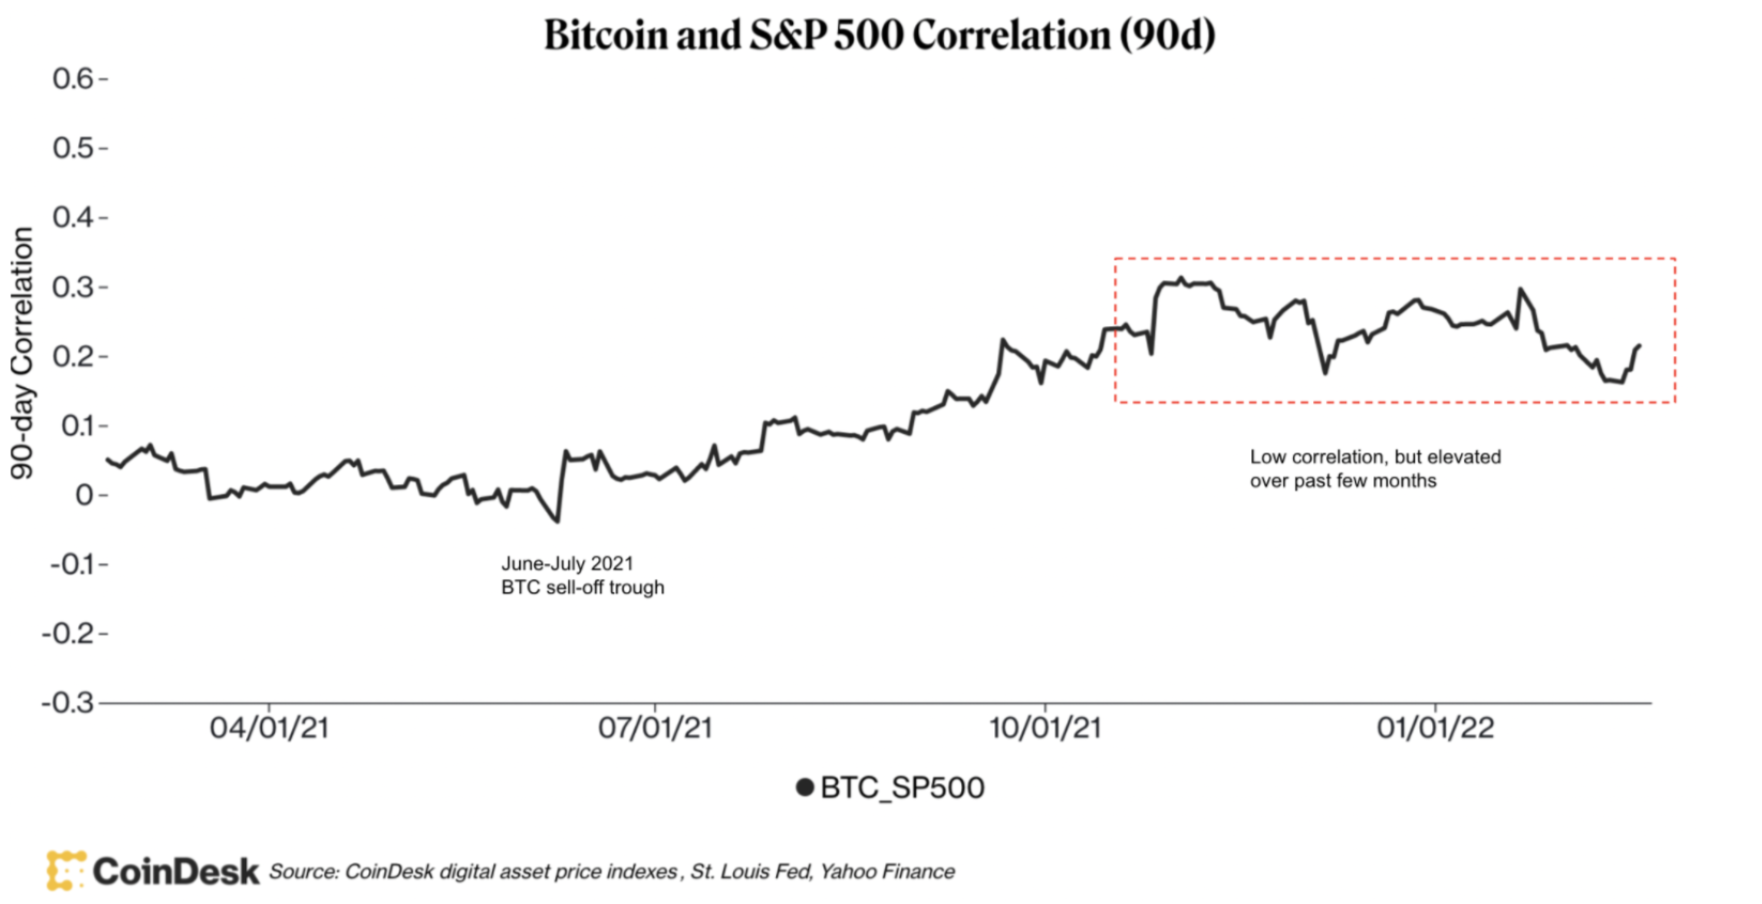
As NFTs get more broadly adopted, they will become more correlated with the prices of cryptocurrencies and follow macro trends. This trend has started to become present in the correlation between The S&P 500 and Bitcoin prices. According to CoinDesk, the data from these two assets suggest the emergence of a strong correlation between the asset classes.
Other than broad adoption, similarity analysis can also help us understand the NFT asset class on a deeper level. Compared with cryptocurrencies, an NFT is dissimilar from a cryptocurrency. Contrary to cryptocurrencies, NFTs are unique digital properties that can take the form of a piece of art or a cultural movement; Therefore, they have intrinsic value beyond being a unit of exchange -what most cryptocurrencies are aspiring to be. However, NFT exchanges are settled on the blockchain (ie. Ethereum), cryptocurrency is an irreplaceable part of the current NFT trading process. According to CoinMarketCap, the cryptocurrency market is over a trillion dollars. On the other hand, from the NFTGo data, we can observe that NFTs are only a $16 billion market cap. This indicates that NFT is about 0.016th of the cryptocurrency market.
The chart below visualizes the insignificance of the NFT market. It’s also worth mentioning that the NFT market has been around for only 5 years. Whereas Cryptocurrencies have been around since 2008.

Below is an illustration of the Eth price over the last week of February 2022 from CoinMarketCap.
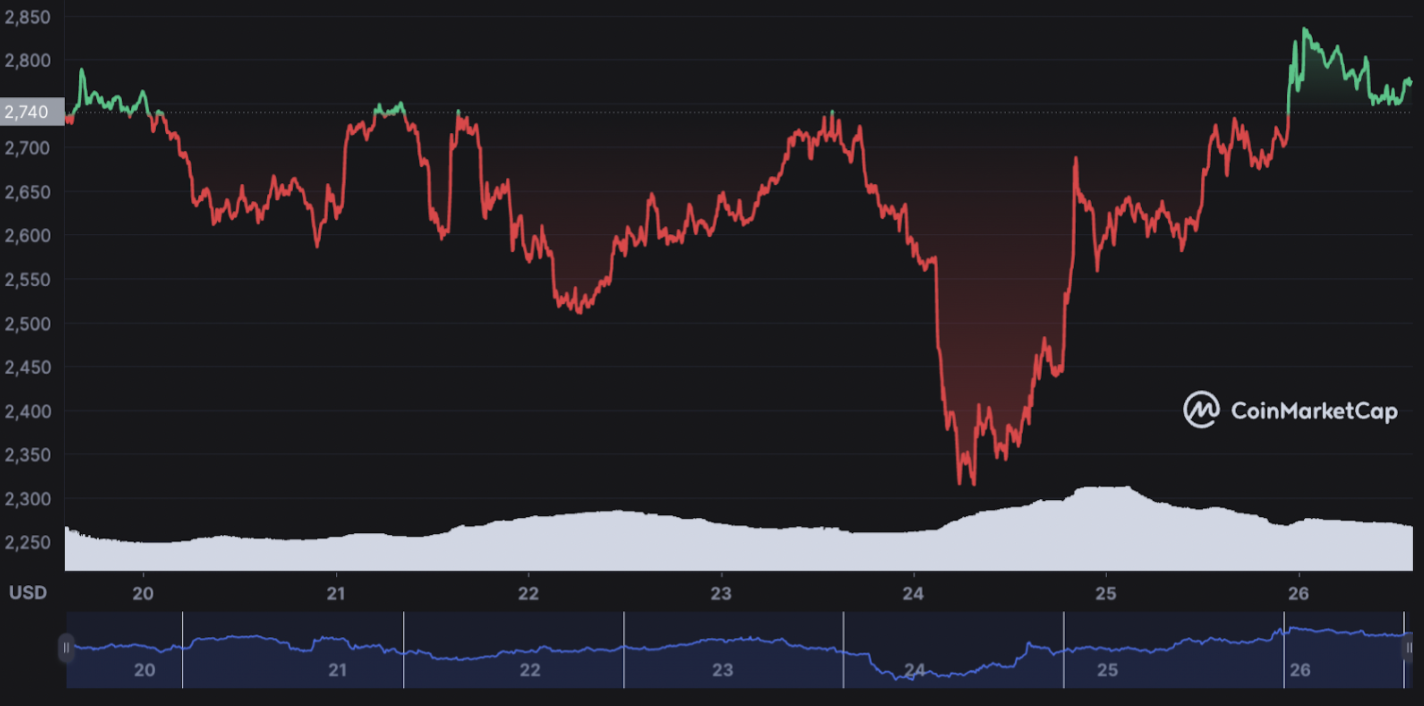
As the price of ETH starts to fall down, most NFT projects get impacted and the value of NFTs starts to tumble. The fast-paced changes in cryptocurrency prices due to their intrinsic volatility have a large impact on NFT price movements. When ETH is subject to large changes in a short amount of time, pricing NFTs for traders get higher. This can cause pumps and dumps in NFT prices. Below is a graph of CryptoPunks prices during the same period.
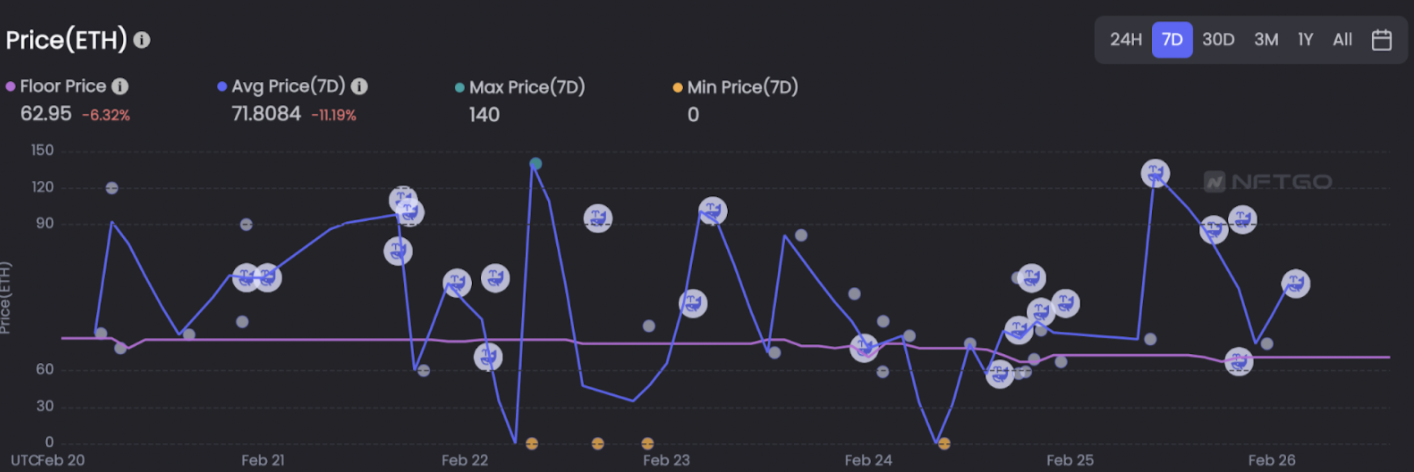
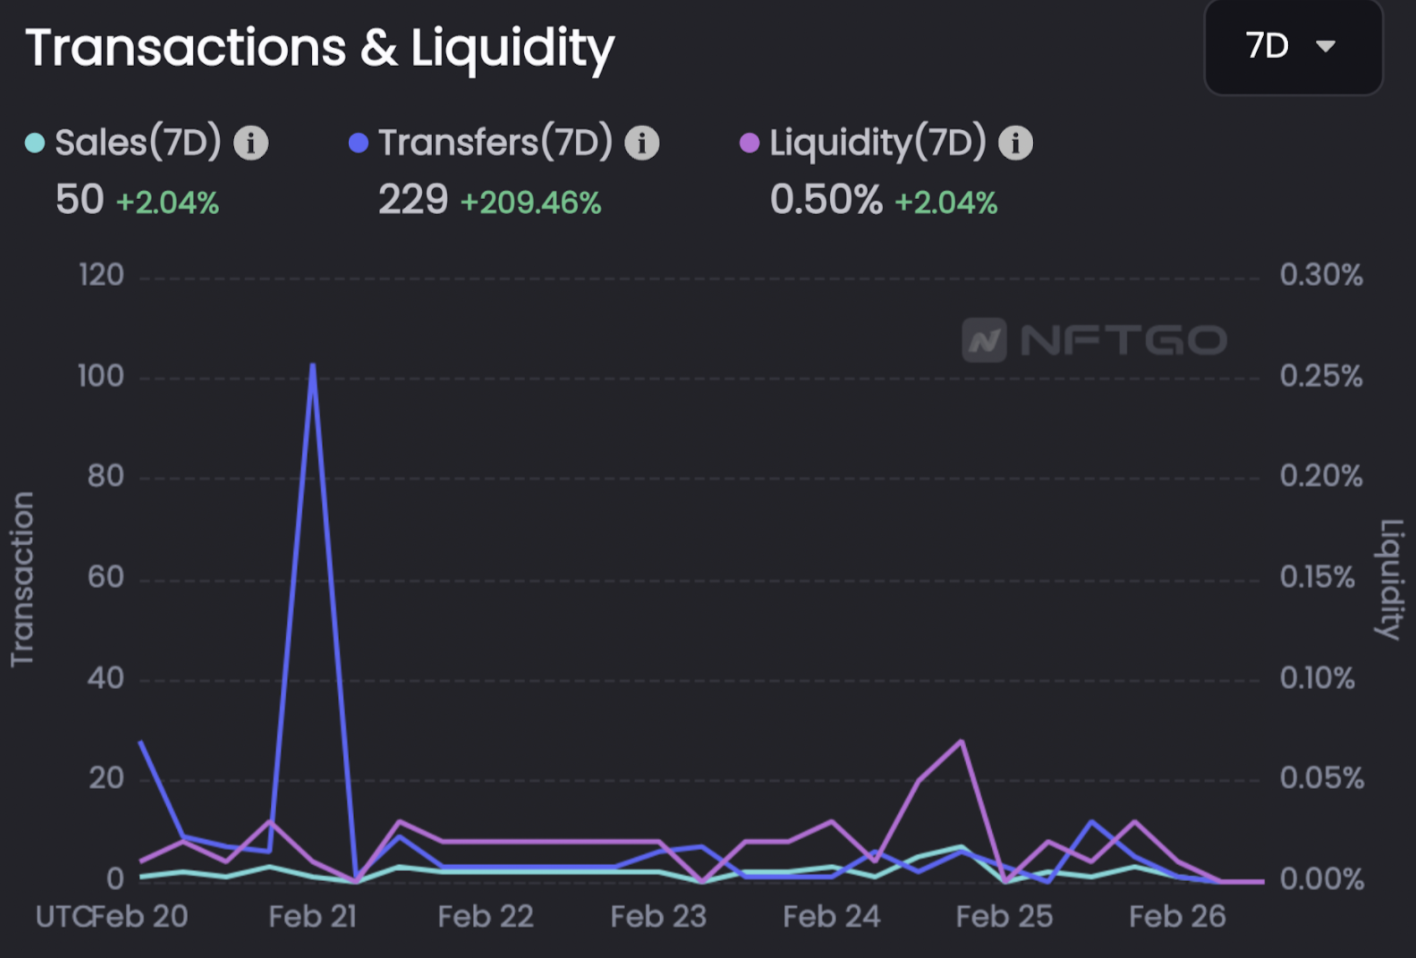
The uncertainty of ETH prices has also caused the transactions and liquidity in the project to stay flat. Most of the CryptoPunks transactions have been transferring transactions that just change the owner's address. The mild changes in sales and liquidity over the last week show the unwillingness of the holders to sell their CryptoPunk in these unprecedented times.
NFT Specific Trends
So far, we’ve been analyzing the correlations between NFTs and other asset classes. The trends in the NFT market, although correlated with cryptocurrency to some degree, have their unique trends as well. The unique and surprising trend within the NFT market is that although the overall energy of the market has weakened to a degree, some NFT collections are continuing to grow as strong as before. Amid the global crisis in the economy and markets, some NFT collections are profiting from their investors and outperforming current markets inside and outside of crypto.
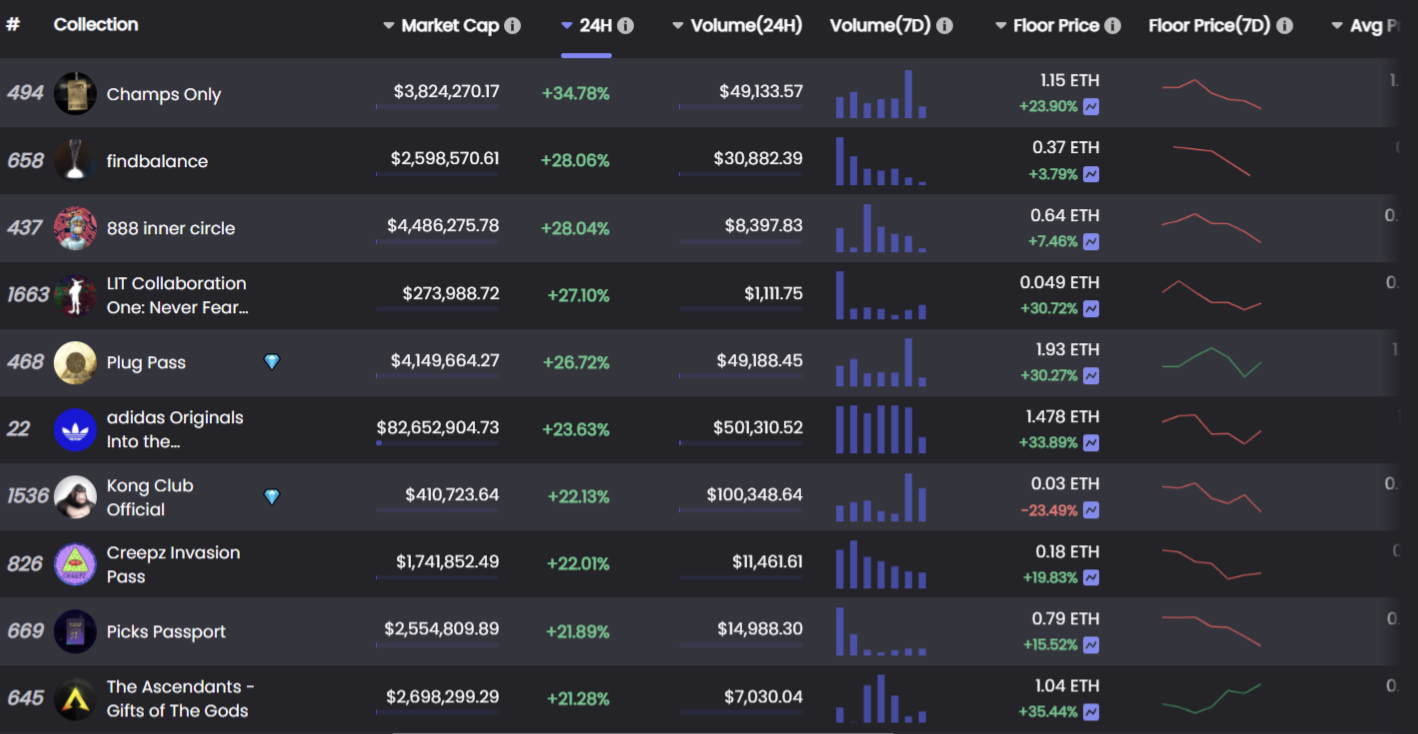
The chart above from the NFTGo rankings shows the impressive increases in some NFT projects’ market cap on February 26, 2022. These substantial increases are a sign of the uniqueness of the NFT market. Unlike other financial sectors, NFTs involve culture, art, and community. Some NFT holder communities continue to withstand times of crisis and not lose hope for the project.
The recent success of the Invisible Man is that he represents a culture. In an interview, Markus attributed him to a weak sense of existence on the Internet. They retain the innocence of children in their hearts and are not interested in the materialized world. The mourning culture is somewhat similar to Mfer. This kind of psychological identity is very easy to be recognized by netizens.
The hype of NFT is based on FOMO, but this can only be short-term prosperity. In order to gain the advantage of the majority of people's collective purchase in the secondary market, and let most investors be willing to be diamond hands, what the collection should value is not only the monetary return but the psychological companionship and emotion obtained by the owner. Trust is important and lasting, and this trend will become an important factor for the NFT market in the future.
Conclusion
One hypothesis might be that the NFT market took longer to react to the crisis already impacting cryptocurrencies and the stock market to a large degree. Although in a lot of ways, for better or worse, cryptocurrencies are a vital part of the NFT trading process, NFT’s distinction from interchangeable, single-purpose cryptocurrency may be the key to their success during a crisis. There’s the possibility for emerging NFT projects to function as a stand-alone market. Although the returns are impacted to some degree by the current situation, the market has not yet slowed down.
Recently, BAYC has seen a high sale of 500+eth, which may also be the beginning of a wave of the NFT bull market. Moving forward, it’s likely that NFTs will be impacted by the trends in the other sectors to some degree. However, the magnitude of this impact is up to the communities and participants in the market. Similar to other markets, NFTs aren’t driven by a single factor, rather, it’s the combination of the different forces outside and especially inside the market that will write the next chapter for the market.