- NFT trading volume encompasses trigger points, highs-to-lows, and continuity. As of now, the market is under the effects of a large cycle.
- NFT hype has transformed from mass media to community clubs. Rotation of categories is observed.
- BAYC-based hype approach is on-trend. The hyped event and price are highly correlated. Prices follow narratives.
- The market is now amid "intensification of expectations" and "burst of the bubble", which is similar to the crypto market, but different in some other ways.
NFTs had a long journey before blossoming into the $19B markets that they have today. It started with artistic creations and thought experiments. However, in the past two years, NFTs have slowly matured into an active market, demonstrating cyclical traits of an economy.
Looking at the big picture, the path from zero value to bubble, and from being unknown to being a household name, is inevitable for most emerging products. It's how a product regains a position that reflects its actual value and becomes a viable asset.
The Market Cycle
Like the traditional stock market, the NFT market demonstrates cyclicality in the short term despite the overall increase in market cap. This includes the "heat cycle" and "hype cycle."
The Hype Cycle
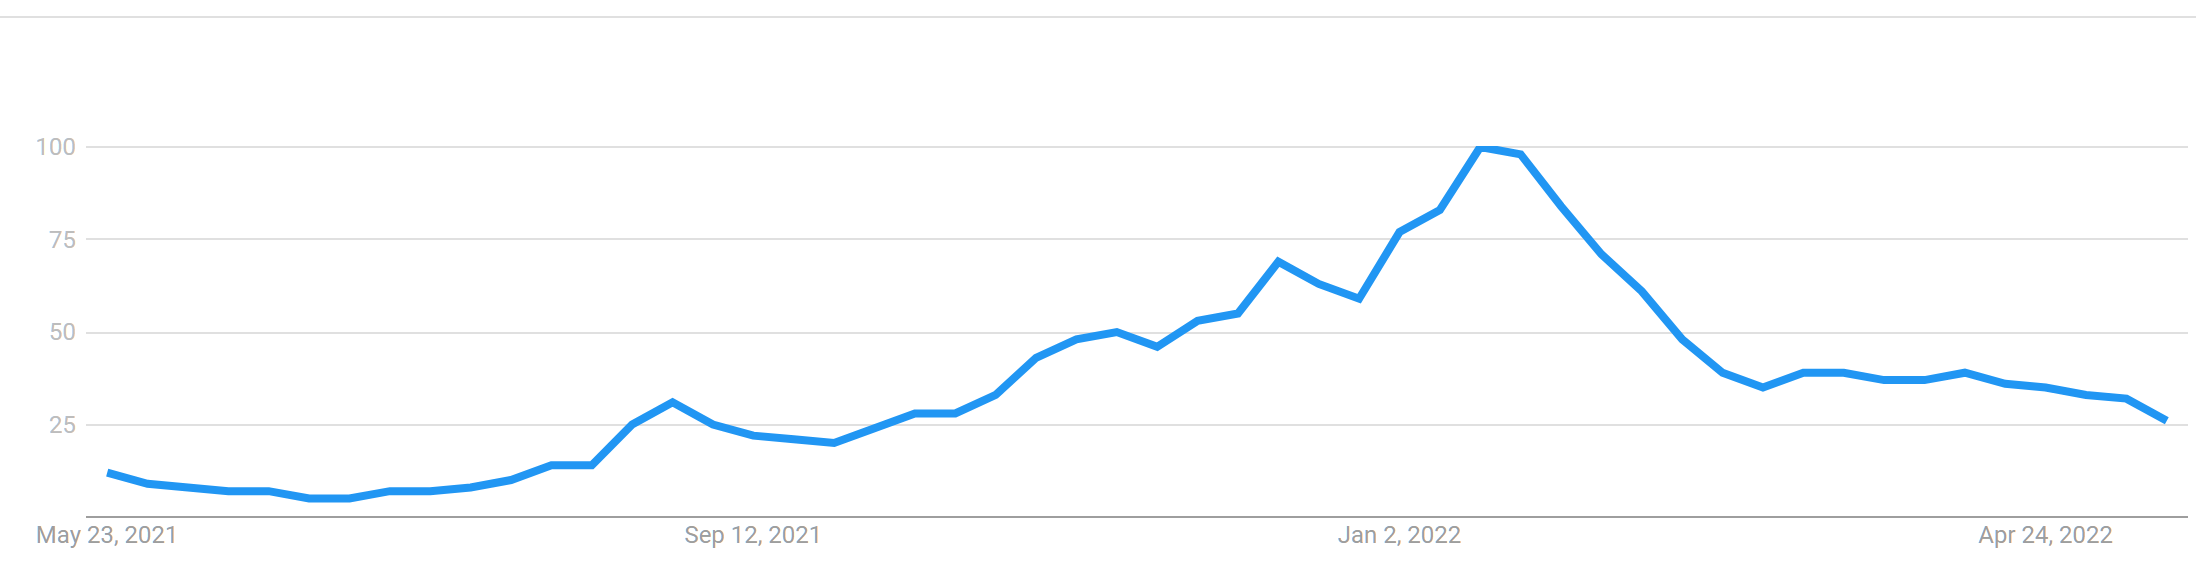
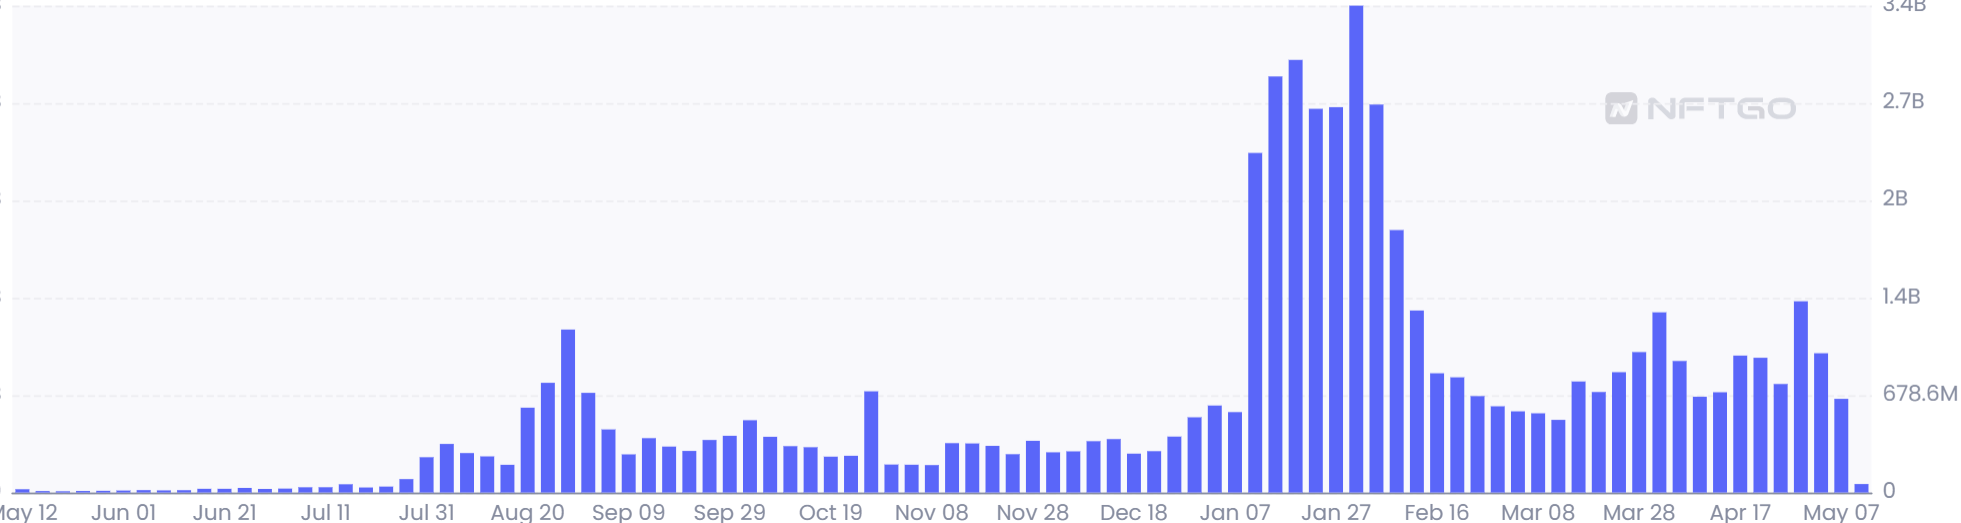
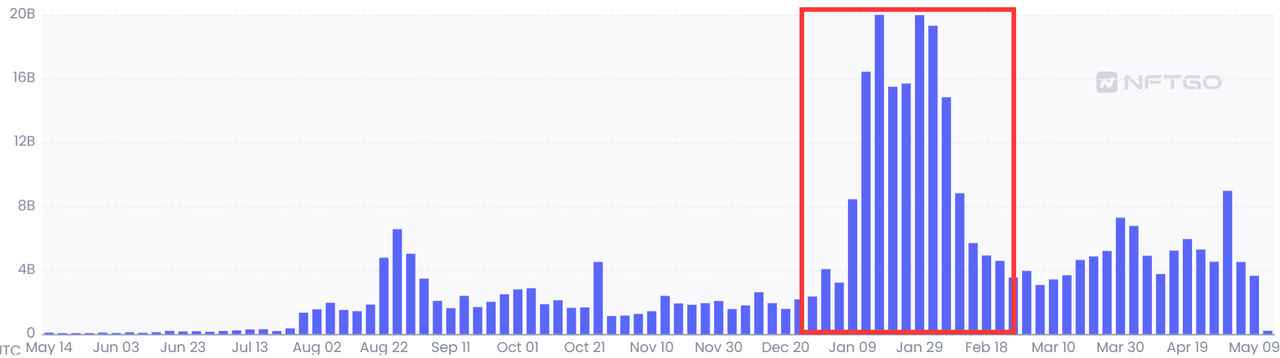
NFT popularity rose as the overall trading volume of the NFT market saw an increase. These two indicators show a strong correlation in their timelines. Combining these trends, we can see that between July and September of 2021 was when the NFT phenomenon began to take root. Fluctuations during this period were small and laid a strong foundation for the boom. January through February of 2022 saw the second market boom where trading volume grew five times more than before and lasted even longer. What can we learn from this pattern?
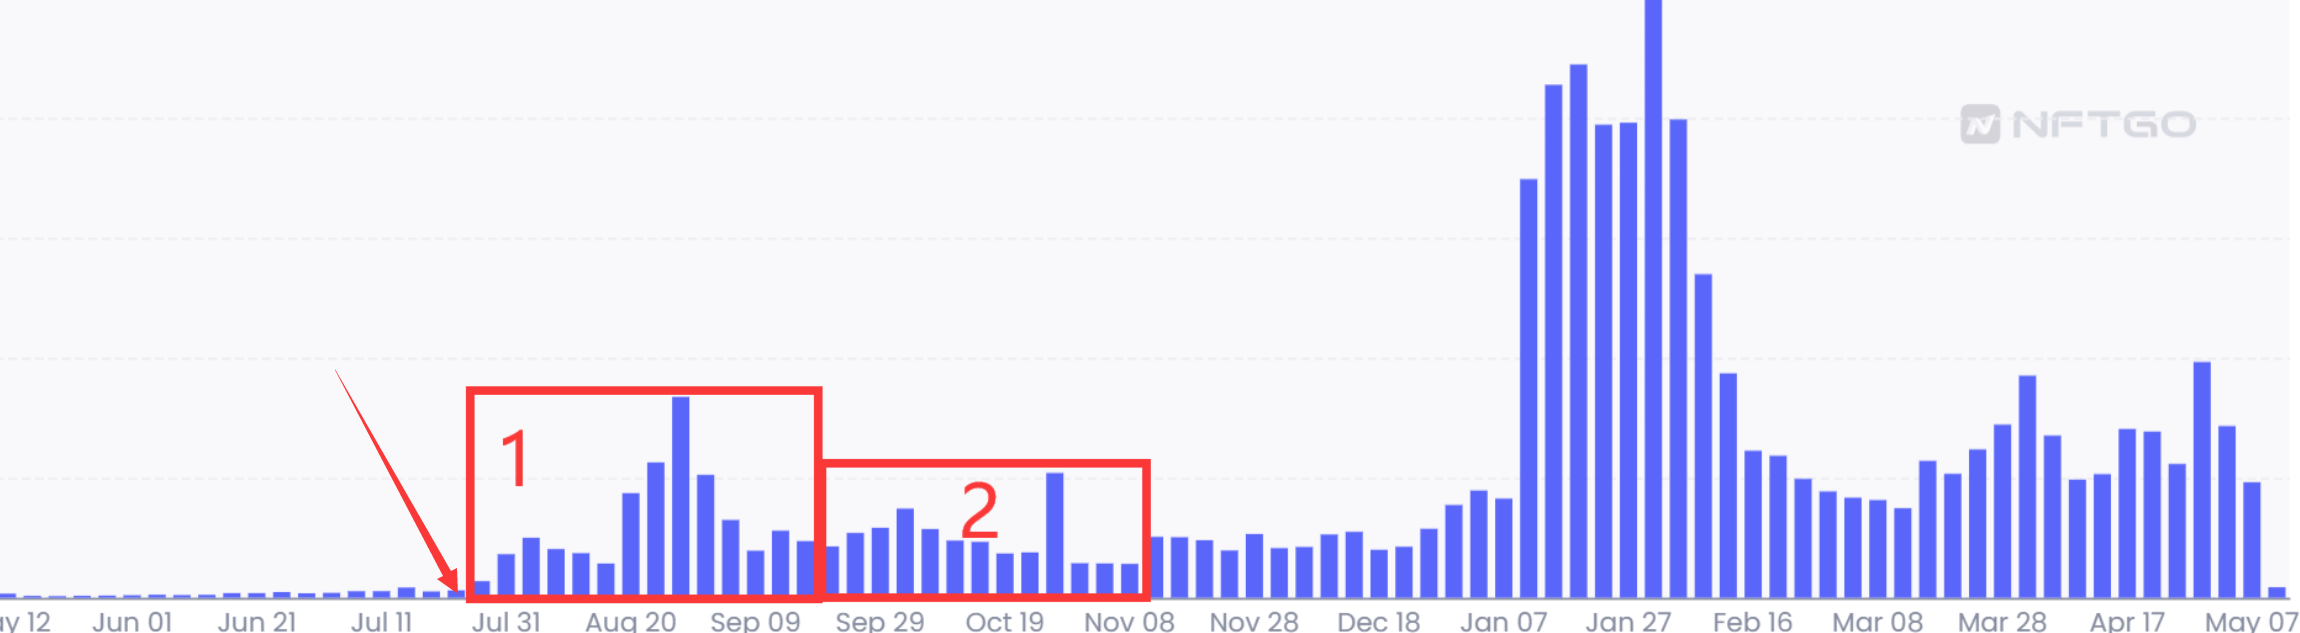
Using the chart below, we can further analyze the cyclical characteristics from the July to September period.
First of all, the activation of a cycle requires a "trigger point," which is often an event that attracts discussion and attention. The first phase is where we begin to see new highs consistently created. The heat of the first phase leads to the beginning of the second phase, where trading volume slowly drops and becomes stable. This is what we call a small cycle—a cycle that encompasses trigger points, highs-to-lows, and continuity.
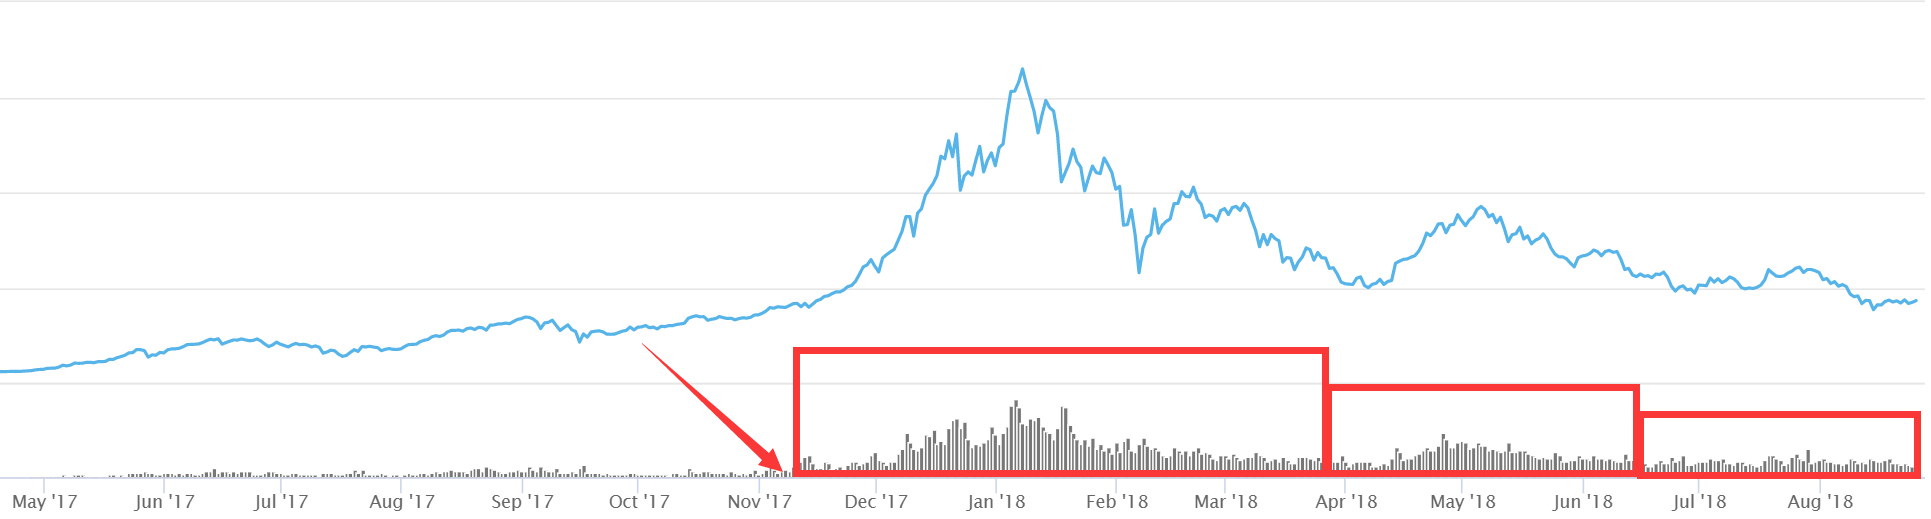
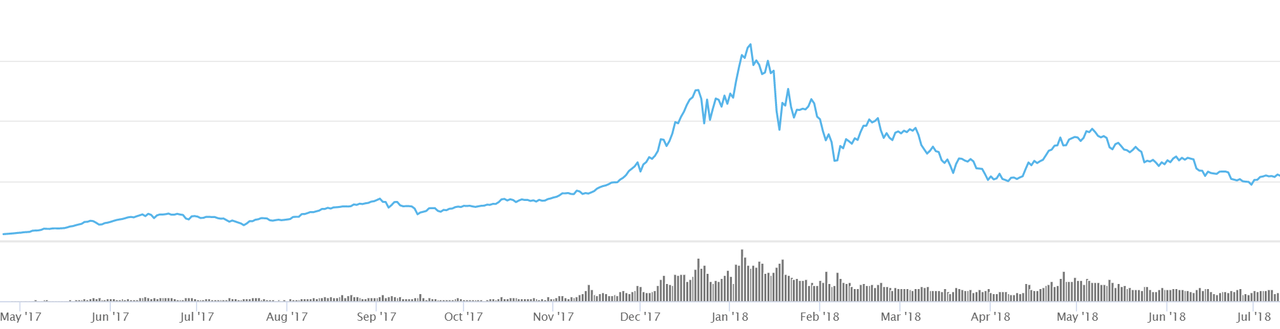
The current NFT market inherits the genes of the crypto market. The following chart shows a cycle of the crypto market cap from 2017 to 2018 where all three of these characteristics can be found. The trend started in November 2017 and caused three waves of highs and lows. Here we can see the difference between large cycles and small cycles, with higher peaks resulting in longer after effects. According to this data, the NFT market is currently experiencing the trials and tribulations of the big cycle that took place in January this year.
Development Cycle
Ways of dissemination
Almost every "trigger point" is correlated with hype. Here, we divide the source of popularity for an NFT into two groups: media and community. NFTs that gain popularity through the media are often a result of their artistic and collectible attributes.
Art NFTs are very much driven by the hype cycle. In March 2021, American digital artist Beeple sold his art NFT for more than $60 million, immediately attracting the interest of the mass media. As a result of this widespread media attention, other art NFTs in the market also saw a price increase. Soon thereafter celebrities such as Takashi Murakami and Snoop Dogg joined our community and NFTs were seemingly transformed into a cultural phenomenon by the mass media, thus successfully "igniting" the NFT market for the first time.
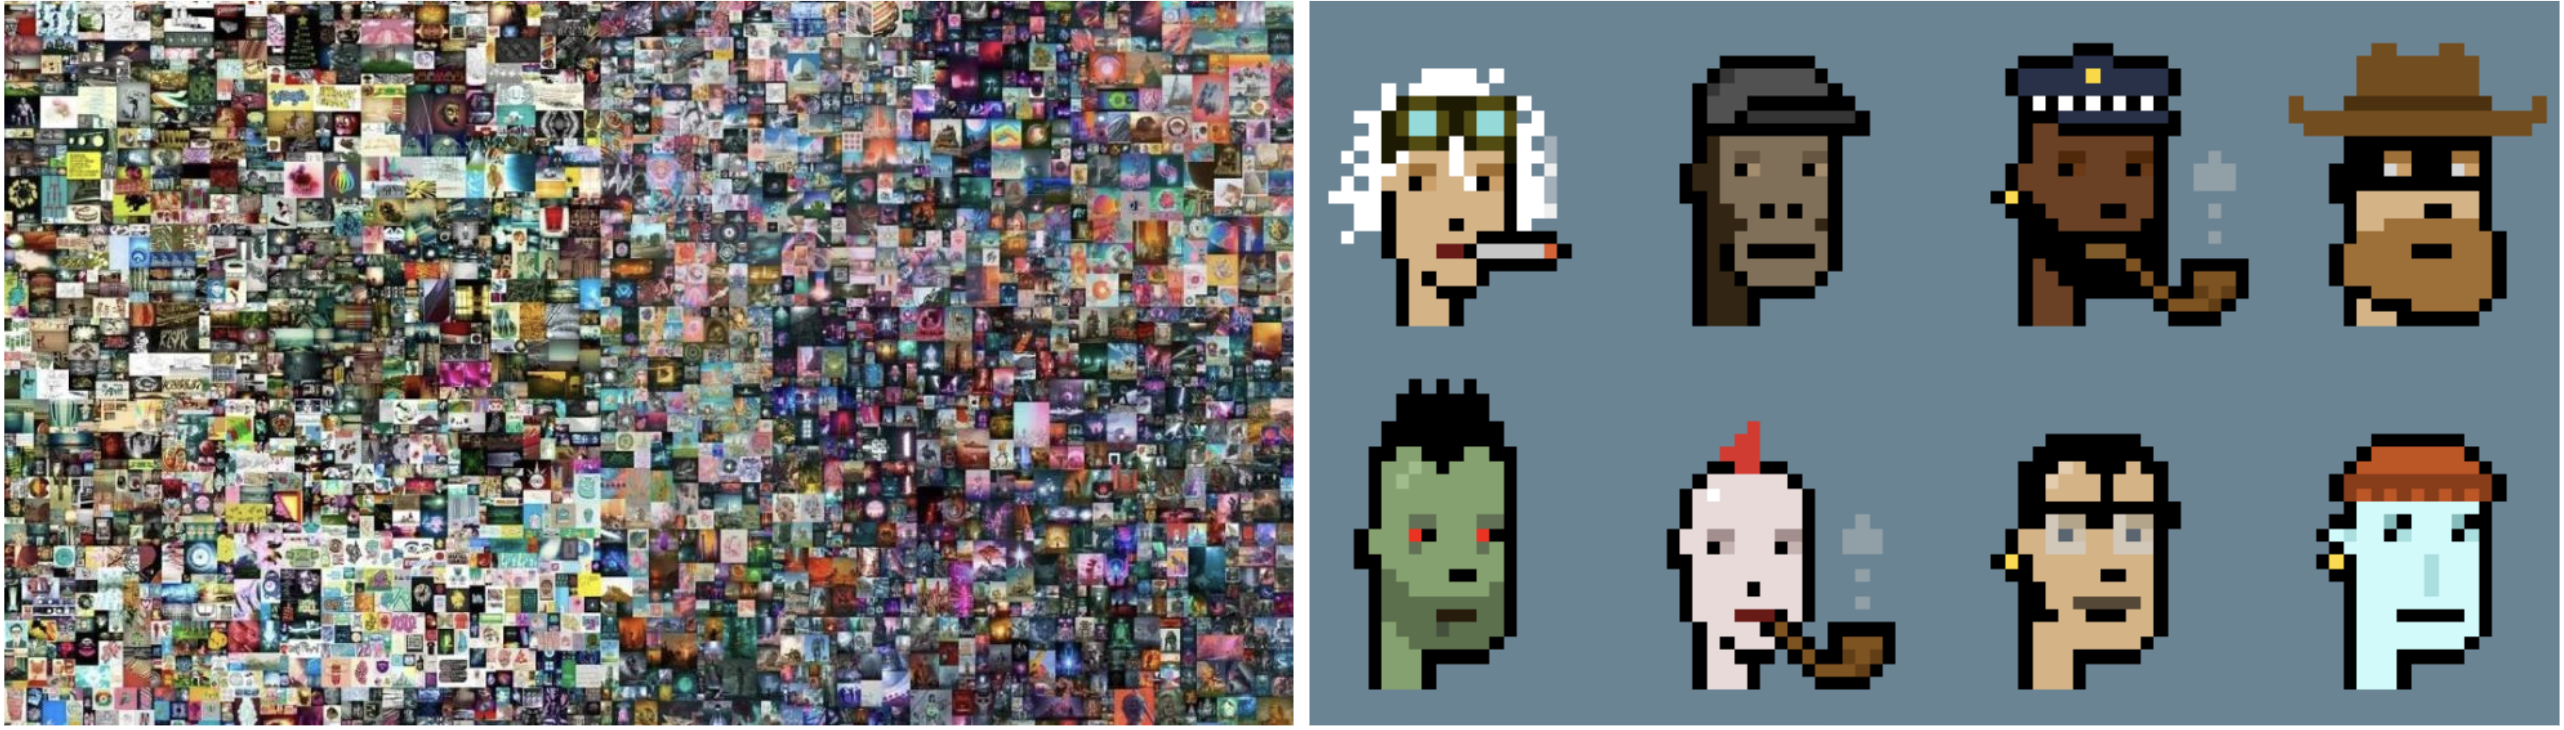
The next phase of the cycle emerged after the PFP collections of CryptoPunks and BAYC were launched. PFP projects enable people to connect with each other within their own niche communities. As a result, those individuals became the catalyst for the hype. Every individual then plays a part in the dissemination of the hype. The hype phase has now officially evolved into community hype and the direction of information distribution changed from top-down to bottom-up. This is one of the most important factors driving the Web3 community, the ability to change the direction of power from massive media corporations to small niche communities.
Consequently, celebrities rushed in to make NFT purchases. In July 2021, NFT trading volume reached a new record high.
Rotation of Classifications
Cryptocurrencies and other digital assets are often classified into separate categories. These categories include DeFi, NFT, GameFi, Layer 2, Public Chain, and Stablecoins. The popularity of these categories tends to rotate as the market focuses on one at a time.
Similar to the crypto market, the NFT market hypes up its categories in rotation, likely because the market has a tendency to hype up new and innovative ways to use these emerging technologies.
Rotation of crypto categories (last year): Defi——NFT——GameFi——Layer 2——Public Chain——Stablecoin
Rotation of NFT categories: Art——Chain——Sports——PFP——GameFi——DAO——Music——Pass
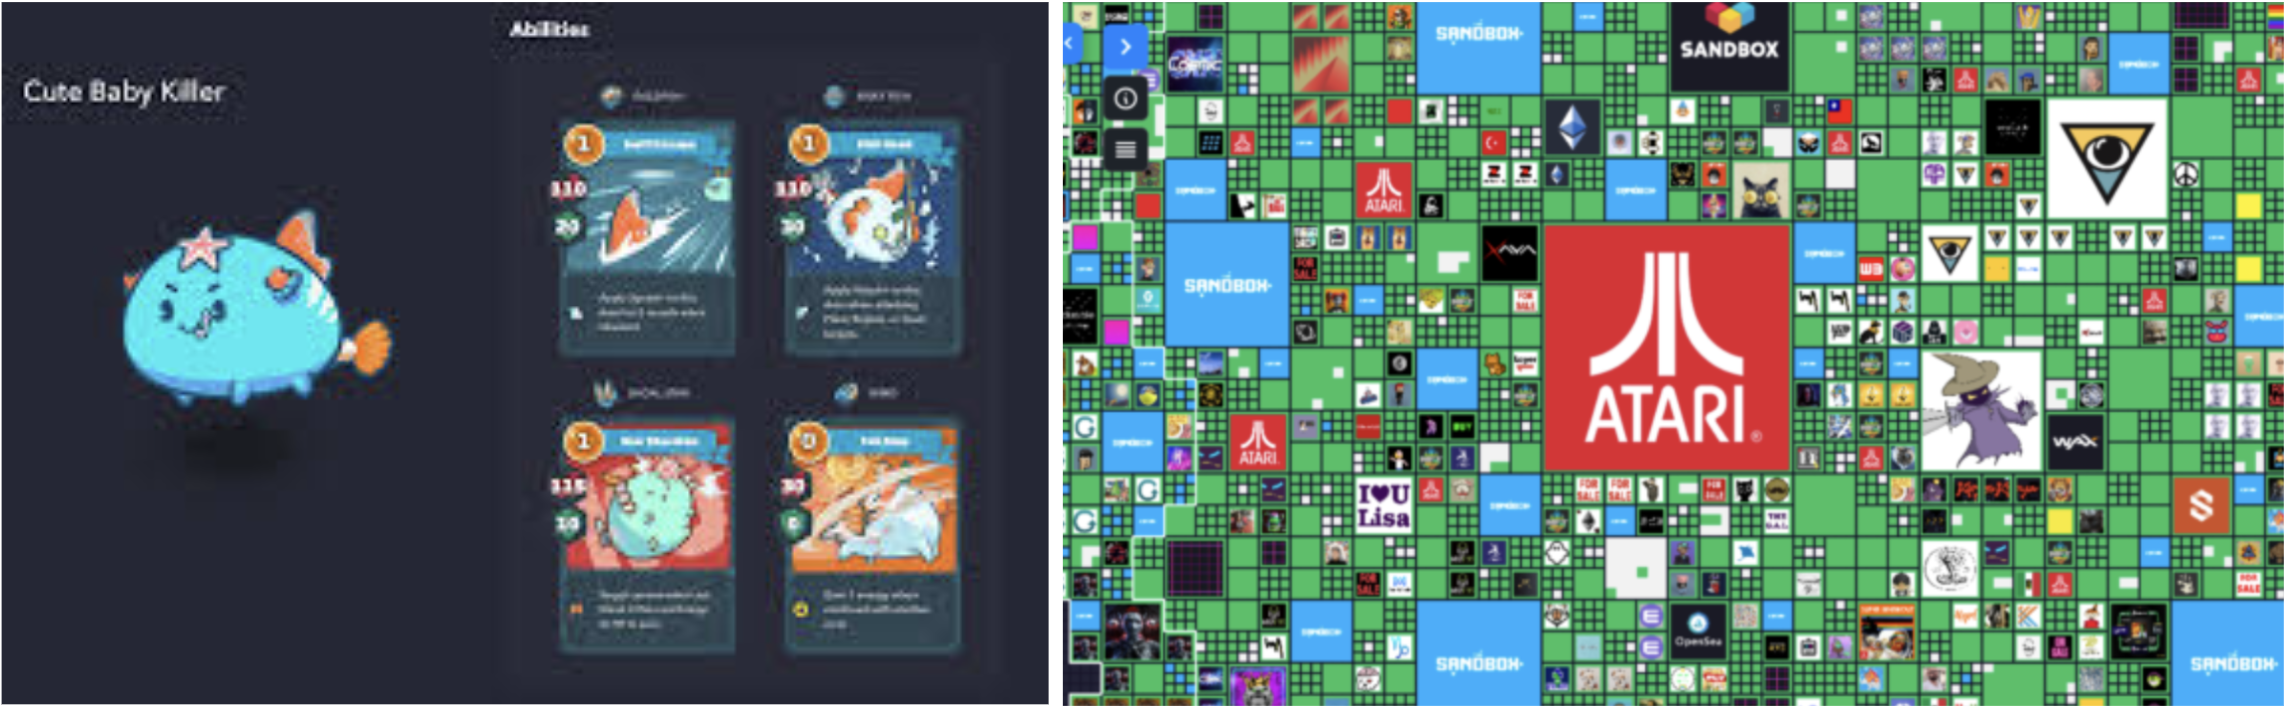
triggered huge public hype that contributed to the overall boom of the GameFi sector by integrating the metaverse and NFTs. An example of this is Axie Infinity and The Sandbox. Furthermore, continuing the hype around Defi and GameFi, the market then shifted its focus into other "x-to-earn", "xFi" concepts like SocialFi, StudyFi, SportFi, etc. Resulting in a rise in the market value of these projects and NFT trading volume in general.
Also, it's worth mentioning that the PFP blue-chip craze that took place in January was led by CryptoPunks and BAYC. The floor price of these projects maintained a bullish momentum and generated expectations for the rise of quality projects, which fueled the rising market sentiment. Hence, when Clone X, Azuki, and many other collections were launched in January, FOMO sentiment arose and set off the market boom.
Quantifying The Bull Vs The Bear Cycle
In the hype cycle, these collections were on steroids. It became the norm for people to buy and sell these blue-chip NFTs at sky-high prices. Many NFT projects reached All-Time Highs at the top of the hype cycle. But as the market sentiment turned around, these projects also started to decline in price.
To quantify the bull vs. bear sentiment of collections, let's consider Jan 1st, 2022 to Feb 15th, 2022 as the hype cycle of this year. This period was chosen to further analyze the spike in trading volume that we saw earlier.
We compare this period of hype and its impact on the different NFT projects to the current market sentiment. We choose the first half of May 2022- from May 1st to May 15th- to represent the current market sentiment.
During these cycles, we assess the price movements of NFT collections. However, slight movements are considered to be inconsequential in the market sentiment. Therefore, we consider the price movement to be a sign of change in market sentiment if, and only if, the average price of the collection has had an absolute change of 8% or above.
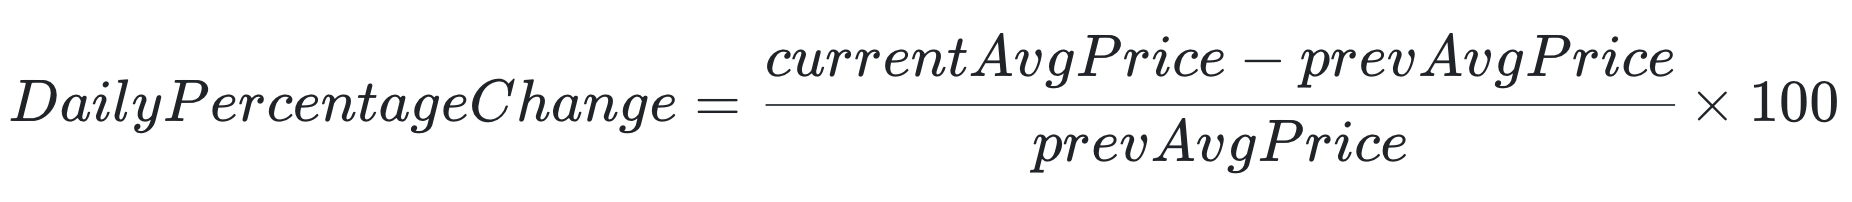
By analyzing the daily price change of each collection, we can categorize a day into one of these three categories:
- Price change of -8% or below: Down
- Price change of +8% or above: Up
- Price change in the range of -8% to +8%: Flat
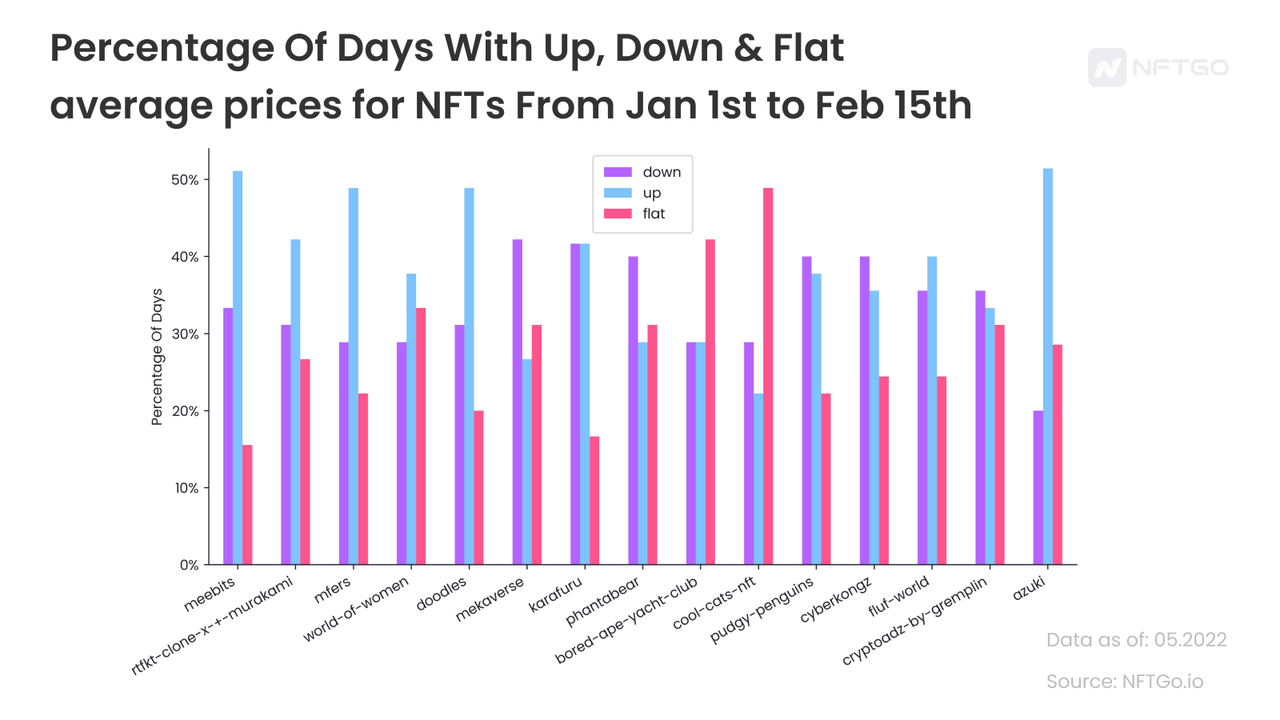
To examine the macro trends in the market, we have applied this analysis to two intervals. The first period represents the bull market for NFTs and the second period represents the current sentiment around NFTs. The chart below demonstrates the percentage of days with up, down, and flat average prices for 16 different NFT collections.
We can observe the trend of flat and average days over down days for most of the collections in the analysis. Some of the collections that started the year with plenty of hype attracted new whales and investors. The spike in demand for these projects created a significant trend of "up" days. These collections include Doodles, mfers, Azuki, and Meebits.
These were the beginnings of a year when everyone was coming out of NFT summer, and more investors were eager to buy blue-chip NFT collections. Despite the downturns in the crypto markets, NFTs continued their success. However, the sudden fall of the market seems to have impacted NFT collections as well. The chart below illustrates the same price movements analysis, this time, applied to today's market conditions.
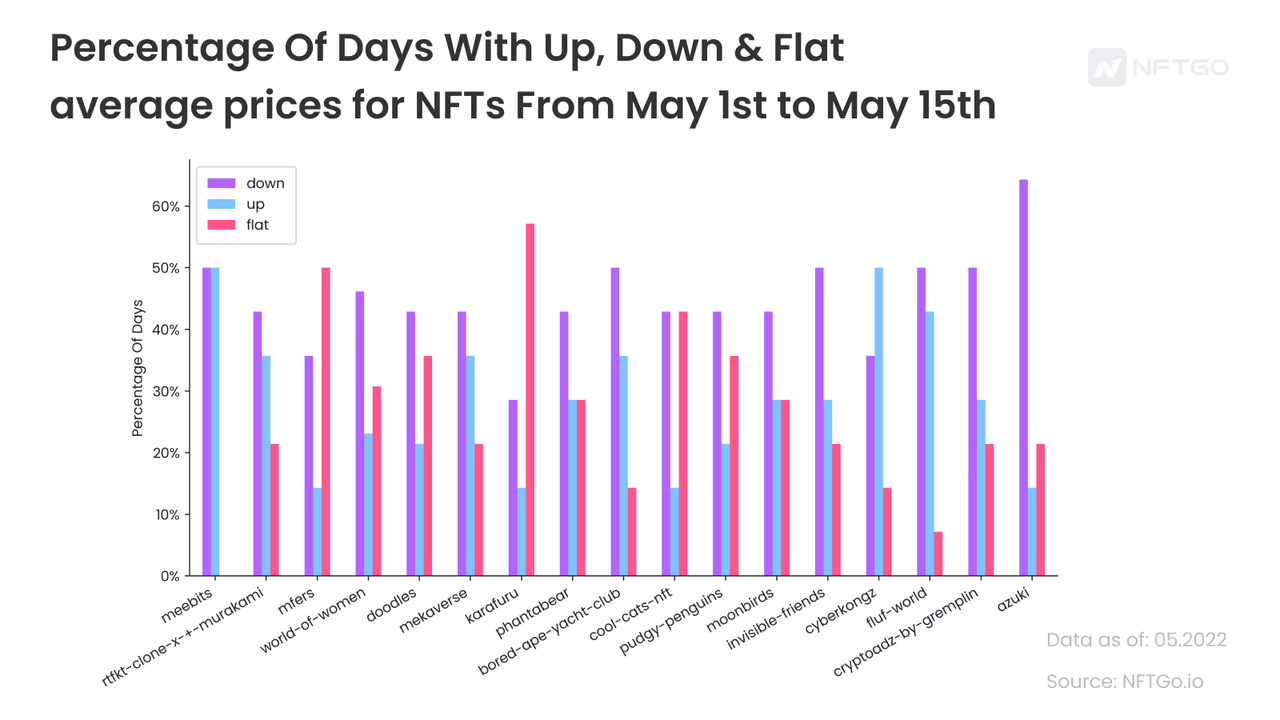
We can see that the tall blue (up) bars have started to fall shorter and shorter for NFT collections, while the flat and down days are rising. The purple bars represent the down days for these collections. In the majority of cases, the purple bars have surpassed the up days, suggesting a turnaround in market sentiment during the first two weeks of May 2022.
How Hype Affects the Price
Taking the impact of price into account, there are mainly three ways to hype up a project.
The first is through price. In April 2021, Hashmasks succeeded in bringing up the prices of its NFTs by using the bonding curve. The price of NFTs increased along with time, which ultimately made the last 3 avatars of Hashmasks traded at 100 ETH and successfully attracted the attention it demanded. Unfortunately, this FOMO-inducing approach was later abandoned by projects such as BAYC.
Followed by that is cooperative advertising. For instance, in the early days, BAYC collaborated with celebrities and let them use BAYC's avatars. This is the best way to attract attention in the early stages of the project.
The third is to empower NFTs at the middle stage of project development. By giving out benefits to community members, it generates hype. The airdrops of BAYC, Azuki, and other projects are great examples of this approach. It is undeniable that BAYC has obtained the greatest results out of all others. The project's airdrop of MAYC, ApeCoin, Otherside, and others have caused phenomenal effects.
The timeline below demonstrates the effects brought about by BAYC's adoption of the approaches above.
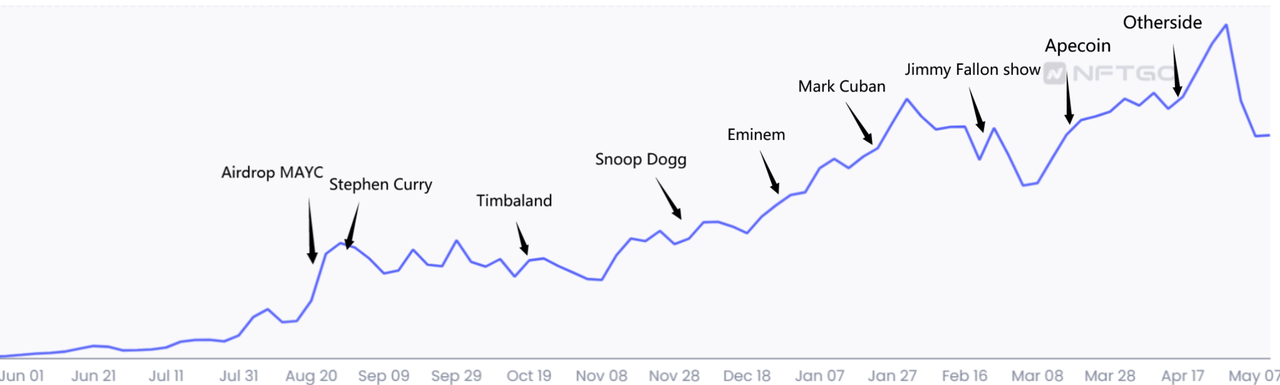
Major events:
2021
August, Bored Ape Yacht Club announced an airdrop of MAYC to holders.
August 31, NBA star Stephen Curry bought into BAYC.
On November 12, Timbaland launches a music label based on Bored Ape NFTs.
December 22, American rapper Snoop Dogg announced his BAYC purchase.
2022
On January 1, American rapper Eminem bought an avatar and joined the BAYC community.
On January 12, billionaire Mark Cuban mutated his Bored Ape.
On February 2, Jimmy Fallon announced on The Jimmy Fallon show his identity as a BAYC member.
On February 12, Black Rifle Coffee Company co-founder wore a Bored Ape shirt at the NYSE opening bell.
March, the native governance token ApeCoin was launched.
April, the multi-land metaverse Otherside was released.
Which Stage is the Market In?
The Life Cycle
From invention to application, the life cycle of new technology goes through several key stages in its early development:
Budding: Early proof-of-concept reports and media attention generate widespread publicity, but usually no usable products exist and commercial viability has not been proven.
Intensification of expectations: Early publicity yields successes that are usually accompanied by multiple failures. While some companies do act on it, most do not.
The burst of the bubble: As experimental projects fail one after another, people's interest waned. Most of the failed projects are abandoned and only the surviving ones improve their products so that the market will continue to invest.
Analyzing the characteristics of the NFT market nowadays, the market is now experiencing the "intensification of expectations" and "burst of the bubble" phases. Projects that have obtained success early on such as Yuga Labs, Axie Infinity, etc., have become the top projects in their respective tracks. Most of the other projects will be eliminated because they did not take the first opportunity and do not possess sufficient capabilities, which predetermines that only the fittest will survive. This could also be the reason for the bubble bursting period in 2016-2017 after the ICO wave when some poor quality projects were eliminated.
Compared to the Crypto Market
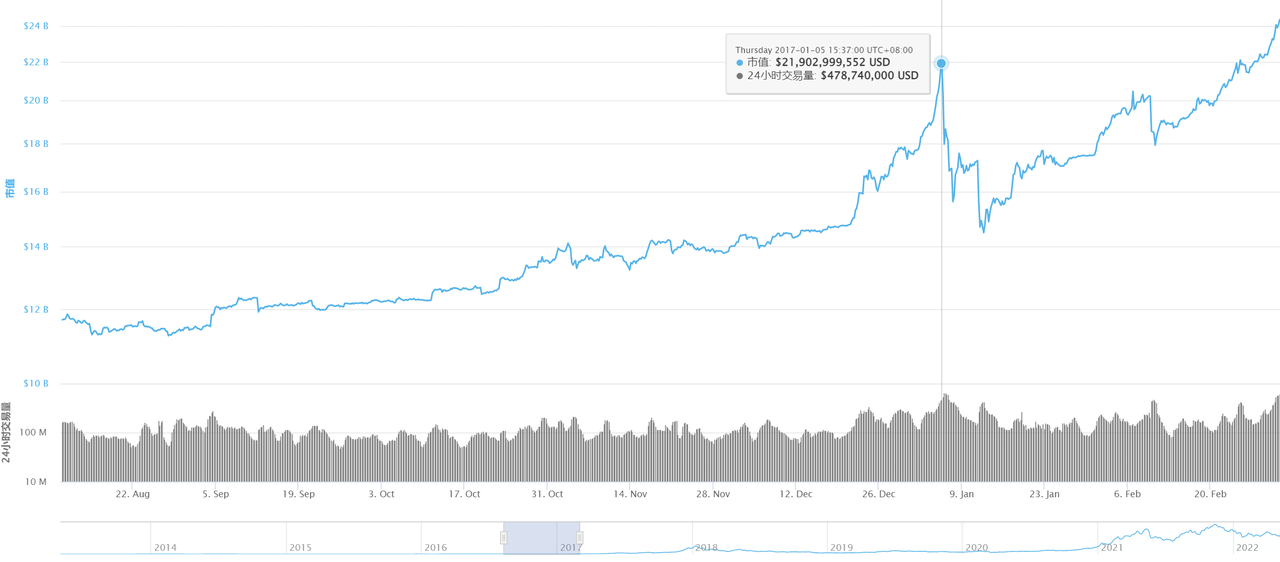
Roughly speaking, the current volume of the NFT market is approximately the same as the volume of the crypto market in 2017. Following the first reach of $20 trillion in total market cap in January 2017, the crypto market saw a swift downward trend where a quarter of its market cap vanished. After two months of recovery, a new bullish trend started. It is very likely for the NFT market to experience the same.
There are similarities and differences between the NFT market and the crypto market. At present, the NFT market is built based on the crypto market, so it is natural for it to be affected by the general market, though the response is usually more "sluggish". As can be seen from the figure below, as the market value of Ethereum continues to decline, the market value of the NFT market does not directly follow the decline.
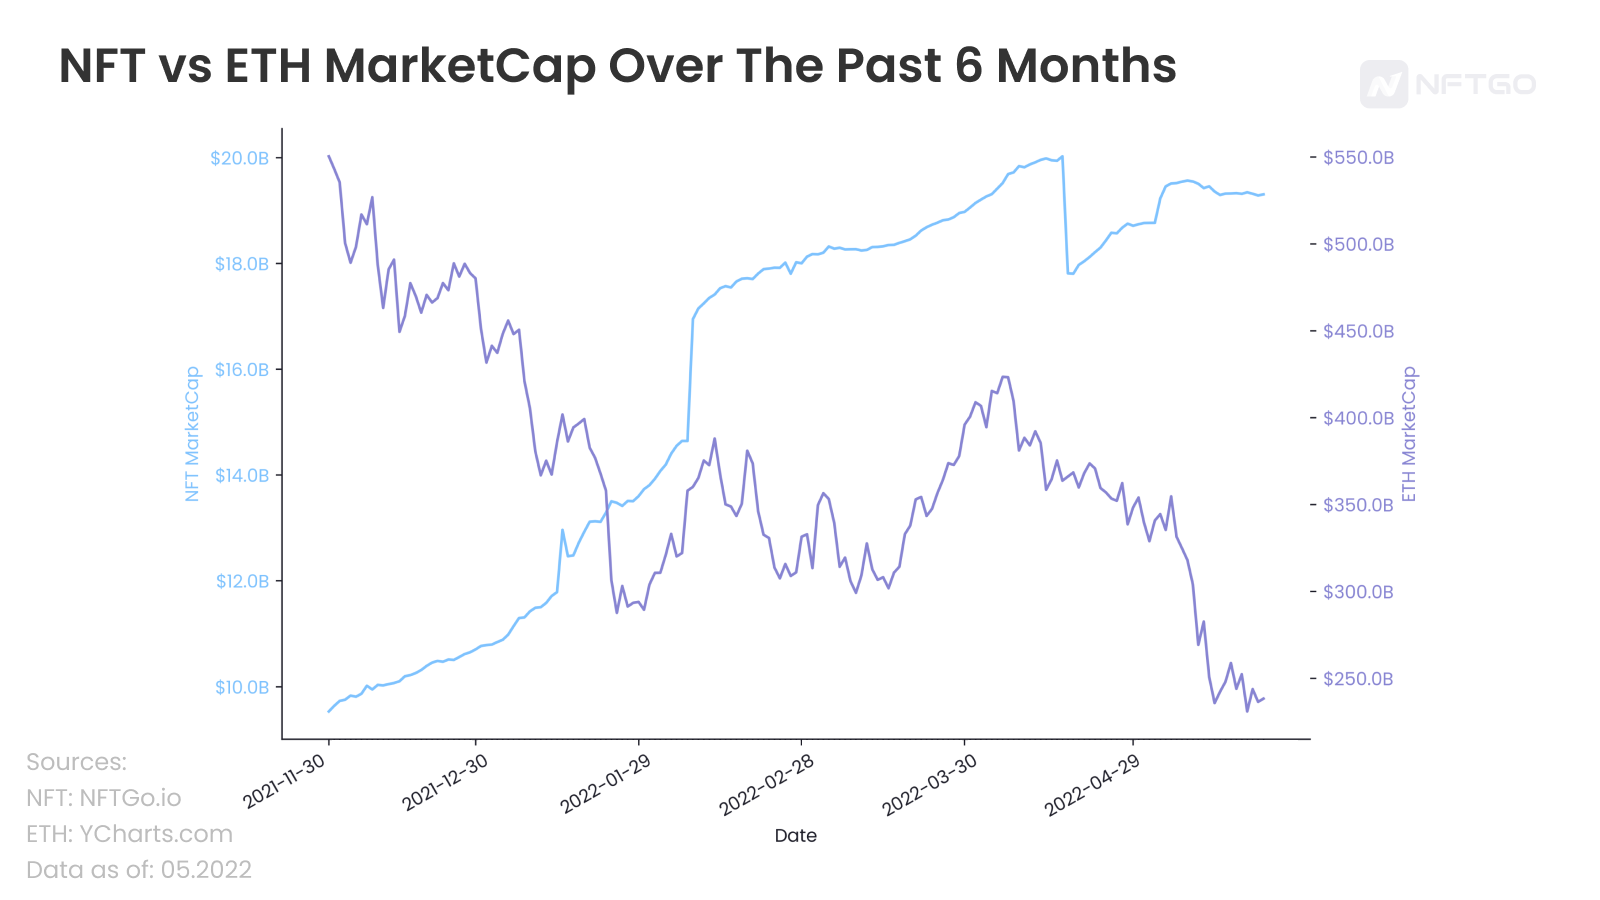
When the market is volatile, the NFT market tends to respond slower due to poor liquidity and network congestion. When the network is congested, gas fees spike and result in expensive transaction fees that hinder people from trading their assets. This is why we often see a drop in trading volume but not the floor price. Conversely, when the fluctuations are relatively small, the NFT market tends to perform better.
Conclusion
Market sentiment always comes and goes like waves. While it is possible to recognize the phase of the NFT market, the prospects and the ceiling of the market cap cannot be predicted.
The NFT market is still within the billion-dollar range, which means there is still plenty of room for market cap development compared to other tracks in the crypto market, such as the De-Fi. Just like how the crypto market went through different stages of hype, the bubble burst, survival, and applications to reach its trillion-dollar benchmark, early development stages often come with hype bubbles, but a legendary upsurge will follow. Therefore, the rule of thumb when facing emerging technologies is to be aware but also remain confident in innovations. This way you will always stay up to date with the latest trends.