TL;DR:
We empirically evaluate the profitability of liquidity providers (LPs) in Uniswap v3’s ETH–USDC 5 bps (0.05% fee tier) pool on Ethereum. First, we introduce “LP Share Markout” as a metric to calculate each LP’s PnL. We then analyze LP win rates and profit distributions over the four years since Uniswap v3 launched, from 2021 to 2025. Next, we identify traits of the most profitable LPs and explain their specific strategies. Finally, we examine how LP’s price ranges and active provision times relate to profitability.
Introduction
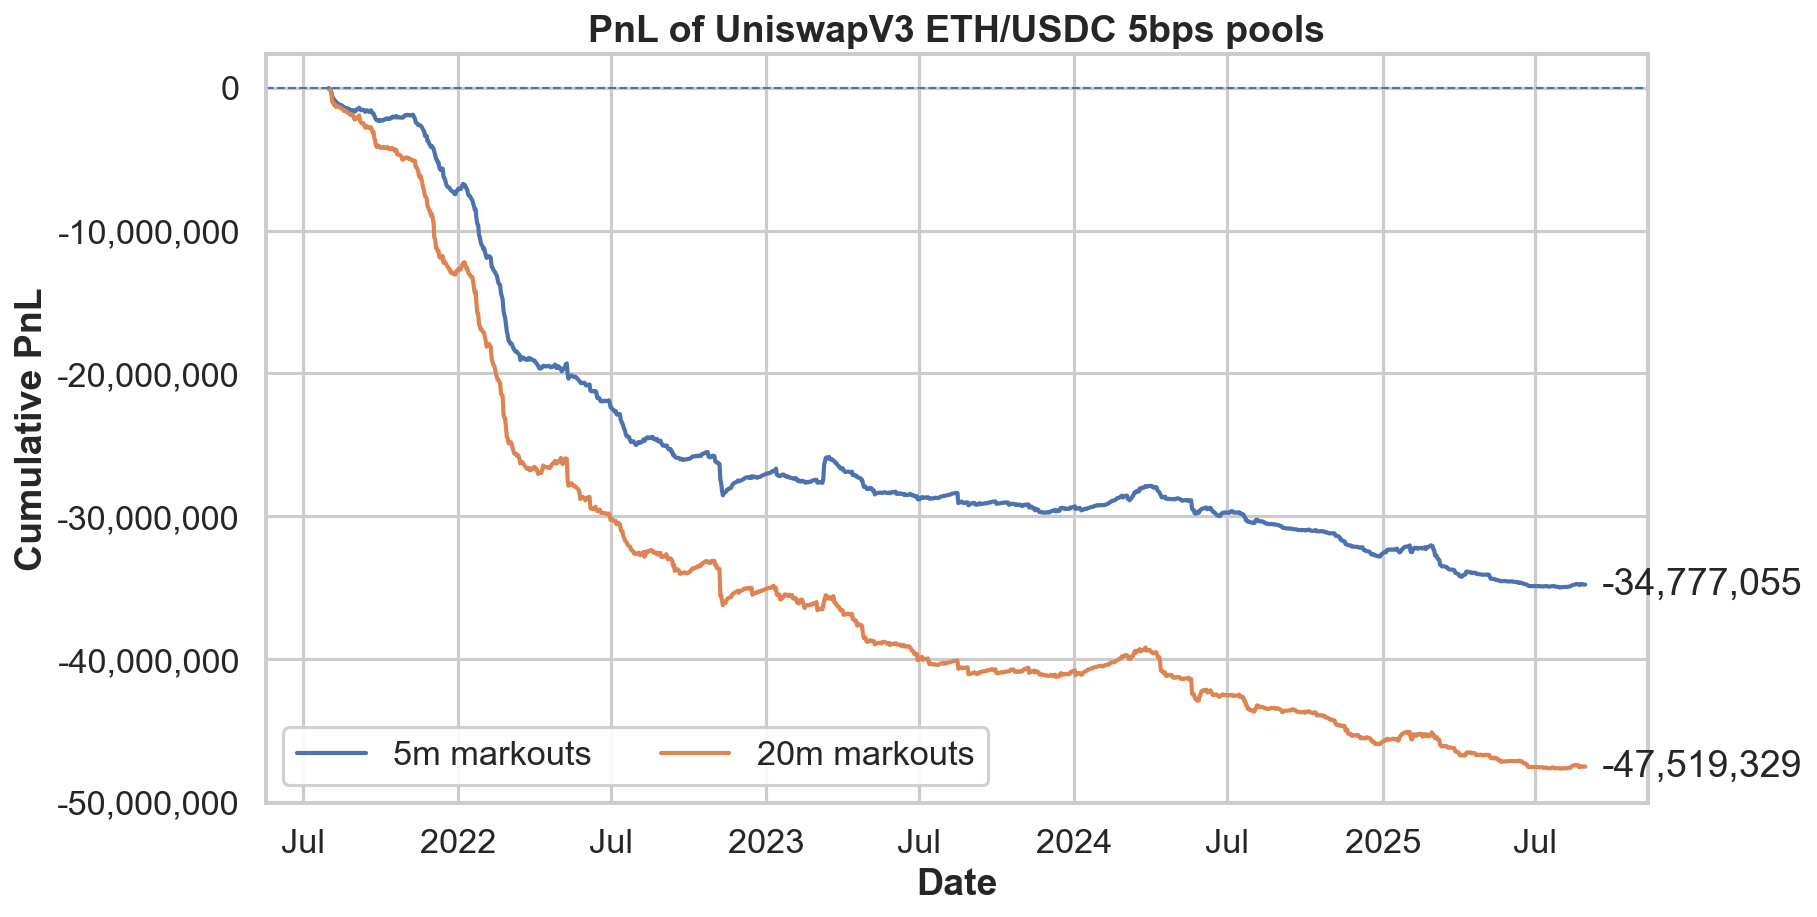
While liquidity provision on decentralized exchanges is a representative DeFi investment strategy alongside lending and staking, it is notably more complicated. Although lending and staking have liquidation risks and slashing risks respectively, they are fundamentally simple operations involving asset deposits. However, since the emergence of concentrated liquidity provision exemplified by Uniswap V3, it has become necessary to specify price ranges and adjust provision timing. Furthermore, following the launch of Uniswap v4, attention must be paid to the specific behavior of Hooks as well. Simultaneously, research on the revenue structure of liquidity providers (LPs) has advanced, with Milionis et al. (2024) and Nezlobin & Tassy (2025) theoretically demonstrating LVR estimation considering liquidity pool fees or in certain block generation time. Empirical analysis includes work by Fritsch & Canidio (2024). What these studies have revealed is the difficulty faced by liquidity providers. For instance, liquidity pool analysis using markout suggests that LPs may have incurred cumulative losses exceeding $30 million in Uniswap v3's ETH-USDC 5 bps pool during the period from August 2021 to August 2025.
However, as a fundamental premise, measuring LP profitability is extremely difficult. This is because what constitutes "profit from liquidity provision" is ambiguous. For example, consider providing liquidity in the $3,000-4,000 range for an ETH/USDC pool on Uniswap v4, followed by ETH price movements to $2,500 or $4,500. While an increase in portfolio value could be evaluated as "profitable," from a market-making perspective, such gains stem from directional price movements, making it debatable whether they should strictly be considered "profits from liquidity provision." Nevertheless, what most users want to know is whether they ultimately achieved positive returns in USD terms, or in BTC/ETH terms, with the source of returns—whether from market making or underlying asset appreciation—often being of secondary concern.
LP Share Markout Definition and the Reality of Liquidity Provision
The definition of LP share markout :
This article defines "LP Share Markout" to compare the profit and loss (PnL) of all liquidity providers on a consistent basis. LP Share Markout is calculated by weighting the markout generated from each swap transaction by the respective LP's liquidity share at each tick through which the transaction passes, then aggregating across all transactions. Unlike conventional markout definitions (which measure at the pool level), this metric apportions markout by tick-level share, enabling the calculation of individual LP-based PnL from all swap transactions. The detailed definition is provided below.
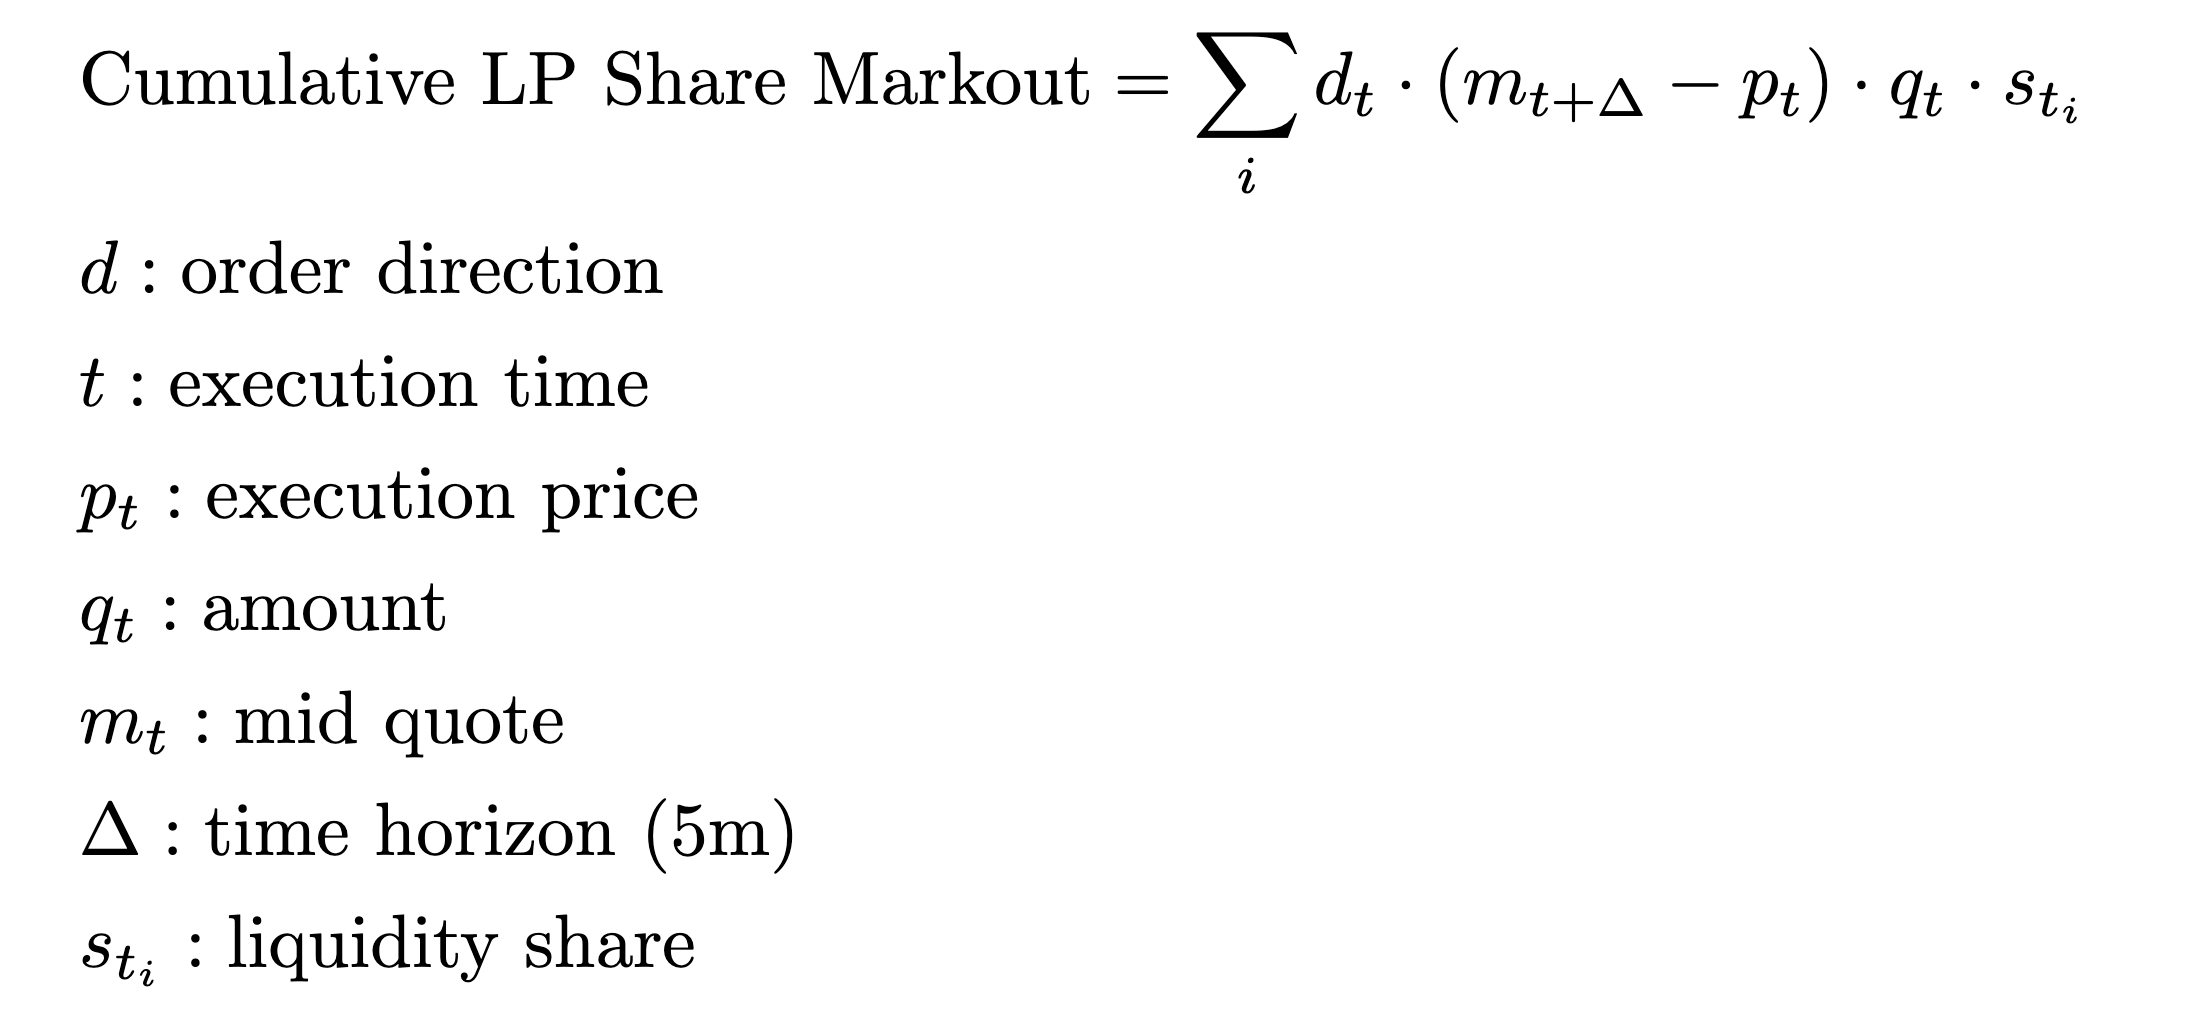
An important caveat about this definition is that this metric represents a hypothetical PnL based on the assumption of "liquidating positions 5 minutes after execution." In practice, LPs do not uniformly liquidate after 5 minutes, and this assumption may not necessarily be realistic.
Liquidity Providers’ Win Rates and Distribution :
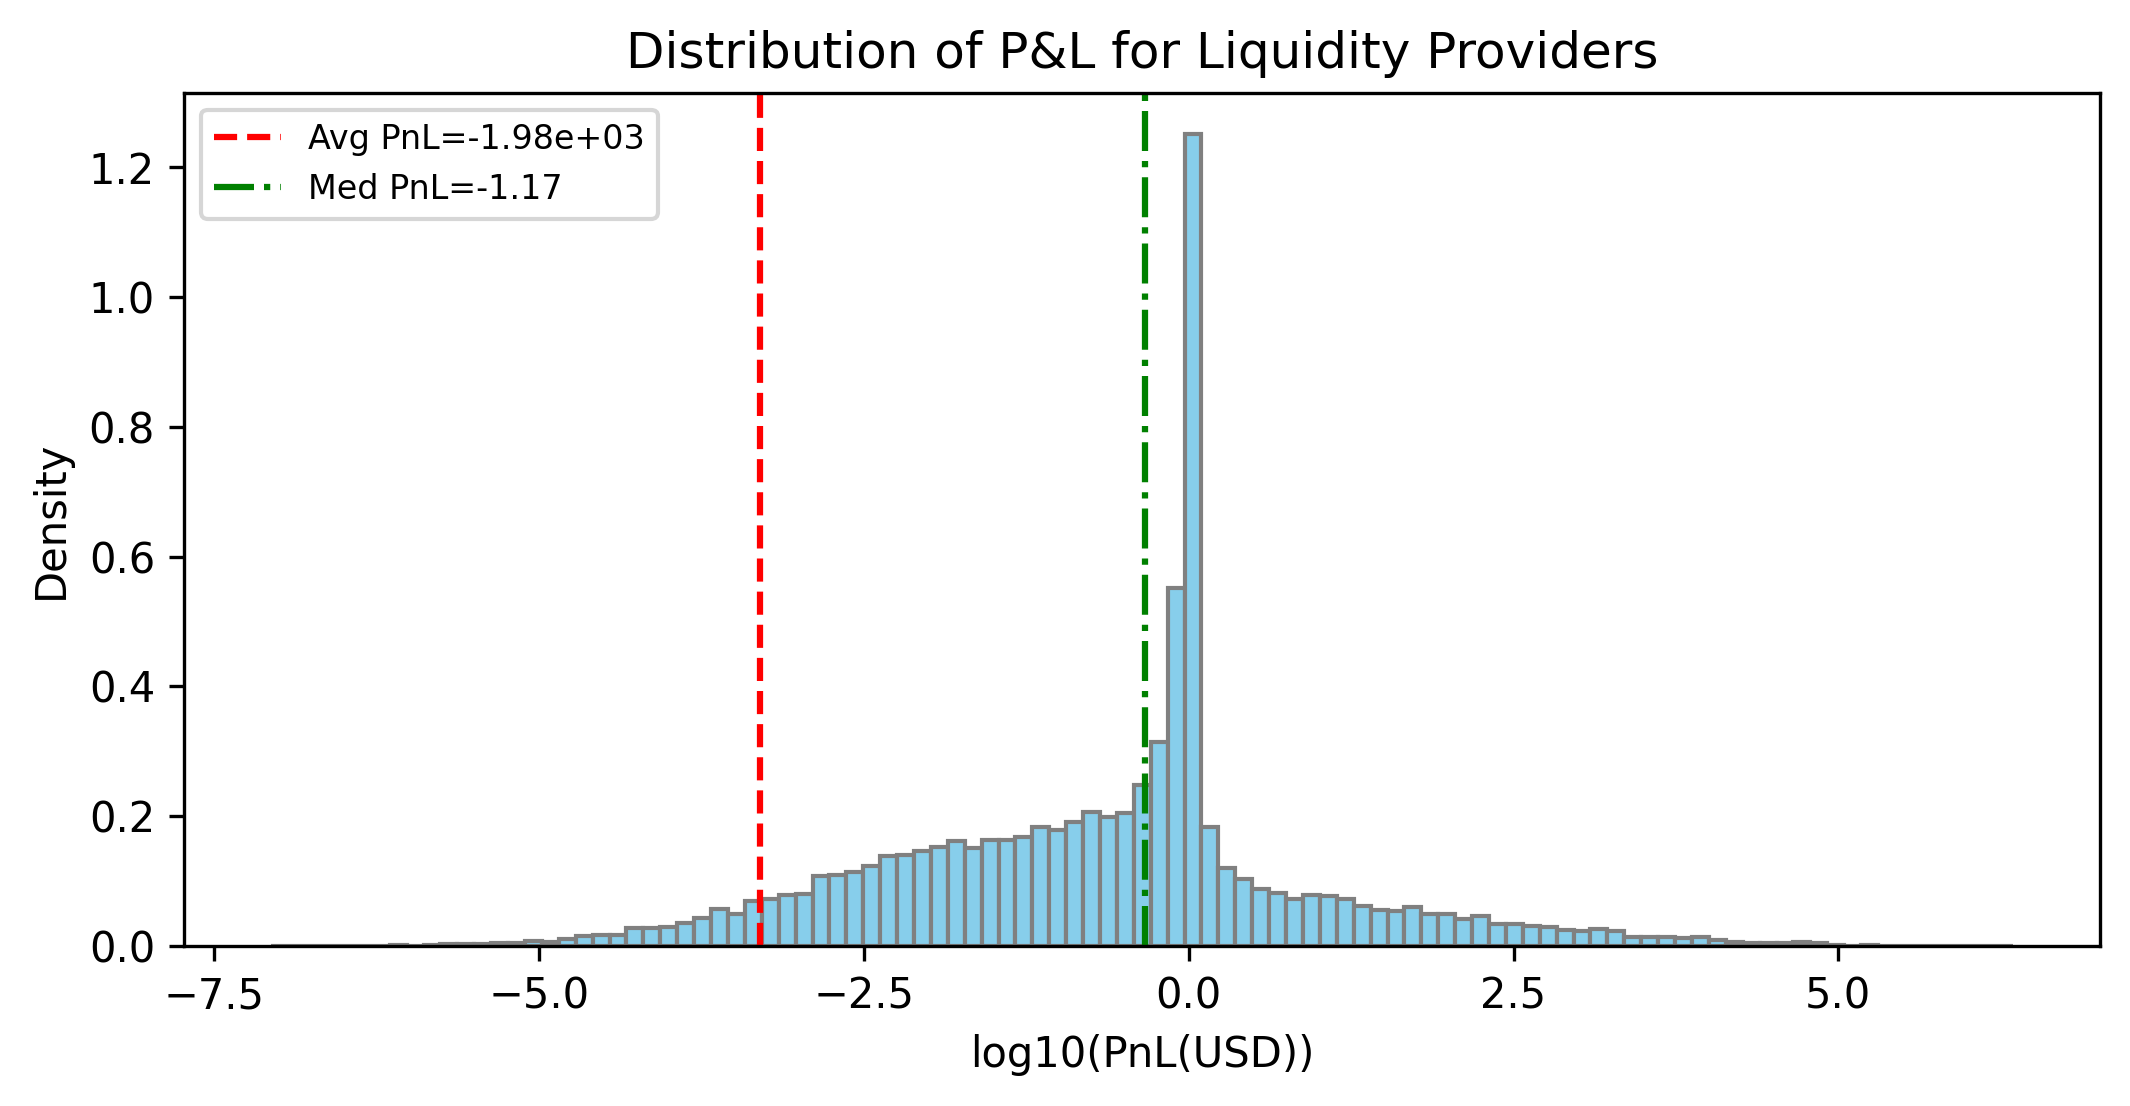
The above distribution represents analysis results based on the previously defined LP Share Markout. Among users who provided liquidity of $1 or more over the past four years, only 28% had positive cumulative PnL, approximately 10% of liquidity providers exceeded $10, and only about 5% surpassed $100. While PnL itself is proportional to the amount of liquidity provided, this suggests the difficulty of consistently generating profits through liquidity provision. Both the mean and median values are negative, indicating that the vast majority of liquidity providers have not achieved positive returns. Therefore, if you are an "average" liquidity provider who engages in liquidity provision without a specific strategy, you would likely make losses.
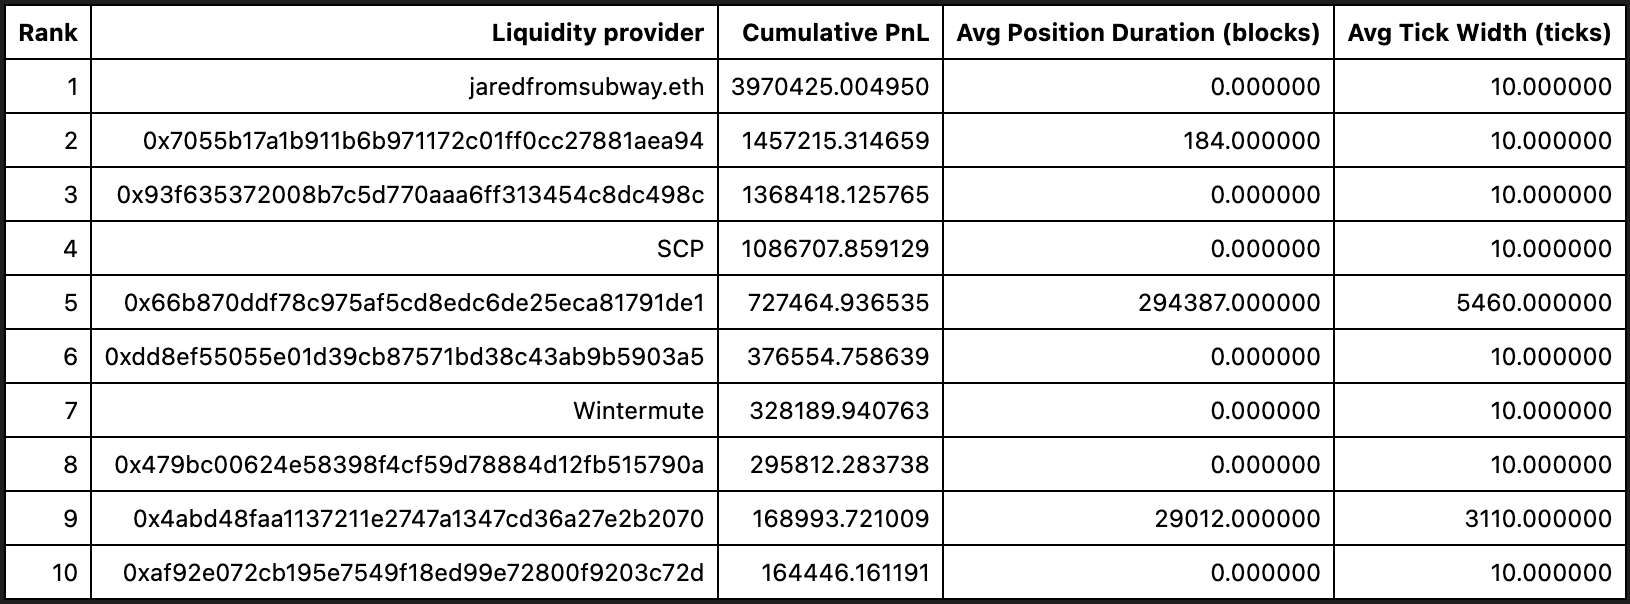
However, while many articles and posts often state that "LPs lose money," The reality is more complex. Looking at the top 10 addresses by cumulative PnL, the largest profits were earned by the prominent MEV arbitrageur jaredfromsubway.eth, with professional market makers like SCP and Wintermute also appearing on the list. They are generating enormous profits while many liquidity providers are incurring losses. What's noteworthy is the position duration and tick width of these top LPs. Many liquidity providers add and remove liquidity within "0 blocks" (adding and withdrawing within the same block), with tick widths fixed at "10 ticks." Since the tickSpacing for Uniswap v3's ETH-USDC 5bps pool is 10, 10 ticks represents the minimum provision width.
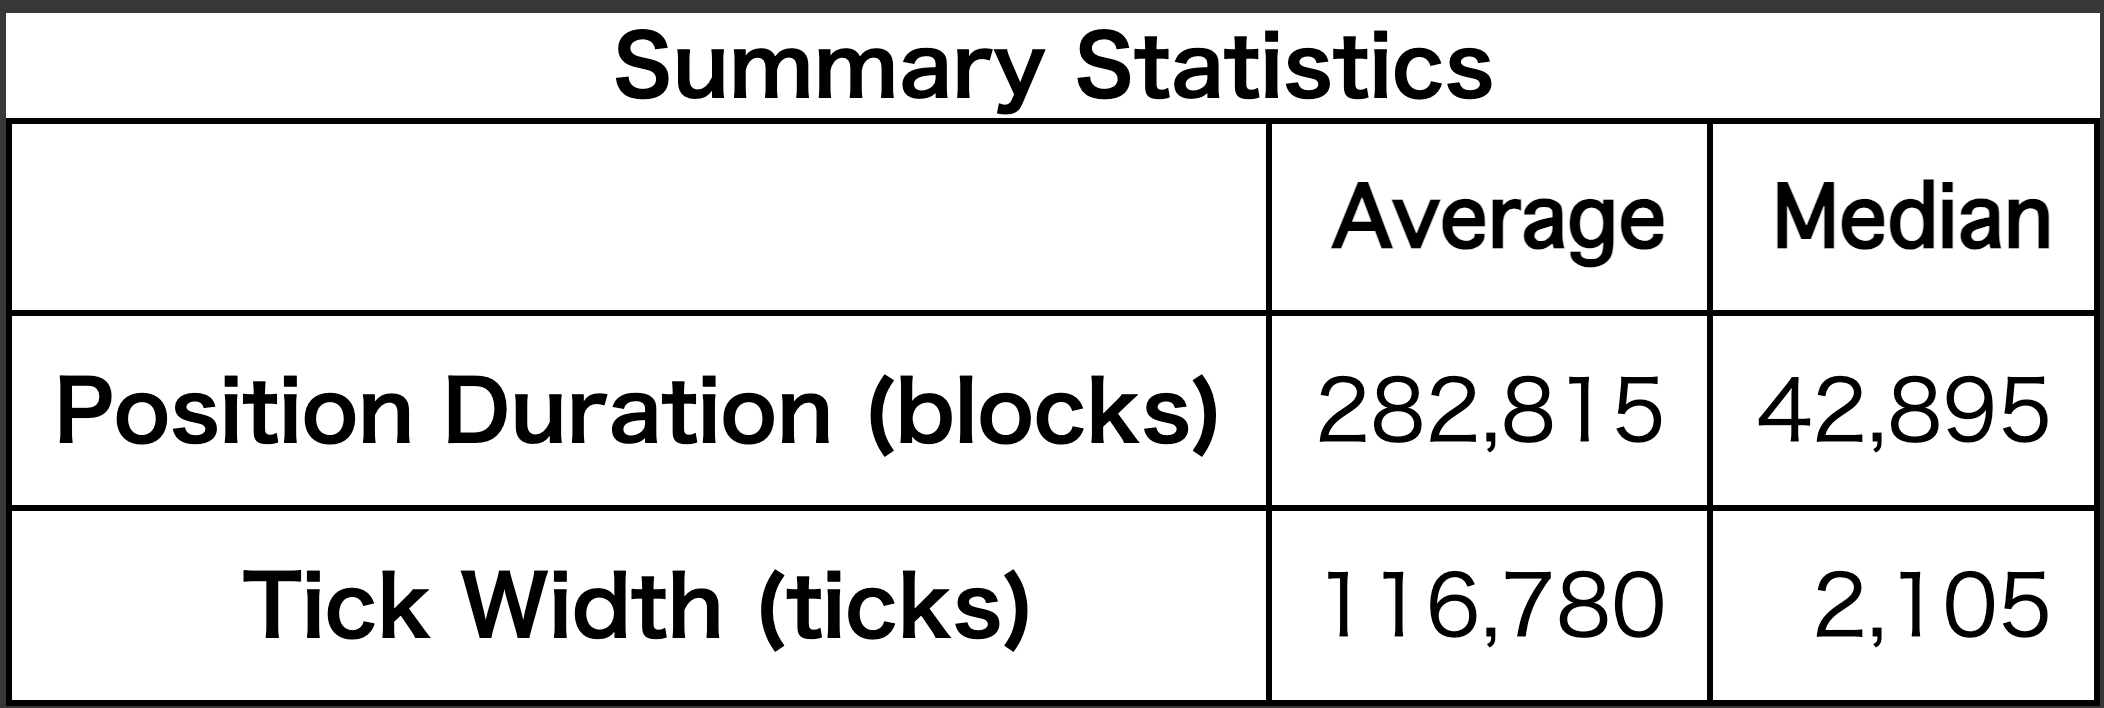
On the other hand, let's examine the overall statistics for liquidity provision. This data shows an average of 282,815 blocks / median of 42,895 blocks and an average of 116,780 ticks / median of 2,105 ticks, which is much longer and wider compared to the top performers. While it's important to note that averages are heavily influenced by outliers, the overall picture shows that many liquidity providers offer liquidity for long periods and wide ranges, but the highest earners are LPs that operate with ultra-short-term, extremely narrow ranges.
This behavior is called Just-in-Time Liquidity (JIT). It's a technique where liquidity is inserted into an extremely narrow range just before a trade is executed, capturing the generated fees within the same block and immediately withdrawing. The detailed mechanisms and examples of JIT will be covered in the next section.
Liquidity Management Protocol Performance Analysis :
So what about projects specialized in liquidity provision? This graph shows the cumulative PnL of major liquidity management protocols (Arrakis Finance / Gamma Strategies) on Uniswap v3 (ETH/USDC 5bps).
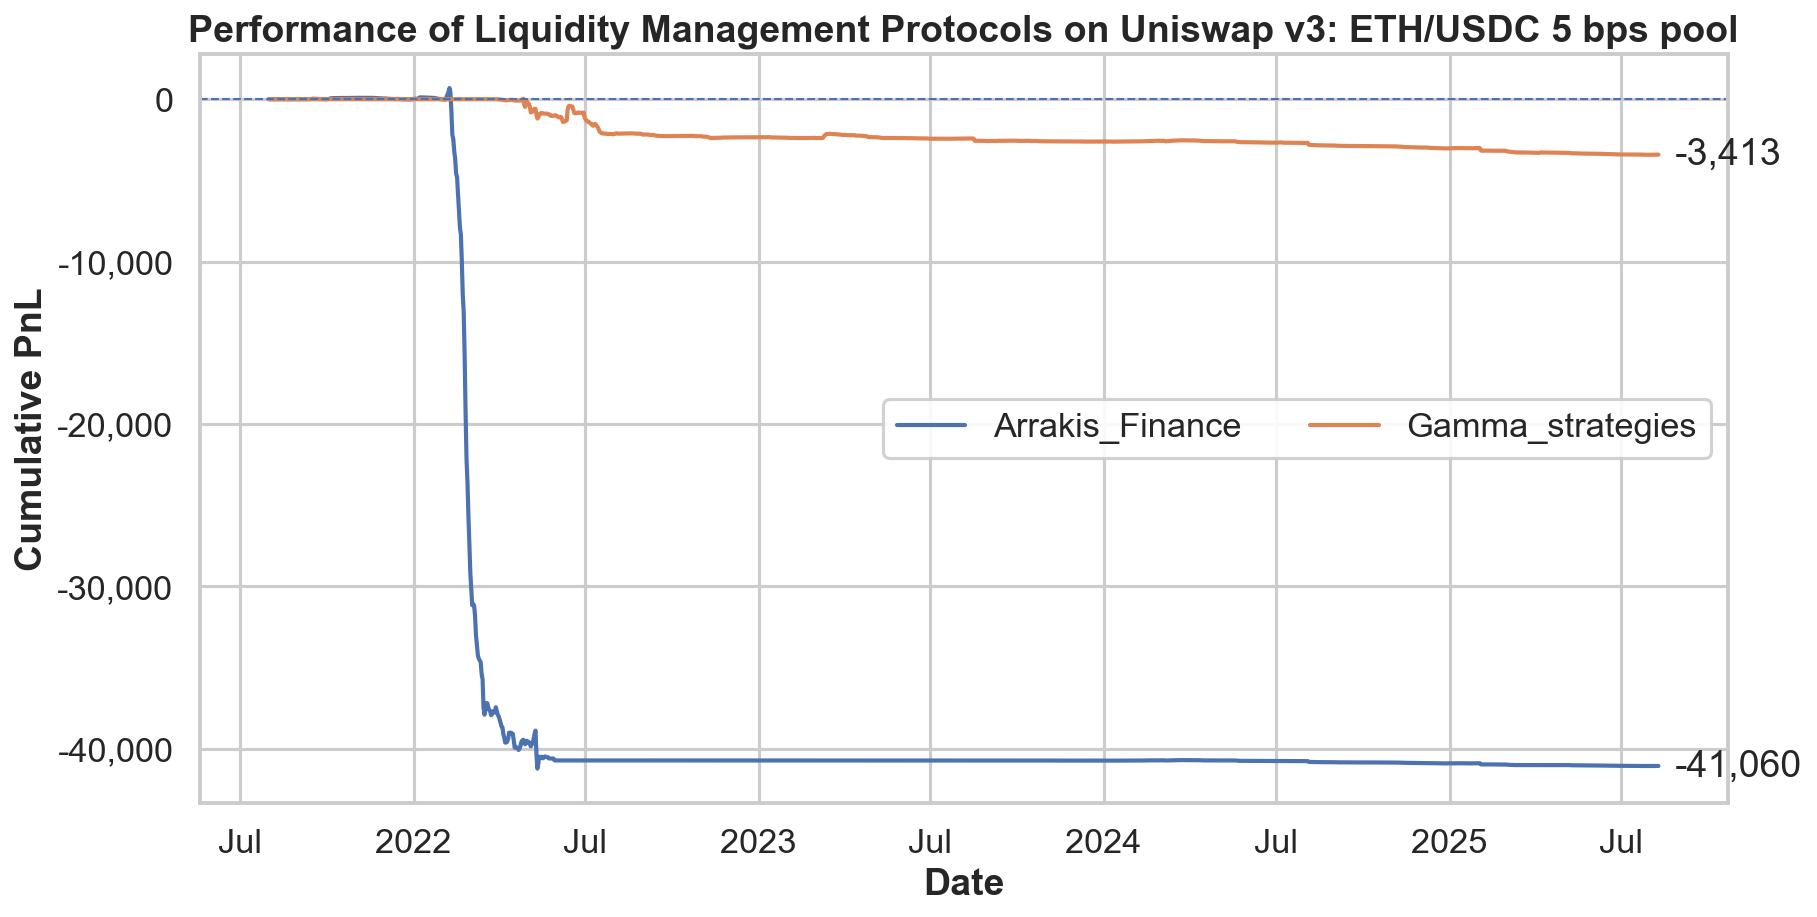
Both protocols show negative markout, reflecting overall challenging performance. However, since the figures in the chart are not normalized by provided liquidity, Arrakis appears to have larger losses on the surface compared to Gamma, but markout is roughly proportional to the amount of liquidity deployed. Therefore, it would be incorrect to conclude from this graph alone that "Arrakis significantly underperforms Gamma."
What is Just-in-Time Liquidity?
As mentioned above, major market makers and some MEV arbitrageurs are generating enormous profits through liquidity provision. This chapter aims to provide a clear explanation of their JIT strategies.
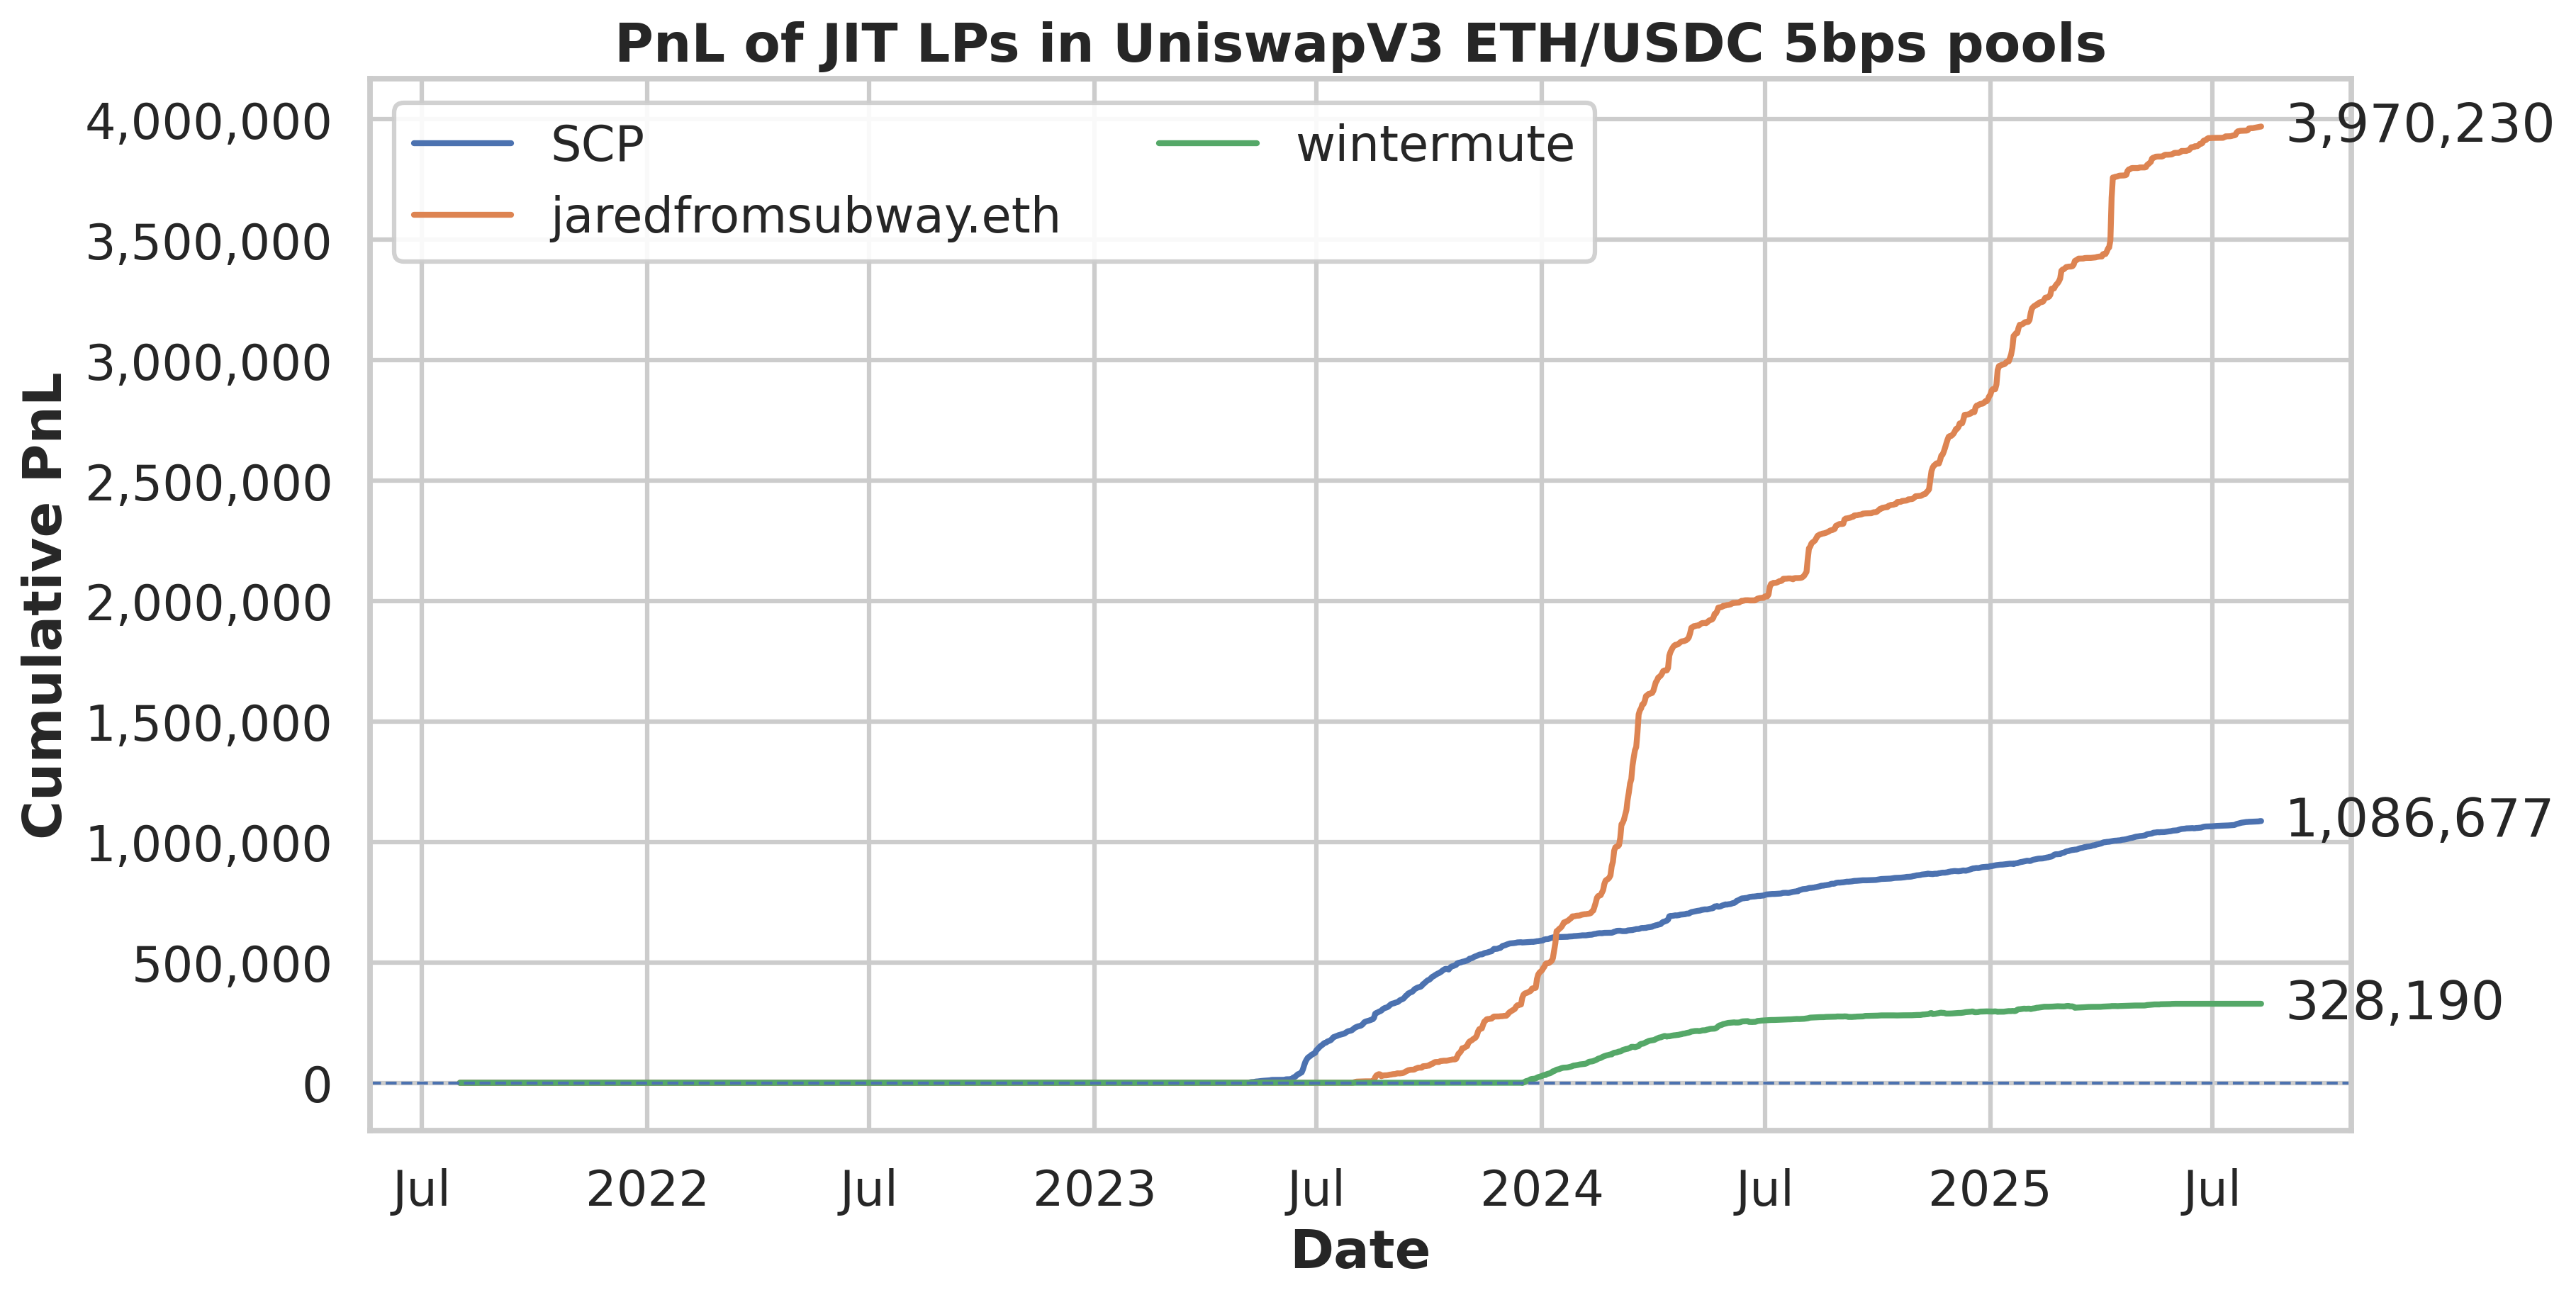
We'll focus on Jaredfromsubway, whose cumulative PnL stands out even when compared to prominent market makers. Throughout the observation period, there have been virtually no significant drawdowns, with PnL steadily accumulating. So, he is a representative liquidity provider (LP) practicing JIT (Just-In-Time) strategies.
JIT is a type of MEV strategy, alongside sandwich attacks and CEX-DEX arbitrage. It involves injecting large amounts of liquidity into extremely narrow tick ranges for a very brief period just before a swap is executed, then withdrawing immediately after execution. This allows them to capture the majority of fees generated from that swap. In practice, JIT LPs monitor the mempool and instantaneously provide liquidity in response to retail orders that promise sufficient fees.
First, let's briefly explain how normal swap transactions behave.
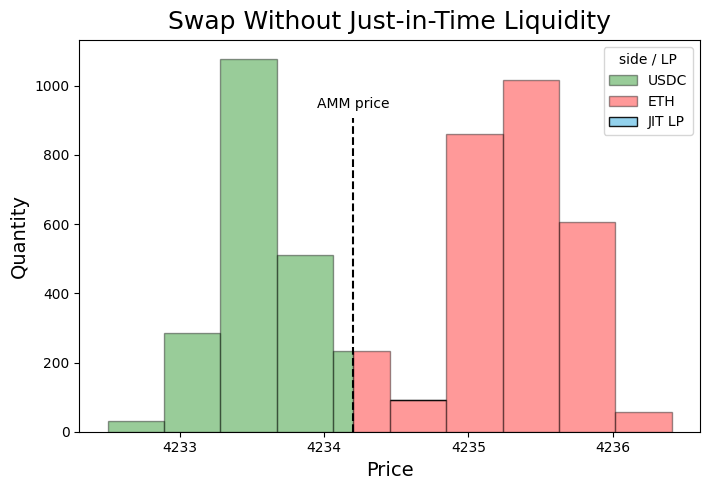
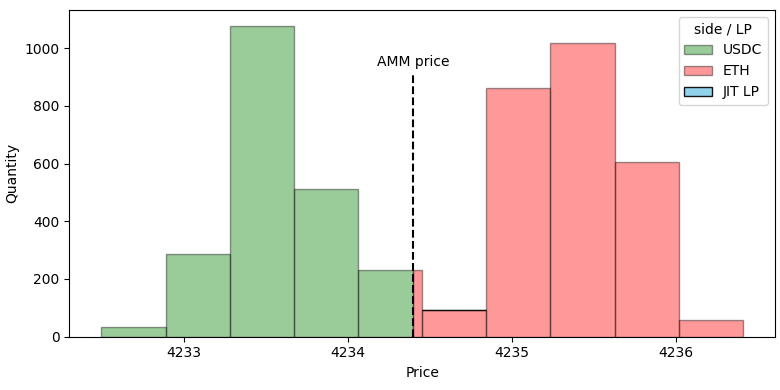
For example, suppose the on-chain price of ETH/USDC is 4,234.2 USDC.
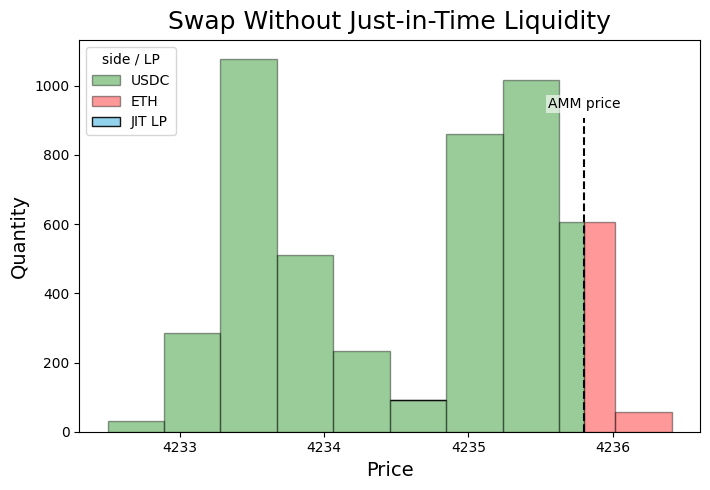
When a buy order comes in, the AMM price is pushed up due to price impact, reaching, for instance, 4,235.8 USDC.
JIT Trading
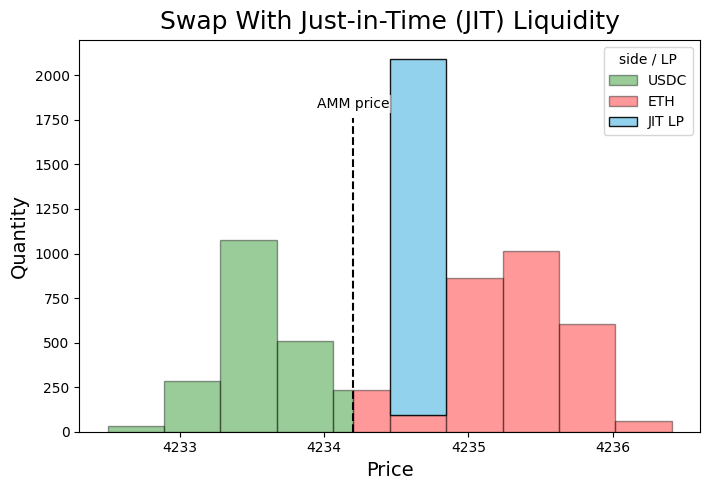
In JIT, thick liquidity is temporarily provided to the blue ticks (extremely narrow range) shown in the figure.
Fees are efficiently collected the moment a swap passes through that range, and the position is closed immediately afterward. As a result, the JIT LP is likely to capture the majority of the fees generated from that swap.
Now, let's examine actual transactions.
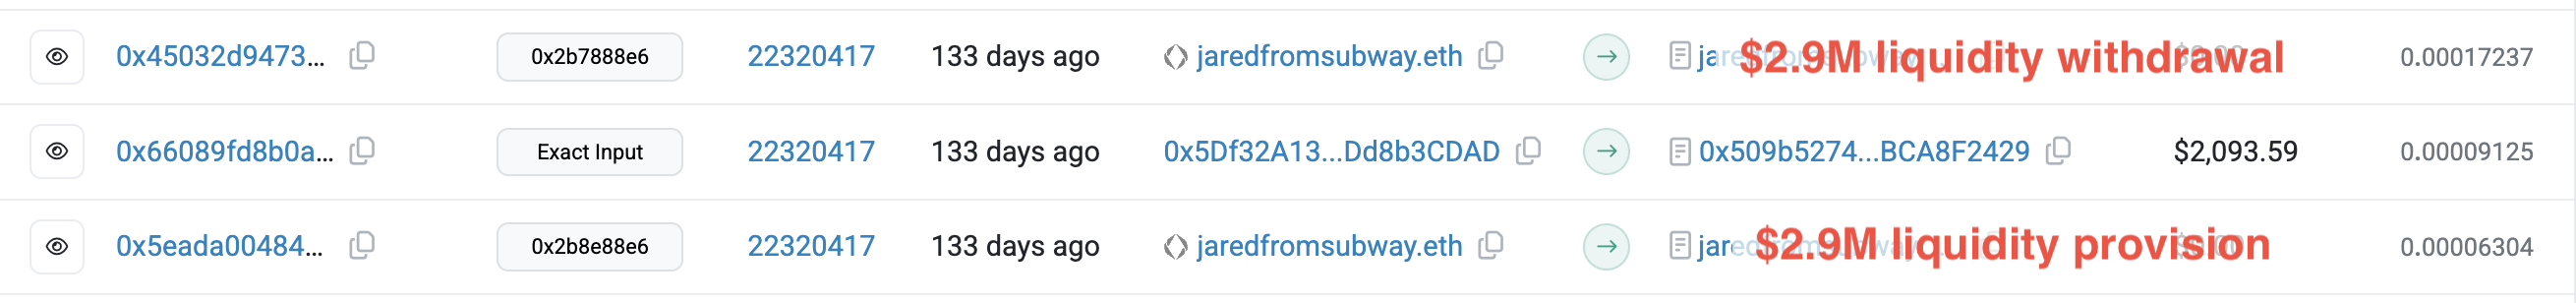
In this example, Jaredfromsubway instantaneously provided approximately $2.8 million in liquidity to a single tick. The liquidity that had been provided to tick range 202,680–202,690 up until that point was only $123,303, representing an increase of over 20 times. As a result, existing LPs' share dropped to approximately 4%. When Jaredfromsubway executes JIT, they typically secure liquidity tick shares of around 80-90% on average, significantly impacting the fees allocated to existing LPs.
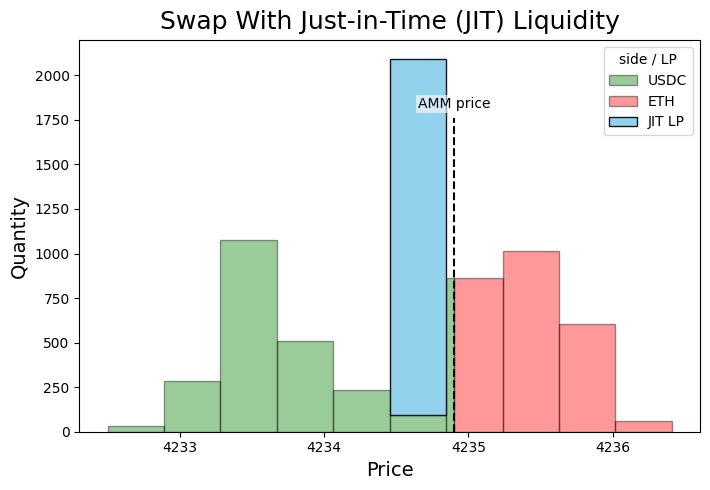
Indeed, JIT LPs can instantaneously serve as counterparts for large swaps. For example, while a swap might move the price to 4,235.8 USDC without JIT intervention, it may only reach 4,234.8 USDC when JIT occurs. This results from the thick liquidity supplied by JIT, which reduces price impact and leads to lower trading costs for traders. Therefore, it can be said to be beneficial from a cost reduction perspective in the short term, but the long-term effects remain unclear and continue to be debated.
Analysis of the Relationship Between Liquidity Provision, Provision Duration, and Price Ranges
Finally, we analyzed the relationship between cumulative PnL from liquidity provision and the duration and price ranges chosen by users. To focus on the behavior of typical liquidity providers, we excluded the top 1% and bottom 1% of cumulative PnL as outliers to remove providers potentially employing specialized strategies like JIT LPs, and visualized the results in scatter plots.
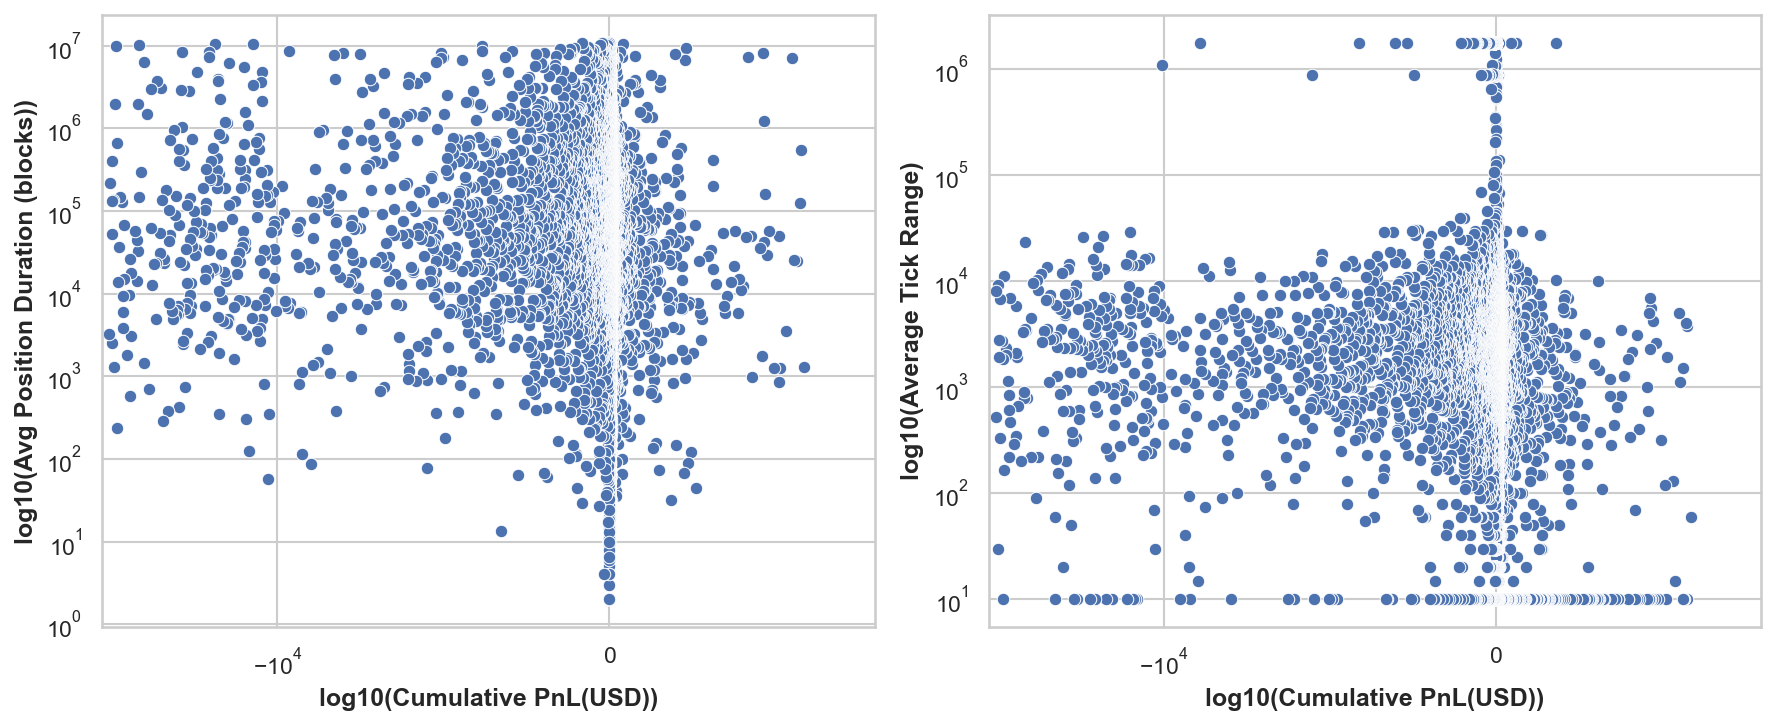
Plotting cumulative PnL on the x-axis and holding periods and provision ranges on the y-axis, we found no consistent correlation or stable relationship between holding periods, provision ranges, and cumulative returns, excluding Just-in-Time (JIT) providers and those supplying liquidity for very short periods. This is consistent with theoretical expectations—assuming underlying asset prices follow geometric Brownian motion (GBM), the impact of range settings themselves on returns can be interpreted as relatively small. However, real-world prices do not necessarily follow GBM, and there exist entities that provide liquidity by predicting volatility and other factors to generate profits. Therefore, depending on specific strategies, adjusting holding periods and provision ranges is not necessarily meaningless.
Appendix
What is fundamentally important in market making are two points: 1. how to increase the number of retail orders that can be executed, and 2. how to respond to informed flow. For the former, using JIT (Just-In-Time) is considered the most rational approach. However, first, individual LPs (liquidity providers) have limited capacity to increase the absolute number of retail orders themselves. Second, avoiding informed flow is not easy for general users, especially given the current market structure—particularly on Ethereum.
Generally, price discovery occurs first on CEXs, with DEXs following suit, resulting in CEX-DEX arbitrage. This is a type of informed flow. The question is whether one can withdraw their liquidity before arbitrageurs do, but in reality, it is the arbitrageurs, or entities close to them, who determine the transaction order within blocks. In CEX-DEX arbitrage, they profit by exchanging as much LP liquidity as possible for the counterpart token, so they have no incentive to prioritize LPs' cancellation transactions.
Conclusion
This article introduces "LP Share Markout," a metric that enables consistent comparison of LP profitability on a per-LP basis in Uniswap v3's ETH-USDC (5bps) pool, and conducts an empirical analysis across the entire period from 2021 to 2025. The key findings are as follows:
-
The average LP loses money: Among LPs who provided $1 or more, only approximately 28% achieved positive cumulative PnL, with both mean and median returns being negative. "Average" LPs without sufficient strategy or implementation likely face negative expected returns.
-
Winners are concentrated among a select few, primarily using JIT strategies: Top performers in cumulative PnL include jaredfromsubway.eth, SCP, and Wintermute, who employ Just-in-Time (JIT) strategies as their core approach—minimum-width positions within the same block. They inject thick liquidity immediately before individual swaps, capturing the majority of generated fees. While this provides short-term benefits through reduced price impact, the long-term welfare effects remain unclear.
-
No general relationship found for price ranges or holding periods: Excluding outliers (top and bottom 1%), no stable correlation was observed between holding period, provided range, and cumulative PnL. Exposure to informed flow and the "approach" to capturing retail flow have a stronger influence on profitability.
-
Management protocols also struggle: Arrakis/Gamma markouts are generally negative (without normalization by liquidity size). While superiority cannot be determined solely by apparent magnitude, this suggests that passive, wide-range strategies face headwinds.
Overall, LP profits in Uniswap v3 tend to concentrate among a small number of participants with advanced execution capabilities. Fine-tuning range design or holding periods alone is unlikely to turn expected returns positive, and LPs without informational and execution advantages are structurally disadvantaged.