
This article is aimed at the audience that has already participated in the Numerai competition or prepares for it. In two words, Numerai gives you an opportunity to generate signals for weekly asset movements, stake cryptocurrency, and earn rewards based on your performance. You can get their encrypted data and focus only on ML models or you can get your own data for the predefined universe, generate your own features, and train ML models over it. We will cover the second version of the tournament in this blog. The learnings and ideas can be extended to more regular trading and investment management setups. You can follow the performance of some of our models here:
- https://signals.numer.ai/vh_ai
- https://signals.numer.ai/l1nkoln
- https://signals.numer.ai/rachnogstyle_ds
1 Survivorship bias
Numerai provides a list of traded tickers as a part of the competition. The most straightforward idea for utilizing them is just to go to your favorite data provider (as it’s shown in the tutorials with Quandl and Yahoo Finance), download the historical data, and start extracting features and modeling them with respect to the provided target. This is where the very first mistake is hiding. The traded stocks today are subject to survivorship bias! You cannot just download the historical data for them and start training models, because it’s 2022 when you know your companies survived, but in 2015, 2010, 2000, and before there were other tickers who were delisted for one or another reason or your current companies in the universe are simply too young. You want to model historical data based on the historical universes. We are using the data provider to build the correct survivorship bias-free datasets and this is the #1 step of our setup.
Additional useful resources:
- https://www.investopedia.com/terms/s/survivorshipbias.asp
- https://teddykoker.com/2019/05/creating-a-survivorship-bias-free-sp-500-dataset-with-python/
- https://www.quantshare.com/sa-435-getting-accurate-backtesting-results-survivorship-bias-free-s-p-500
2 Large feature space
This is something that is shown correctly in the official tutorials, however, we took this idea further. First, we utilize the whole candle space (high-open-low-close-volume-open interest) and it gives us the opportunity to work with the big space of technical indicators as features. Moreover, we also leverage fundamental data and macroeconomic data in our models. It is rather hard to collect it for the whole Numerai universe but for the US-traded tickers, it boosts the performance. We create original features via a combination of market and fundamental data. Unique features are one of the most important things. Try to develop new orthogonal features for your dataset. Last but not least, we use the combination of lags for all our features for several weeks and months back which all together creates for us a very large space of features for the model. We don’t calculate the difference between the lags since we think that this is redundant and our models should capture the difference by themselves.
We recommend taking a look at the following resources to dig further:
- https://arxiv.org/pdf/1601.00991.pdf
- https://www.amazon.es/Statistically-Learning-Algorithmic-Financial-Instruments/dp/148950771X
- https://ta-lib.org/
- https://www.investopedia.com/terms/f/fundamentalanalysis.asp
3 Ranking as stationarizing
Since we aim to create a market-neutral portfolio, it’s only logical to assume that our targets in the competition are relative performances of the instruments with respect to each other or to some other benchmark or value. Hence, our features also have to reflect such relative values within the trading universe. Some tutorials on Kaggle just calculate features in a straightforward way, like each asset is independent by itself, but the smarter way is to apply the ranking procedure to turn the raw feature value into the relative one.
In the Numerai tutorials, it’s offered to do ranking time-wise over the 5 bins and generate the quintiles. Be careful when you’re grouping the data for the procedure. Grouping by ticker you will introduce look-ahead bias (i.e. you will rank along the time series axis). You should group by date because you’re interested in the relative performance of instruments within a single day, not of relative days within a single instrument. We recommend you take this approach further and be creative - what else you can group your data around apart from the date today?
4 Models are not a priority
Here we will be brief. We experimented with many things from era-boosting to VAE+GAN+siamese network embeddings in our search for superior performance. Our current baseline model is a simple LGBMRegressor without even a hyperparameter search. I think this already tells a lot about what’s important and what isn’t in the competition (at least in the Signals one).
5 AFML validation routines
We don’t rely on any train-validation-live splits as it is proposed in the classic Numerai tournament. We have fixed a testing protocol on the same amount and timeliness of the data, the same cross-validation splits using combinatorial cross-validation setup and time-series cross-validation setup. We don’t change the setup for around a year already to keep track of all our experiments to be able to compare them without introducing any bias. Also, we compute a slightly wider setup of metrics also introduced in the AFML:
- Performance metrics (correlation, Sharpe, drawdowns, Sortino, hit rate)
- Outperformance metrics (information ratio, correlation with baseline, probabilistic Sharpe)
- Overfitting metrics (probability of failure, overfitting probability)
For us, building such a pipeline was a game-changer that allowed us to evaluate hypotheses fairly. We started to choose models not with higher correlation or Sharpe, but with stronger outperformance and overfitting metrics that aim for stability and reliability.
The recommended reading is obvious here:
And shameless promotion of my blog:
- https://towardsdatascience.com/ai-in-finance-how-to-finally-start-to-believe-your-backtests-1-3-1613ad81ea44
- https://towardsdatascience.com/ai-in-finance-how-to-finally-start-to-believe-your-backtests-2-3-adfd13da20ec
- https://towardsdatascience.com/ai-in-finance-how-to-finally-start-to-believe-your-backtests-3-3-2f3b4d875842
6 Feature importance as the ultimate test
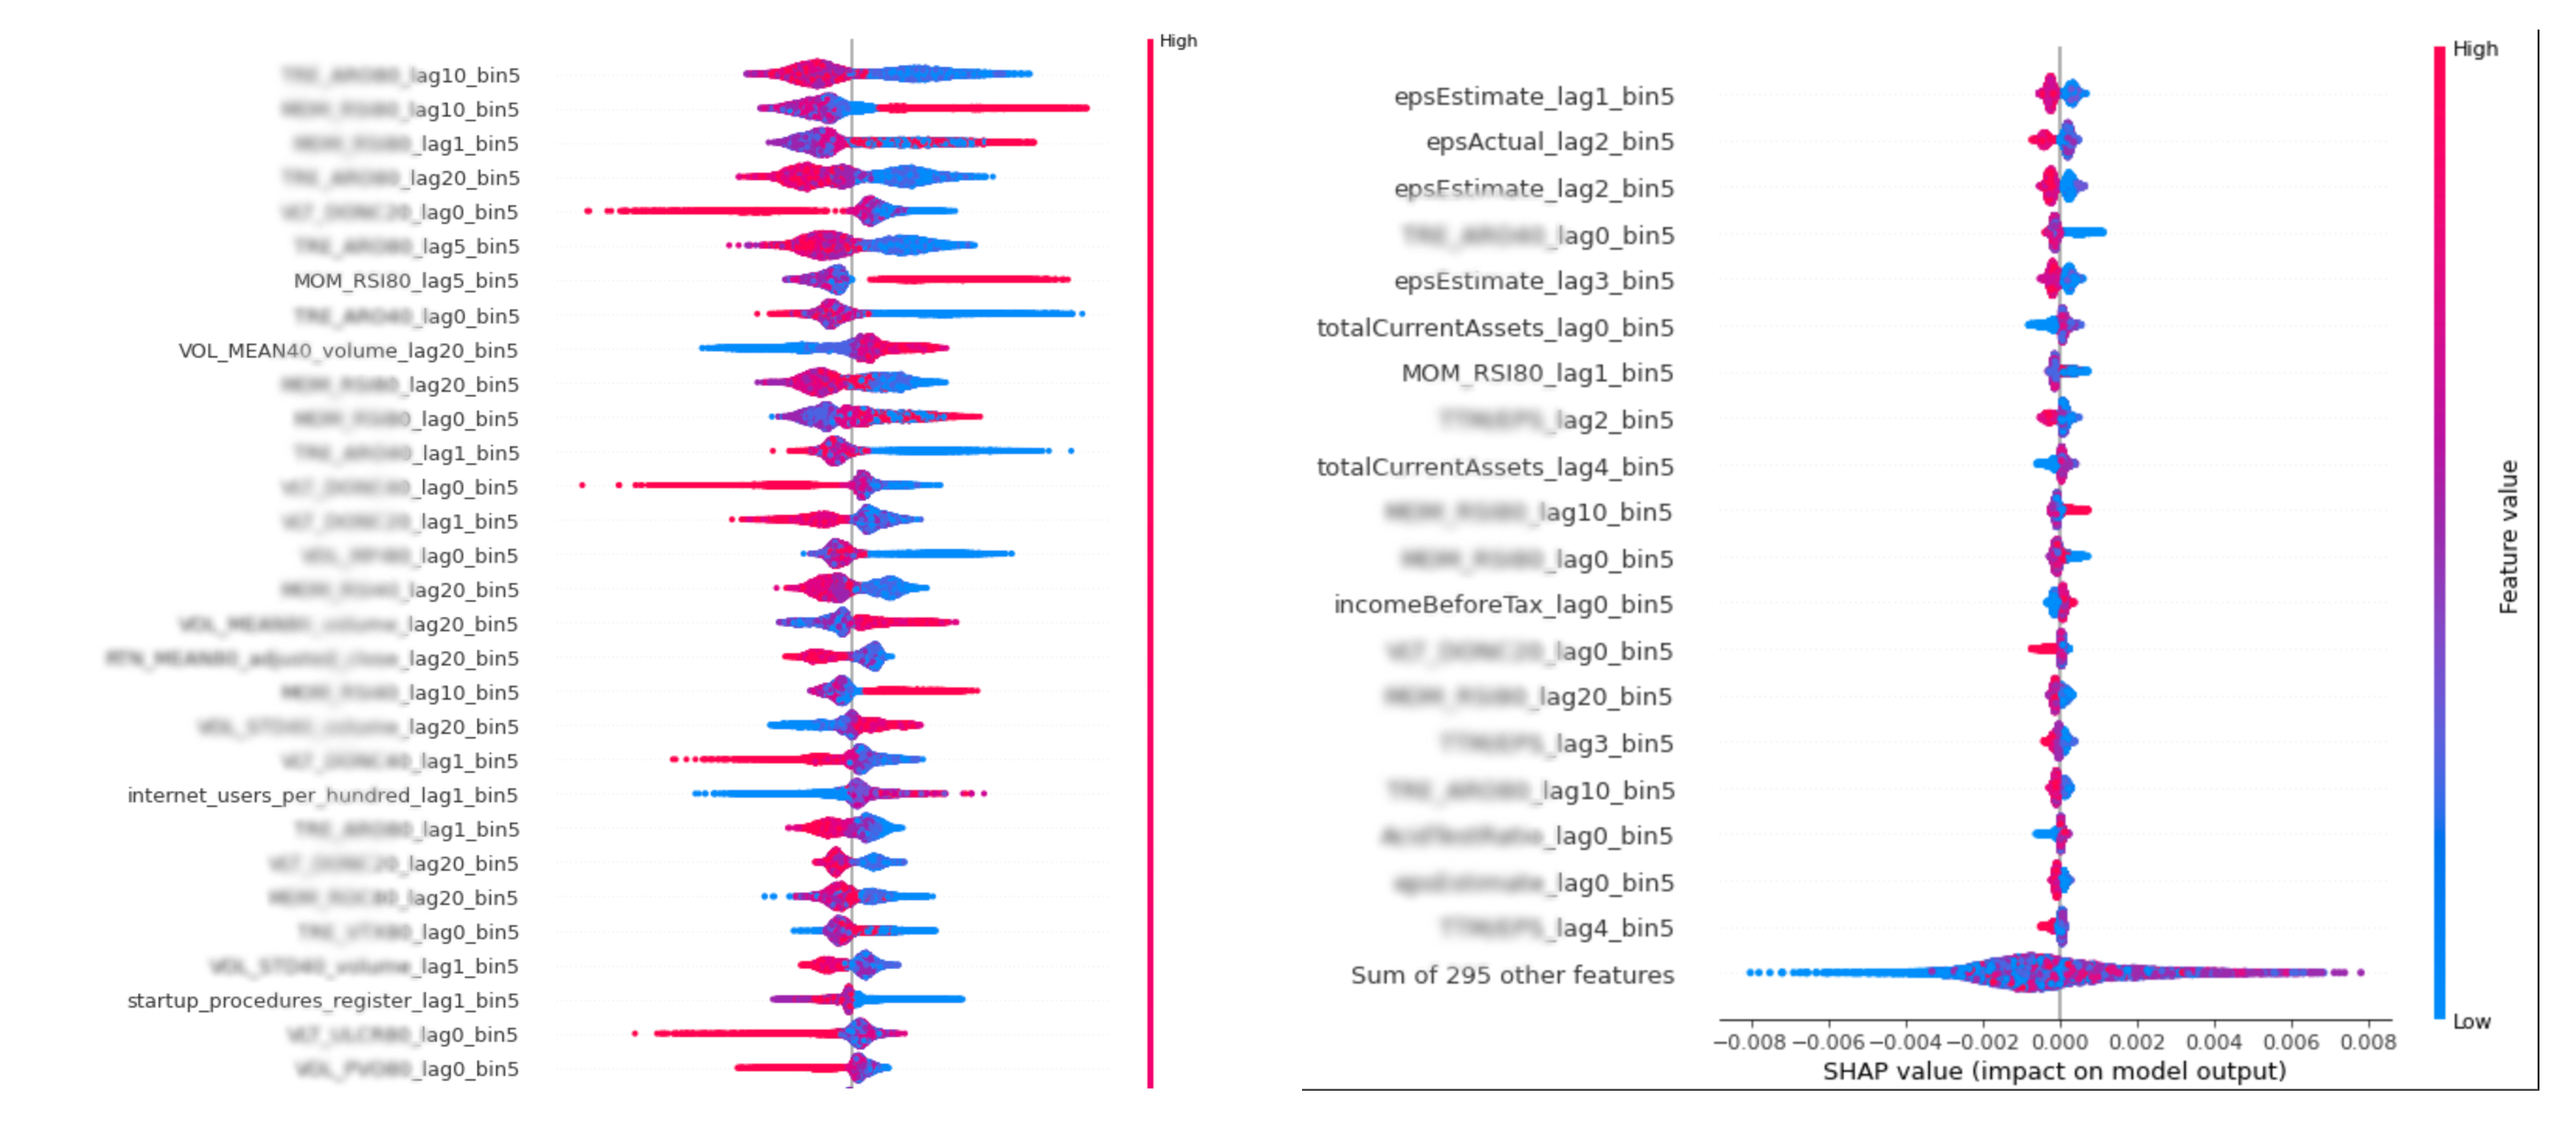
Apart from the purely numerical performance measurement, we calculate the feature importance (FI) to double-check if our improvements in the features and our introduction of the new ones have an economic interpretation. For example, in our first good models, it was very reassuring to see the “sell high - buy low” interpretation of the feature importance of such features as RSI. Or we could spot the importance of the volume traded with some specific lag. Later on, we saw how volume features and fundamental features contributed to the numerical performance and appeared on the top of the feature importance rating as well. We calculate FI using MDA, clustered MDA, and SHAP values.
Check out the following resources to dive deeper:
- https://www.amazon.com/Machine-Learning-Managers-Elements-Quantitative/dp/1108792898/
- https://alexrachnog.medium.com/ai-in-finance-advanced-idea-research-and-evaluation-beyond-backtests-d4d7bb185854
7 We don’t look at Numerai’s dashboard
Lastly, we would like to mention that we don’t look at Numerai dashboard metrics or at the public leaderboard as the ultimate source of truth. Of course, it represents the live performance, but over a rather very limited time period. We are focused on our pipeline and working to make it as robust as possible to make it a single source of truth for our experiments. We are constantly studying its limitations and working on understanding and mitigating our pipeline's risks by design. One of such directions is data and targets simulation, which we take inspiration from the Crowdcent repository.
Next steps
We are currently working on the improvements related to better and more unique feature space to target the true contribution (TC) metric and information ratio (IC) metric to make our models more valuable for the Numerai Fund. We also are experimenting with alternative targets (that’s why ranking is mentioned) and optimizing our code and infrastructure to scale our experiments. We are open to collaborations both in the development and investments space, hit us up on any socials to discuss further.
P.S. If this topic is of interest, we will disclose more details on the feature space and some principles around it, let us know about this as well.