
Executive Summary
Solana has quickly established itself as one of the fastest-growing ecosystems in the blockchain space, largely due to its ability to offer high-speed transactions with low fees. In this report, we took a detailed look at Solana’s economic activity and growth, using Ethereum as a benchmark for comparison. Our analysis covers several important areas, including decentralized finance (DeFi), non-fungible tokens (NFTs), overall network activity, and the economic sustainability of the platform. Through this study, we aim to highlight Solana’s strengths, areas of improvement, and its position within the broader blockchain ecosystem.
Key Findings:
-
Transaction Growth Across Sectors: Since the major surge in December 2023, Solana has consistently outpaced Ethereum in terms of transaction counts across decentralized exchanges (DEXs), NFT marketplaces, and cross-chain bridges. This growth highlights strong user adoption and increasing activity within the Solana ecosystem.
-
Price Correlation with Ethereum: Analysis shows that SOL’s price tends to move in line with ETH about 80% of the time. This close correlation suggests that Solana is maturing as a market-sensitive asset and becoming more closely tied to broader crypto market trends.
-
Faster Block Times: Solana’s average block time has seen significant improvement, decreasing from around 3 seconds to approximately 0.4 seconds. This enhancement demonstrates the network’s ability to scale effectively while maintaining performance under growing demand.
-
Rising Priority Fees: Users on Solana are increasingly willing to pay higher priority fees to ensure faster transaction processing. This trend reflects growing trust in the network's reliability and signals a healthy demand for its transaction capacity.
-
NFT Volume Gap: Although Solana outperforms Ethereum in terms of the number of NFT transactions, Ethereum still leads in total NFT sales volume and average sale price. This indicates that, for now, Ethereum remains the preferred blockchain for higher-value digital collectibles.
Challenges and Areas for Improvement
-
Transaction Failures: Around 14% of transactions on Solana currently fail, which highlights an important area for network optimization. While the platform remains fast and efficient overall, improving the transaction success rate will be essential to enhance user experience and maintain long-term trust as adoption grows.
-
Vote Transactions Dominance: A significant portion of Solana’s total transactions are related to validator voting, rather than direct user activity. Although vote transactions are crucial for maintaining network consensus and security, the heavy dominance of these activities raises questions about the balance of resource allocation. Moving forward, encouraging a greater share of user-driven transactions could help showcase Solana’s real-world utility even more strongly.
Methodology and Data Processing Approach
To ensure a reliable and efficient analysis of Solana’s large-scale transaction data, we followed a structured methodology:
1. Data Processing Approach
Given the size and complexity of Solana’s transaction records, we used two techniques to manage and optimize data handling:
-
Segmented Analysis: Metrics that required heavy computations, such as token volumes, were processed by dividing the data into four chronological batches. Each batch was analyzed separately, and the results were later combined for final insights.
-
Materialized Views: For metrics accessed frequently, such as the monthly Herfindahl-Hirschman Index (HHI), we created materialized views. This method helped optimize query performance and allowed faster and more consistent data retrieval.
2. Herfindahl-Hirschman Index (HHI) Calculation
To measure token concentration within the Solana ecosystem:
-
We first calculated each token’s monthly share of the total transfer volume using the formula: Token Share = (Token Volume per Month) / (Total Volume per Month)
-
Then, we squared each token's share and summed them to derive the HHI value for each month: HHI per Month = ∑(Token Share²)
-
Interpretation: A value closer to 1 indicates a highly concentrated market where a single token dominates, while lower values suggest a more diverse and balanced token distribution.
3. Priority Fee Calculation
To better understand user behavior related to transaction urgency:
-
Base Fee: The minimum fee on Solana is fixed at 5,000 lamports.
-
Priority Fee Formula:
-
If the total fee exceeds 5,000 lamports, Priority Fee = Total Fee – 5,000
-
If not, the Priority Fee is considered 0.
-
-
Purpose: This calculation isolates the portion of fees that users willingly pay on top of the base fee, reflecting their willingness to prioritize faster transaction execution during network congestion.
Ecosystem Metrics Overview
1. Priority Fees Distribution

Source:- Priority Fees Distribution
The rise in priority fees signals increased competition for faster transaction processing, indicating growing network usage. Users paying higher fees for quicker transactions reflect the maturation of Solana’s ecosystem. This trend suggests that Solana is entering a high-demand phase, where scalability and throughput will be critical for maintaining user retention.
2. Block Efficiency (Average Block Time)

Source:- Block Efficiency
The reduction in block time from around 3 seconds to 0.42 seconds marks a significant improvement in network efficiency. This change indicates enhanced validator performance and overall protocol optimization, resulting in lower transaction latency. Block times have remained stable, currently averaging 0.40 seconds, showing consistent performance. This upgrade positions Solana as a high-throughput blockchain, ready to support scalable use cases like DeFi, gaming, and on-chain trading.
3. Proportion of Different Stablecoins

Source:- Proportion of StableCoins Throughout Time
Solana’s stablecoin ecosystem has grown significantly, with over 10 stablecoins now supported, including PYUSD and USDT, although USDC and USDT still dominate in terms of usage and volume. This indicates centralization around a few key assets. The adoption of newer stablecoins is still limited, pointing to a need for deeper liquidity, better integrations, and increased user trust. While there’s progress in diversity, true decentralization and widespread adoption across stablecoins remain ongoing challenges for Solana.
4. Solana’s Transaction Success Rate Throughout Time

Source:- Transaction Success Rate
The average transaction failure rate on Solana has remained around 10%, with occasional spikes to 25% during peak periods. Despite these failures, the network continues to handle large volumes quickly with sub-second finality. The persistent failures point to congestion-related challenges, highlighting an area for improvement as Solana scales. Reducing failure rates will be crucial for enhancing reliability and building user trust as Solana attracts more users and real-time applications.
5. Proportion of Solana’s Vote and Non-Vote Transactions

Source:- Proportion of Solana's Vote and Non-Vote Transactions

Source:- Solana Vote and Non-Vote Transactions
Vote transactions, which are sent by validators to confirm the correctness of blocks, consistently outnumber non-vote transactions. This reflects Solana’s reliance on validator coordination for fast consensus, ensuring network security and rapid finality. However, it also introduces a scalability trade-off, as a significant portion of network throughput is validator-related rather than user-driven. Over time, the ratio has remained largely unchanged, indicating that consensus overhead is a fundamental aspect of the network.
6. Monthly HHI for Solana Token Concentration

Source:- Solana Token Concentration Throughout Time
Solana began with low token concentration, and over time, this has improved, showing healthy diversification. More tokens are now contributing to the network's activity, signaling an expanding and maturing ecosystem. Lower HHI values indicate a more balanced and resilient market, with less reliance on a few dominant assets.
7. SOL vs ETH Price

Source:- SOL vs ETH Price
Although there is a significant price difference, SOL and ETH follow similar price movements around 80% of the time. This suggests a strong correlation, likely due to shared exposure to broader crypto market trends. Their synchronized price shifts imply that Solana is maturing into a market-sensitive asset, similar to Ethereum. This correlation can be seen as a sign of Solana gaining legitimacy and becoming more integrated into the broader market.
8. Solana vs Ethereum - Transaction Success Rate

Source:- Ethereum Successful vs Failed Transactions

Source:- Solana Successful vs Failed Transactions
Solana has a higher transaction failure rate of 14.2%, compared to Ethereum’s 2.8%. This may be due to congestion or protocol inefficiencies during peak periods. Ethereum’s lower failure rate indicates greater consistency and stability, though at a lower throughput. These differences highlight the trade-offs between speed and reliability, influencing user experience and developer preference in both ecosystems.
9. Solana vs Ethereum Total Fee (USD & Native)
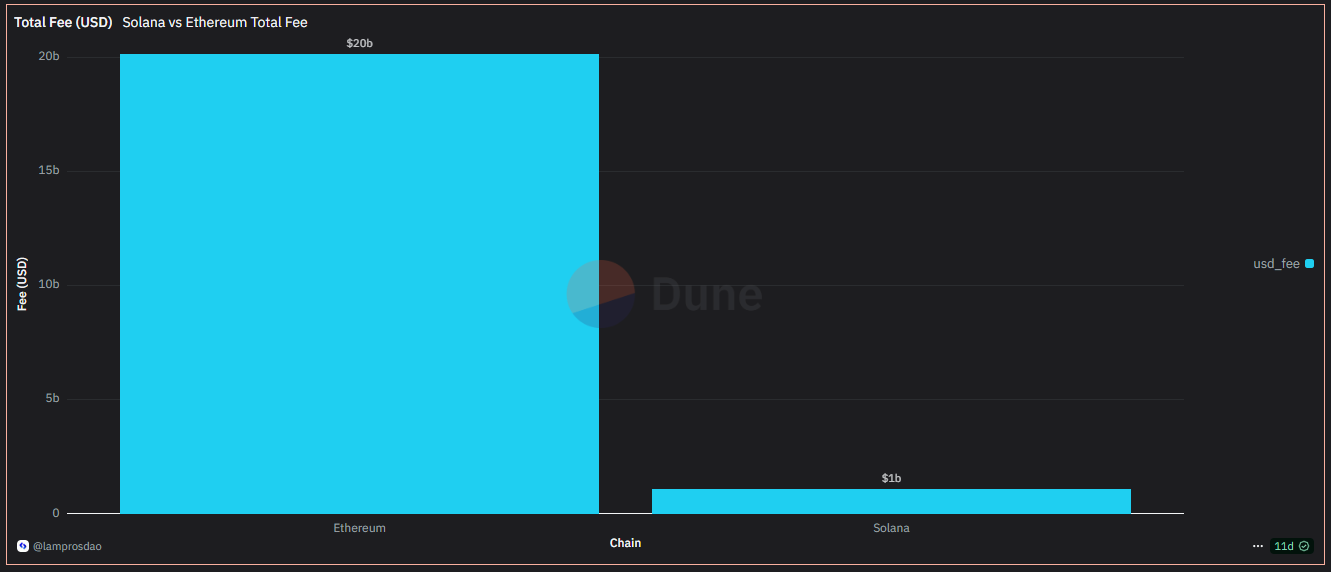
Source:- Total Fees (in USD)

Source:- Total Native Fees
Ethereum has collected 10M ETH ($20B) in total fees, while Solana has gathered 6M SOL ($1B). Despite Solana’s higher throughput and lower costs, Ethereum captures significantly more economic value from its network. The higher gas fees on Ethereum contribute to greater fee revenue, even with fewer transactions. Solana prioritizes scalability and accessibility, but it may face challenges in capturing equivalent value per transaction.
10. Solana vs Ethereum Total Transactions

Source:- Solana vs Ethereum Total Transactions
Solana has processed around 120 times more transactions than Ethereum, despite being a newer network. This difference in transaction volume points to a clear user preference for Solana’s low-cost and high-speed infrastructure. Solana’s ability to handle more frequent and faster transactions gives it a competitive edge, especially in sectors requiring high transaction throughput.
11. Solana vs Ethereum Dex Trades

Source:- Solana vs Ethereum Dex Trades
Solana has become a strong competitor to Ethereum in the DEX transaction space since its early days. While Ethereum’s DEX transactions have remained relatively stable, Solana has shown steady growth in transaction volume. This growth signals increasing adoption and user engagement within Solana’s DeFi ecosystem. The upward trend in Solana’s DEX activity reflects the strengthening of its position in decentralized finance and growing trust in its platform for DeFi activities.
12. Solana vs Ethereum - NFT Sales Volume(USD)

Source:- Solana vs Ethereum NFT Sales Volume (in USD)
Ethereum consistently leads in NFT sales volume in USD compared to Solana. However, in December 2023, Solana experienced a significant market boom, surpassing Ethereum in sales volume during that period. After this spike, Ethereum regained its lead, suggesting that users may have returned to Ethereum for higher-value NFT trading. This trend indicates that while Solana saw a surge in popularity, Ethereum remains the preferred platform for sustained NFT trading.
13. Solana vs Ethereum - NFT Sales Count

Source:- Solana vs Ethereum NFT Sales Count
Since June 2022, Solana has consistently seen higher NFT sales counts compared to Ethereum. While there are occasional decreases, the overall trend shows sustained user activity and engagement in NFT trading. This higher frequency of transactions suggests that Solana is favored for lower-cost, high-frequency NFT trades, likely due to its lower fees and faster processing. In contrast, Ethereum is used for fewer but higher-value transactions, reinforcing its role as the platform for premium NFT sales.
14. Solana vs Ethereum - Average NFT Sale Price (USD)

Source:- Solana vs Ethereum Average NFT Sale Price (in USD)
The average NFT sale price on Solana has consistently been lower than on Ethereum. This supports the earlier insight that while Solana sees higher transactions, the value per transaction is relatively low. The data suggests that users prefer Solana for more accessible, lower-value NFT trades, likely due to its lower fees and faster processing. In contrast, Ethereum continues to lead in high-value NFT sales, positioning itself as the platform for premium digital assets.
15. Solana vs Ethereum - NFT Sellers and Buyers

Source:- Solana vs Ethereum NFT Sellers

Source:- Solana vs Ethereum NFT Buyers
In December 2023, both NFT buyers and sellers on Solana saw a significant spike, reflecting a surge in trading activity and user interest during the market boom. However, following this peak, the number of active buyers and sellers on Solana declined, suggesting a cooling-off period. As of the latest data, the number of NFT buyers and sellers on Solana and Ethereum is nearly equal, indicating a more balanced level of user participation across both ecosystems.
16. Solana vs Ethereum - Bridge Users Count

Source:- Solana vs Ethereum Bridge Users Count
During Solana's market boom in December 2023, the number of bridge users on Solana spiked, indicating increased interest in cross-chain activity. However, despite this surge, Solana’s bridge user count did not surpass Ethereum’s, which remained the preferred network for bridging. Following the peak, Solana’s bridge user count declined, possibly reflecting a drop in user confidence or demand for bridging with Solana. This suggests that users may perceive Ethereum-based bridges as more reliable for cross-chain interactions.
17. Solana vs Ethereum - Bridge Transaction Count

Source:- Solana vs Ethereum Bridge Transaction Count
Since January 2024, Solana has outpaced Ethereum in bridge transaction count, highlighting its growing activity in cross-chain interactions. Despite having a higher transaction volume, Solana did not surpass Ethereum in user count up to November 2024. This suggests that a smaller but more active group of Solana users are making frequent or repeated bridge transactions, likely driven by Solana’s lower fees and faster processing times. On the other hand, Ethereum maintains a broader user base for bridge transactions, even though individual users tend to transact less frequently.
Conclusion
This report provides a comprehensive analysis of Solana’s transaction dynamics in comparison to Ethereum, highlighting Solana’s strengths and challenges. While Solana excels in transaction throughput, with significantly higher transaction volumes than Ethereum, it still faces challenges in areas like transaction failure rates and reliance on validator vote transactions. These issues suggest the need for further optimization as the network scales.
Despite these challenges, Solana’s increasing token diversity and the rise in priority fees indicate a growing, more mature ecosystem. Solana’s steady growth in decentralized finance (DeFi) and its competitive performance in DEX transactions further solidify its emerging position as a serious contender in the blockchain space.
While Ethereum remains dominant in economic value capture and premium NFT activity, Solana is positioning itself as a strong alternative for low-cost, high-frequency use cases. The network’s trajectory shows strong potential for mass adoption, provided it can address its structural inefficiencies and increase user-driven activity. Overall, Solana’s future in decentralized applications looks promising
Additional Resources and Dashboards:
To explore a more in-depth analysis of Solana’s transaction dynamics and comparisons with Ethereum, we have created dedicated dashboards. These dashboards present the key metrics and insights discussed in this report, offering interactive visualizations and real-time data updates. You can dive deeper into the trends and analyze the data with the following links:
-
Dune Dashboard: Access our interactive dashboard on Dune, where you can explore real-time metrics, visualizations, and detailed insights based on Solana’s transaction activity.
- Link:- Dune Dashboard
-
Flipside Dashboard: Visit our Flipside dashboard for another perspective on Solana’s ecosystem, offering additional data and metrics for comprehensive analysis.
- Link:- Flipside Dashboard