
Hodler, academic researcher, or suspicious act investigator, we are all facing the ever-increasing transaction data problem no matter who you are. Therefore, a capable DeFi data analytic tool can empower us in three ways:
- It reveals the transaction structures behind the complexity of addresses, tokens, and trades.
- It presents the intrinsic substance of smart contracts, which you can use to foretell the future behaviours of certain actors.
- It manifests associations among multiple nodes, liquidity pools, and owners of liquidity pools.
With all these undertakings in mind, using our proprietary algorithms, EigenPhi set out to discover the wisdom of DeFi.
We start with the big picture of arbitrage/#MEV on Ethereum and BSC and layered structure data regarding specific arbitrage contracts.
Let’s take a brief tour of EigenPhi to unearth gems that might benefit you.
Overview of #MEV
Open our website: https://eigenphi.io/.
This page has three sections: top, overall arbitrage status, and complementary information.
The top section determines the data shown in the overall status part. You can switch between Ethereum and BSC. Choosing the time period is essential in presenting the long-time winner and the shooting star. You can dig them deeper with EigenPhi’s structure analysis feature.
The upper right corner displays, under the current time period, the overall #MEV profit and the corresponding transaction number. On EigenPhi, all the profit, revenue, and cost are US dollars; unless marked in a specific Token.
There are 4 data areas in the overall status section.
- Leader Board shows the top 10 contracts and their general data during the period. You can find the contract address, profit, cost, and profit percentage, a.k.a. ROI. You can pick the contract that interests you. We will deal with it in a short while.
- Arbitrage Transaction Profit Distribution exhibits the overall #MEV capabilities in the market. For example, the figure below shows that the lowest 25% transactions’ profit is less or equal 0.11 USD; the bottom 50% transactions’ profit is less or equal 0.58 USD; about 95% is less or equal 23.38 USD, and the highest profit is 58,346.87 USD.
Please be advised that the data you read on the page when reading the article could be different in the figures. As time moves forward, the transaction data filtered into the chosen period of time would be variant.
- Arbitrage Transaction Profit Leader Board picks out the top 10 transactions hidden in the countless contracts. It tells you which contracts these transactions belong to and the type of the transactions. There are four types of arbitrage transactions: Combination, Sandwich, Spatial, and Triangular.
- Arbitrage Transaction(Real-Time Stream) illustrates what’s happening now on the chain. The columns of the data are the same as the part above it.
Next, the complementary section contains three tables independent of the chosen time period.
New Liquidity Pools brings up the latest LPs in descending order of time.
Frequently Used Pools shows the most used LPs and the amount they have made during the last seven days in descending order of amount.
Malicious Tokens helps you identify the tokens with bad intentions and risk types they are carrying.
All three tables have a More button and URL link, which take you to the corresponding list pages to show much more data for you to research.
With the broad view in mind, let us zoom in on one BSC contract.
One Contract at a Time And Don’t Settle for Less
No one joins the DeFi world to learn less and earn less. To accomplish more, like pinpointing behaviours and dissecting interrelation among participants, you have no choice but to establish the structure inside the contract.
Using EigenPhi, you will be able to find out the general information about a contract, dive into the detailed transaction, and bring to light ways of profitmaking.
Take a look at this contract. The detail page of it is more or less like the homepage.
- Current Contract Overview section tells you how many successful transactions in the chosen period are identified by EigenPhi as arbitrage ones. As of now, this one has 29,052 labelled. You can jump to the BscScan website by clicking the link on the right of the contract address. There are almost 545,000 transactions listed there. Imagine if someone has to go through all those.
Current Contract Overview section also calculates the ROI, cost, and profit. The cost includes gas and transaction fees.
- Like on the homepage, the purpose of Arbitrage Transaction Profit Distribution section is to exhibit profitmaking capabilities in terms of the transactions in the current contract.
- Transaction Profit Leader Board picks out the top 10 transactions hidden in the 29,052 contracts.
- Current Contract Transactions section itemizes the latest MEV transactions.
Next, let’s crack wide open the best performance transaction of the current contract.
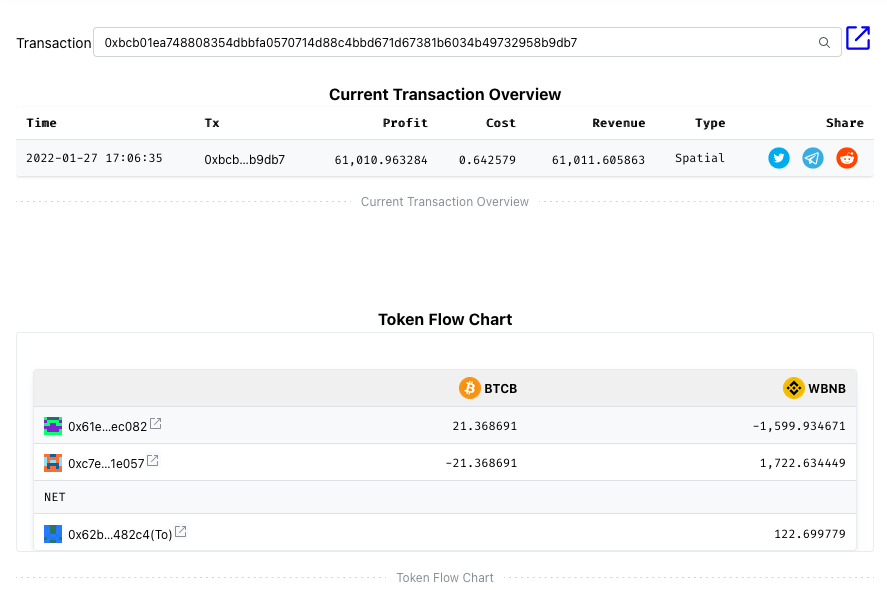
In Current Transaction Flow Overview section, you can read its earnings and share them via Twitter, Telegram, and Reddit.
The most exciting part is Token Flow Chart, in which is all the money. It should be read from the user’s perspective, who kicked off the transaction.
To help you get a basic idea, this is the tokens transfer records captured from BscSCAN:
This graph clarifies the interactions among the hodlers and liquidity pools.
For clarity, the token amount in the text below is rounded.
First, LP 0x61eb received 1599.93 WBNB from Hodler 0x62bc.
In Hodler 0x62bc’s viewpoint, it lost 1599.93 WBNB. But it received 21.37 BTCB from LP 0x61eb, which shows in the second step. So although these BTCB did not transfer directly to Hodler 0x62bc, you can treat them as the asset increasing in terms of the interaction between Hodler 0x62bc and LP 0x61eb. That’s what EigenPhi present it.
Next, LP 0x61eb sent 21.37 BTCB to LP 0xc7e9. And in the third step, LP 0xc7e9 sent 1722.63 WBNB back to Hodler 0x62bc.
Regarding the interaction between LP 0xc7e9 and Hodler 0x62bc, in the Hodler’s eyes, its asset received 1722.63 WBNB at the cost of 21.37 BTCB. Hence the way EigenPhi shows it:
In the end, by implementing the spatial transaction, Hodler 0x62bc’s net gain is 122.699779 WBNB, which shows in the red rectangle below.
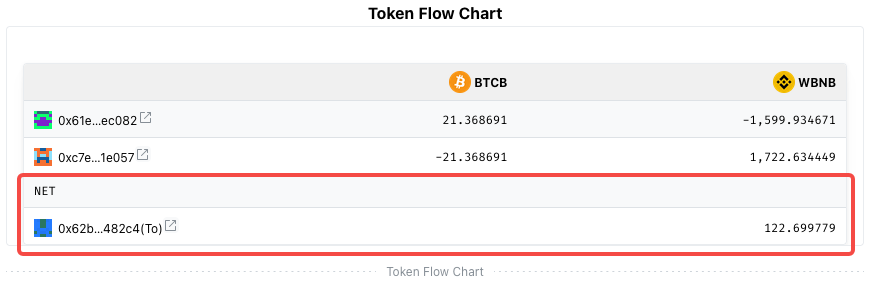
Without a doubt, Token Flow Chart simplifies the complexity of the addresses and tokens interweaving, discloses the structures hidden in the contracts, and extracts the critical activities for your consideration.
Sandwich? Thanks, But No Thanks!
Sandwich attacks in DeFi have significant consequences, such as marketing manipulation. You can find a more elaborate explanation here.
A sandwich attack is difficult to monitor and detect due to its complex nature. To help investors to identify such malicious transactions, using our in-house algorithms, EigenPhi provides the Sandwich transactions discovering feature.
you can examine the Arbitrage Transaction Profit Leader Board and Arbitrage Transaction(Real-Time Stream). The Type columns in both lists indicate what kind of transaction the row of data is.
Click the row marked as Sandwich, and you can open the particular page of the transaction.
Let’s dig into the details of this one in the Token Flow Chart section.
As it’s a sandwich attack, the victim’s transaction is between the attackers’. So the green row is the poor guy’s address and his deal. The pink rows belong to the attacker. For the sake of clarity, only the last four digits of the address are used for indication.
we can split the whole process as below:
- In the green row, HODLer 0x0ad3 wanted to swap WETH for COPS.
- Scanning the mempool, Attacker 0x6b40 detected the victim’s swapping intention.
- Attacker 0x6b40 sold 26.770108 WETH to the liquidity pool 9314 for 159.089221 COPS, which caused the price of COPS to go up.
- HODLer 0x0ad3 sold 0.5 WETH for 2.4584 COPS to the LP, although he or she could have got more providing no Sandwich attack.
- Attacker 0x6b40 swapped 159.089221 COPS for 26.791703 WETH in the LP. The attack is over.
- In conclusion, Attacker 0x6b40 netted 0.021594 WETH, which is $69.002826 considering the price of WETH at the time. Deducted the cost of the attack including gas and transaction fees, the profit is $5.094312 which can be found in the overview part.
In the long run, EigenPhi aims at unveiling the new structures and behaviours of arbitrage/MEV/attacking in the existing and emerging DeFi protocols. Discovering the wisdom of DeFi is EigenPhi’s mission.
To find out how we achieve the goal, please feel free to follow us on Discord, Medium, Revue, Substack, and Twitter.
Interested in receiving the latest MEV alert? Follow EigenPhi MEV🤖 Alert.