
Curve is a DEX liquidity pool built on Ethereum and launched in 2020. It is also known for StableSwap, a feature dedicated to creating an ecosystem that allows users to exchange stablecoins with other DEX protocols with lower fees and slippage.
After about two years of development, Curve can currently support three categories of exchange:
- Stablecoins: Curve has more than 20 USD-pegged stable currency pools, such as 3pool, Lusd+3Crv, UST, etc.
- Stable pegged assets: For example, Curve supports ETH’s PoS and synthetic assets.
- Non-stable pegged assets: After Curve V2, users can exchange BTC, ETH, and USDC in the Curve Tricrypto Pool.
But what makes Curve stand out from other DEXs is its 3-token pool and unique price curve. Take Curve tri-pool as an example. It plays a significant role in reducing risk. Curve does not directly set up pools between premature or risk tokens and stablecoins. Instead, it relies on 3Crv as a medium token to isolate risks, bringing a strong risk buffer to stablecoins. Its unique price curve differs from the constant product formula curve, enabling its pools to suffer from less slippage in the stablecoin AMM markets.
When we talk about AMM markets, we inevitably talk about MEV activities. MEV (Maximal Extractable Value) has generated attractive wealth opportunities in the dark forest. The investigation into MEV bots is vital in improving the efficiency of price discovery in AMM markets. Curve has become an irreplaceable DeFi infrastructure, so we must explore the in-depth impact of MEV activities on Curve.
By providing the MEV impact overview on Curve, we hope this report could inspire stakeholders and researchers to shed light on these questions:
- How far do MEV bots impact the Curve community and its users?
- Who would be most likely to be involved in MEV activities?
- How valuable could MEV data be to enhance the protocol design and impact trading decision-making?
This report will calibrate the MEV market and its impact by observing the extracted asset values. Unlike Uniswap V3 (referring to the research report we released earlier), the MEV type like JIT (just-in-time liquidation) hasn’t emerged in Curve. So we will focus on the two major types of MEV bot activity involving Curve liquidity pools:
- For arbitrage bots, we have filtered out all the transactions involving curve pools.
- For sandwich bots, we will target the transactions where victims get sandwiched in Curve liquidity pools.
The following analysis will start with abstract of key points we have discovered during the investigations of MEV behavior on Curve. Then present an overview of the MEV revenue, volume, frequency analysis, profit, etc. Finally we will dig deeper into each MEV type with some compelling and inspiring conclusions.
Thanks for reading Wisdom of DeFi by EigenPhi! Subscribe for free to receive new posts and support my work.
Abstract
Two MEV types have been explored in Curve: arbitrage bots have generated more than $10M value involving Curve pools, and sandwich bots have extracted $0.98M revenue from victims that are trading in Curve pools. Arbitrage bots are more active in Curve compared with sandwich bots.
We have also investigated the volume flow for both MEV types. Volume is the key factor to influence the price slippage, and due to the unique slippage design of Curve, the investigation of volume on the sandwich attack is also instructive. We discovered that the volume per transaction for sandwich bots is one magnitude larger than for arbitrage bots. How the volume impacts the sandwich bot’s revenue and the victim’s loss is also listed in detail.
The trading opportunities for arbitrage are relatively related to the intensity of market price fluctuations. However, the opportunities for sandwich bots do not seem to correlate with price fluctuations in the market. Some lucky bots could generate attractive wealth. But not all MEV bots could generate positive profit, where the cost of the MEV is also investigated. The most favorite Curve pool for the arbitrage bot and sandwich bot is also provided in the following content.
When we investigated the sandwich bot’s activities, we discovered that token exchangers could be sandwich victims in the Curve pool. But those adding/removing liquidations to/from Curve pools could also be attacked, where the revenue generated from those victims is considerable. Compared with Uniswap, sandwich attacks are more challenging to execute in Curve pools. But it is worth noticing that the percentage of sandwiches in Curve keeps increasing in the time range we inspected. More and more victims have suffered sandwich attacks and losses since June, with an increasing speed of 300%.
Revenue From MEV
Curve’s MEV revenue comes from two aspects:
- Arbitrage gains when reducing the price spread between markets.
- Sandwich attack gains when front-running users’ transactions
The revenue generated from arbitrage will influence the impermanent loss of liquidity providers (LPs) and the slippage loss of swap users. But sandwich revenue directly causes victims to bear the slippage loss.
Total Revenue by Different MEV Types
Figure 1 shows an overview of the revenue generated from arbitrage and sandwich bots involving Curve pools and lists the total fee revenue from Curve for comparison.
Here is the performance of the two MEV types during the period from June 1st to Oct 31st:
- Arbitrage bots have generated more than $10M in revenue from transactions that involved Curve pools, with total arbitrage counts of 40,419.
- Sandwich bots extracted $0.98M revenue from the victims trading in Curve pools, with total sandwich counts of 970.
- The Curve pools revenue from swap fees is around $15 M (source 🏆Curve.fi trading fee per day.)
Compared with the fee revenue that Curve pools have generated, the total extractable value from the two MEV types crosses 73% of the pool’s revenue.
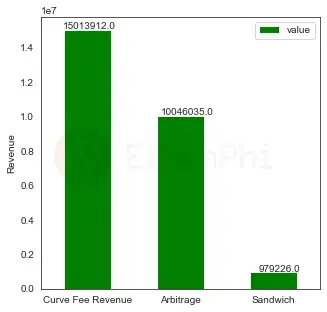
Figure 1: Total revenue of Arbitrage and Sandwich that happened in Curve pools compared with the fee revenue generated by Curve
Revenue Distribution of Each MEV Type
Here is the examination of revenue distribution for arbitrage and sandwich transactions. As shown in Figure 2, most of the arbitrage bots could generate revenue in the range of $11-$100. And sandwich bots would spread the revenue between $1 to $10K.
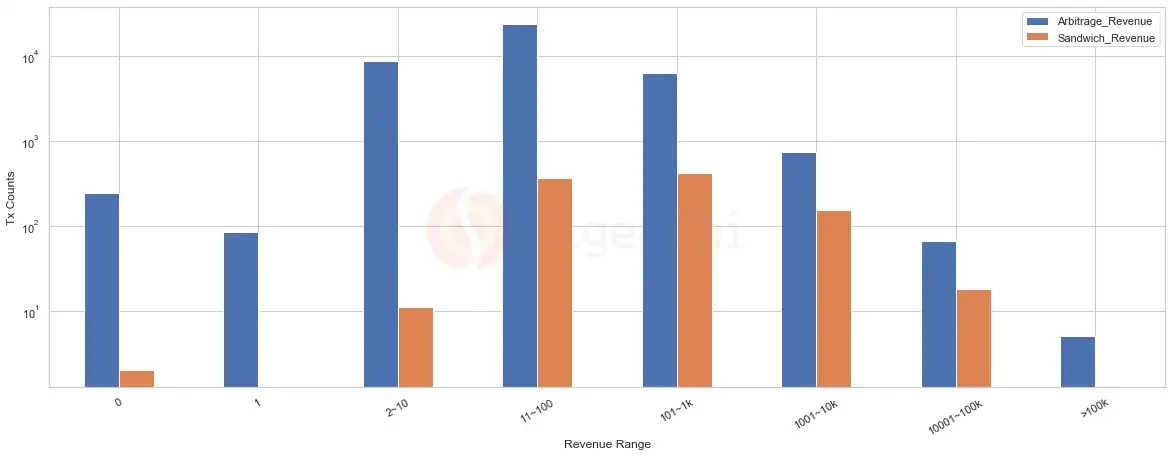
Figure 2: Revenue distribution of arbitrage and sandwich
Figure 3 shows the boxplot of the revenue distribution for arbitrage and sandwich, clearly indicating a fat tail distribution on the revenue that the MEV bots generated.

Figure 3: Boxplot of the revenue distribution for arbitrage and sandwich
We have summarized some statistical numbers on the revenue distribution, which intuitively indicate that ‘lucky’ highly profitable bots contributed most of the revenue:
- 75% of arbitrage bots make revenue less than $100. The remaining 25% of transactions made 9.4 M revenue and took over 94% of all the revenue.
- For the sandwich bots, the majority’s revenue of a single transaction is higher than arbitrage bots. 75% of sandwich bots make revenue less than $1000. The remaining 25% of transactions make 0.86 M revenue and took over 87.8% of all the revenue.
Monthly Revenue Trend Since June 2022 by Different MEV Types
By investigating the monthly revenue trend for arbitrage and sandwich bots, we aim to provide an overview of the value extracted by MEV from a timeline perspective. Figure 4 shows the monthly revenue generated by arbitrages and sandwiches from Curve pools and compares them with the fee revenue that Curve generated each month.
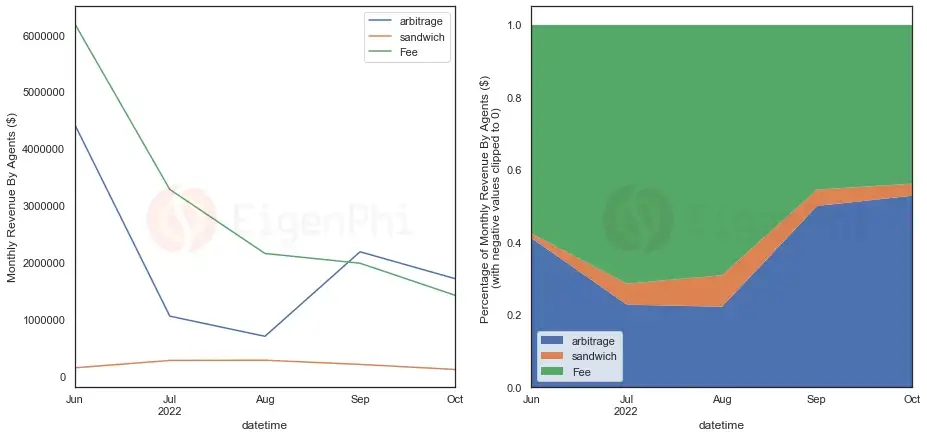
Figure 4: Monthly revenue for arbitrage and sandwich bots. The right-hand graph shows the percentage comparison between arbitrage revenue, sandwich revenue,** and fee revenue.**
As shown on the left side of Figure 4, we provided the sum of the revenue for each month since June. The magnitude of the monthly revenue for arbitrage bots is one magnitude larger than the sandwich bots. The total revenue of arbitrage bots, which is much larger than the sandwich bots, originates from highly active arbitrage activities compared with sandwich activities. We will provide more investigations into the MEV bots frequency analysis in the third session.
In June and Sep, arbitrage bots generated more revenue than the rest of the months. To see what happened in those two months, we expand the timeline to investigate the daily revenue trend in more detail. As shown in Figure 5, some extremely profitable arbitrage bots generate more than 1 million dollars, which significantly raises monthly revenue. Our transaction analysis tool, EigenTx, provides a detailed analysis of how the ‘lucky’ bots generate that much revenue. If interested, we have attached the link for reference.

Figure 5: Daily revenue for arbitrage and sandwich bots. The right-hand graph shows the percentage comparison between arbitrage revenue, sandwich revenue,** and fee revenue**.
The transaction generated high revenue on June 13th. This revenue is related to the stETH de-peg, which saw high trading volume on Curve on that day.
Correlation of Revenue From Different MEV Types
We have also conducted a correlation analysis on the revenue for both arbitrage and sandwich bots, aiming to reveal any conflicts between those bots. The calculation of the correlation coefficient disregarded those bots that generate extreme revenue, and the final output is 0.11.
From an overview perspective, it didn’t indicate any negative correlation between the two MEV bots. So we believe there are no apparent interest conflicts between arbitrage agents and sandwich agents.
We also investigated the correlation between the extracted value from arbitrage bots and fee revenue from the swap users. The correlation coefficient is 0.7 when comparing the 7-day rolling average of arbitrage revenue and fee revenue.
Figure 6 shows the correlation between arbitrage and fee revenue. The positive correlation could be associated with the correlation between arbitrage volume and total trading volume. In the next session about the trading volume investigation, the arbitrage revenue is also positively related to the trading volume. More details are in the following session on the research of trading volume for different MEV types.

Figure 6 Correlation between fee revenue and arbitrage revenue
Note that we have also compared the fee revenue with the sandwich revenue. The correlation is much less than with arbitrage. This could be explained by the lower correlation between the sandwich volume change and total volume change.
Trading Volume of Curve Liquidity Pools Involving MEV
Volume contribution from arbitrage and sandwich bots to Curve is also an important metric to evaluate the impact of MEV on the macroscopic level. Volume is also an indispensable feature to interfere with the price slippage of liquidity pools, which is the essence of the mechanism of sandwich attacks. So in this section, we will provide a statistical overview of the volume from arbitrage and sandwich, the distribution, and correlation with revenue. In our session, ‘Detailed analysis on sandwich bots’, we provide detailed information like sandwich volume distribution, hoping to illuminate the investigation on the slippage tolerance design for Curve liquidity pools.
The volume calculation is not simply the sum of the volume of arbitrage transactions or sandwich transactions. Because the volume of arbitrage transactions would include the trading volume of other venues, and the volume for sandwich transactions would involve the volume from other pools unrelated to the sandwich attacks. So we have calculated the arbitrage volume based on filtering out the volume that only occurred directly on Curve pools and used the same logic for sandwich volume calculation.
We converted the final output of the volume to USD and based the token price calculation on our newest version of the price index. More details are in the methodology session.
Here is the summary of the total volume of the two MEV types during the period from June 1st to Oct 31st:
- Arbitrage bots have contributed a total of $2.2 billion volume to curve pools.
- Sandwich bots have contributed a total of $1.2 billion volume to curve pools.
- For comparison, we have also listed the total volume from Curve pools, around $16 billion. (source: 📈Curve.fi total trading volume per day)
Volume Trend by Different MEV Types
To start with, we compared the trading volume of arbitrage and sandwich bots for each day and then compared that with the total volume from the main Curve liquidity pools. The MEV volume crossed 20% of the total volume on most days. And there are some single days when the MEV volume is roaring to dominate the total volume.

Figure 7: Daily volume trend for arbitrage and sandwich bots. The total volume of Curve pools is also listed for comparison. The right-hand side of the graph shows the daily trend on the percentage of MEV volume to total volume.
The daily trend indicates that the total arbitrage volume and total sandwich volume for each day are around the same magnitude. Considering the much more active arbitrage bots than sandwich bots (referring to the next session of the MEV bot frequency analysis), the average volume of single sandwich transactions should be greater than arbitrage transactions. Figure 8 shows the average volume per observation of the arbitrage and sandwich transactions, demonstrating that the average volume of sandwich transactions is one magnitude larger than arbitrage.

Figure 8 Average volume per observation for the arbitrage and sandwich transactions
We provide further comparisons of the volume between arbitrage and sandwich attacks in the following content.
Volume Distribution for Each MEV Type
We have investigated the volume distribution for arbitrage and sandwich bots. Figure 9 describes the transaction counts in each volume range. The majority of arbitrage transaction volume concentrates in the range of 1K-10K. But sandwich volume primarily concentrates in the 100k~1m range.
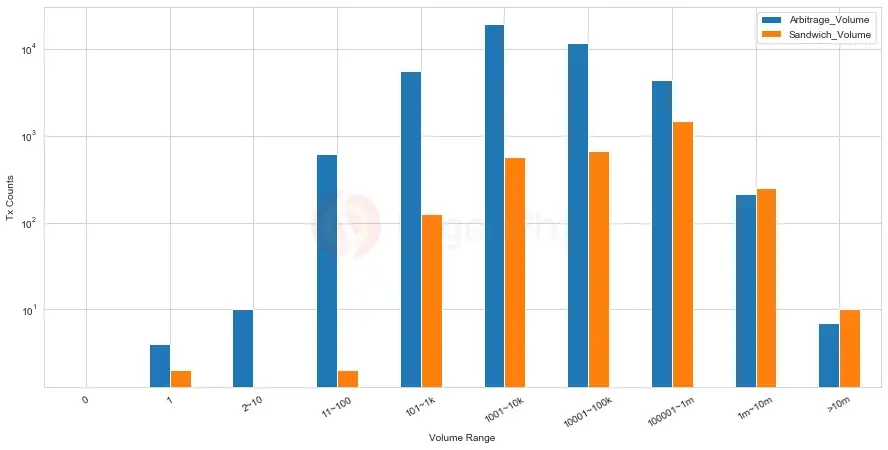
Figure 9 Volume distribution for arbitrage and sandwich bots
Here is the boxplot to compare the arbitrage volume with the sandwich attacker’s volume. We separate the attacker’s volume because it’s highly related to the slippage tolerance calculation, which is the motivation of a sandwich attack. The median volume of the sandwich attacker is one magnitude larger than the arbitrageur’s volume. This is related to the unique price algorithm, which is different from Uniswap V3 with the constant product formula. Curve enables its pools to suffer less slippage in the stablecoin, which means the attacker will need to input more volume to initiate a price slippage for a sandwich attack. We will investigate further and provide more evidence in our future reports.

Figure 10: Boxplot distribution of arbitrage volume and sandwich attacker’s volume. The left side of the box shows a 25% quartile, the middle line represents the median data, and the right side of the box shows a 75% quartile of the data.
Correlation Between Volume and Revenue
We have analyzed the correlation between revenue and volume. As shown in Figure 11, there is a positive relationship between the revenue extracted and trading volume for both sandwich and arbitrage bots.
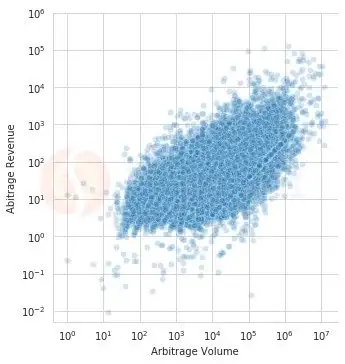
Figure 11 Correlation between revenue and volume
MEV Bots Frequency Analysis
The frequency analysis on the counts of each MEV type could reflect how frequently those bots spot MEV opportunities. We based our identification of MEV bots for Curve pools on the minimum set, but comparing the data along the timeline would still be inspiring. We have analyzed the daily observations and compared them with the price fluctuations to overview what will influence MEV opportunities for Curve pools.
Daily Observations Trend of MEV Since June 2022 in Curve Liquidity Pools
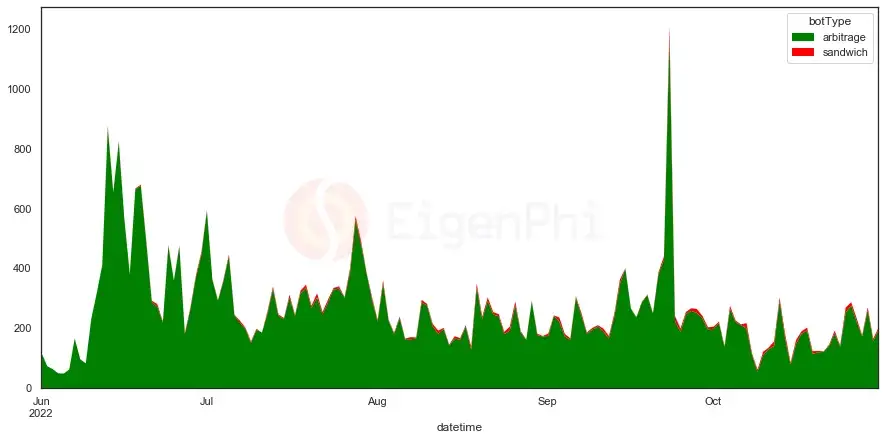
Figure 12 Daily counts of arbitrage and sandwich bots
From the above figure, we can see that arbitrage bots have started to be relatively active since June. But the activities for sandwich bots are significantly smaller than arbitrage bots. This indicates arbitrage bots are more likely to find MEV opportunities in Curve pools.
Correlation of MEV Daily Observations and Price Change
The fluctuation of observation frequency positively correlates with the absolute price change of representative crypto assets for both arbitrage and sandwich activities. We have calculated the daily frequency fluctuation with the 7-day price change percent of ETH, BTC, and CRV.
The correlation coefficient is shown below:
Arbitrage vs ETH 0.48
Arbitrage vs BTC 0.46
Arbitrage vs CRV 0.48
Sandwich vs ETH -0.02
Sandwich vs BTC -0.14
Sandwich vs CRV -0.13
The result shows the occurrence of trading opportunities for arbitrage is relatively related to the intensity of market price fluctuations. However, the opportunities for sandwich bots don’t seem to correlate with the price fluctuation in the market. The sandwich result differs from Uniswap (with a 0.6 correlation coefficient of price fluctuation). One reason could be that the sandwich activities are less compared with Uniswap (more evidence on detailed analysis of sandwich bots in the following content), so the influence of the market price will be less. Another reason is that Curve contains more stablecoin pools, meaning sandwich opportunities will rely less on the price fluctuation in the market.
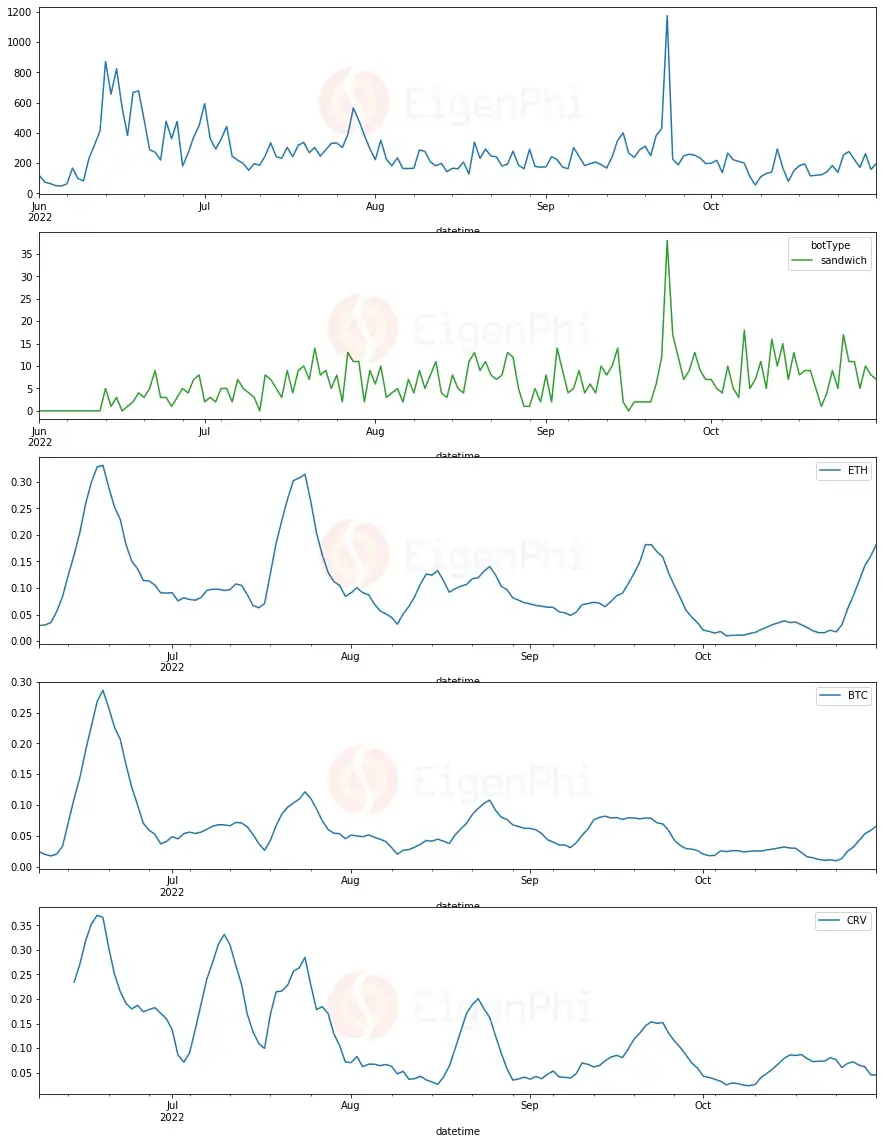
Figure 13 daily observation of MEV bots and price fluctuation of ETH, BTC and CRV.
Profit
MEV bots’ actual profit left in their pockets is another parameter to predict how attractive the MEV market will be for outsiders. Here we should notice that evaluating the profit merely by relying on the on-chain data could be biased because on-chain data does not cover the off-chain trading strategy. But it is still worth investigating the profit MEV bots could generate from an overview perspective.
We based the profit calculation on US dollars on our price index service. Note that if the price error is close to the difference between revenue and cost, it would highly influence the final output result, whether or not a bot generates profit. We believe the profit data is within the error limits based on the latest version of our price index.
Daily Profit Distribution
Figure 14 shows the daily profit distribution and the percentage to each other. Similar to the daily revenue trend, arbitrage and sandwich bots gain an average profit on most days and have a few lucky days to generate attractive wealth. What is the trading strategy of these ‘lucky’ bots? It is a good time to refer to the detailed analysis of transactions on EigenTx (Transaction Flow Chart | EigenTx:0x2a615005a63785284f11a4c5cb803d1935d34e358c10a3b4d76398d2e7bb2f9d)

Figure 14 Daily profit trend of MEV and their percentage to each other.
MEV Profit Distribution
The pdf of profit distribution follows the fat tail distribution. And the maximal profit of sandwich bots is at least two orders of magnitude smaller than arbitrage. Apparently, not all MEV bots can generate positive profit. Some MEV bots also suffer from loss due to transaction costs, which we will introduce next.
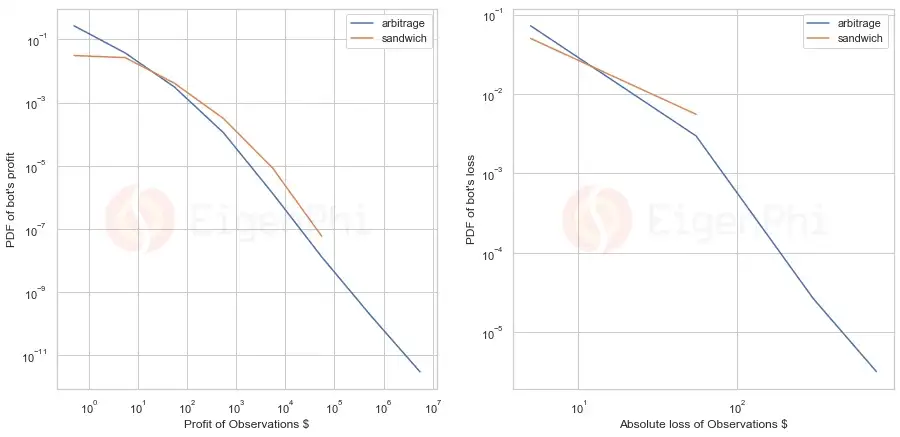
Figure 15 The PDF plot on profit and loss of oberservations
Cost
Before the introduction of Flashbots, the challenge for sandwich bots was to order their attacks by strategically setting the gas fee. MEV bots also participate in the gas fee auction market, and the fierce competition drives up the cost of gas fees very high. With the emergence of Institutions like Flashbots, it is now possible for bots to guarantee that their attack transactions order via off-chain auctions, and some of these auction costs convert into miner tips in the form of coinbase.transfer(). The gas fee and miner tips constitute the main explicit cost for MEV bots. We have compared the MEV cost with time, and the cost-revenue ratio.
MEV Cost With Time Since June (Daily)
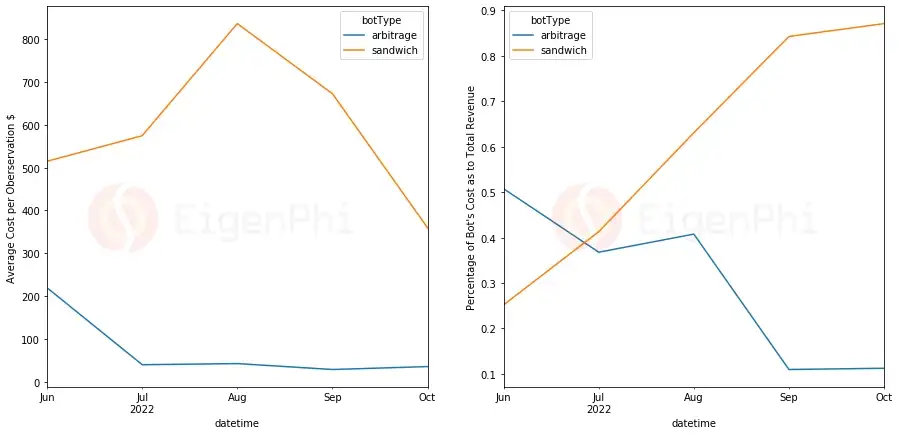
Figure 16 Monthly average cost per observation and the percentage to total revenue.
The cost of arbitrage is relatively stable and low compared with sandwich bots. The June cost is higher and relates to the volume peak on June 13. The trading volume and revenue peaked on that day, and so did the arbitrage cost.
The cost of sandwich bots fluctuates more intensely, and the average cost is much higher than arbitrage bots.
The proportion of revenue allocated to miners for arbitrage has kept decreasing since June.
However, the proportion of revenue allocated to miners for sandwich bots has grown significantly, approaching 90% in October, indicating an increasing competition for sandwich opportunities in Curve pools.
Pool
We have also investigated which pools are more likely to be involved in MEV activities.
The most popular pool for arbitrage in Curve (by arbitrage trading volume)

Figure 17 The top 10 Curve liquidity pools ranking by arbitrage trading volume(green). The total arbitrage transaction counts (orange) are also listed for comparison.
The pool that has involved the most trading volume is: 0xbebc44782c7db0a1a60cb6fe97d0b483032ff1c7
This is the typical Curve 3 pool with stable coin DAI/USDC/USDT, indicating that the stablecoins have been involved significantly during arbitrages in Curve.
But the Curve pool that provided the most arbitrage opportunities is (with most transaction counts):
0xd51a44d3fae010294c616388b506acda1bfaae46
This is the Curve pool with three tokens: USDT/WBTC/WETH.
The most popular pool for sandwiches in Curve (by sandwich trading volume)

Figure 18 The top 10 Curve liquidity pools ranking by sandwich trading volume(green). The total sandwich transaction counts (orange) are also listed for comparison.
The pool with the most trading volume for the sandwich bot is
0xD51a44d3FaE010294C616388b506AcdA1bfAAE46
This is the same pool with USDT/WBTC/WETH tokens that provide most arbitrage opportunities above. It experienced the most trading volume and is also the most favorite pool for attackers.
Profit breakdown investigation
We also present the histogram of several parameters grouped by pool address. The result also obeys fat tail distributions, which means a small bunch of pools is involved much more than the average level.
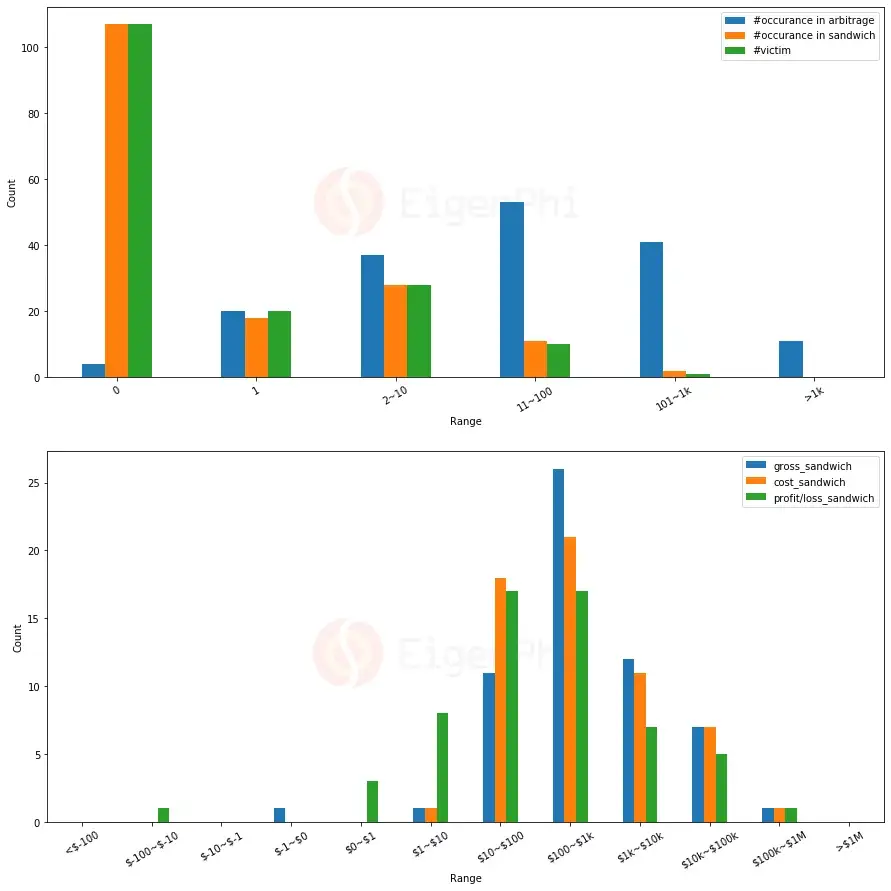
Figure 19 Histogram of the occurance/gross revenue/cost/profit of arbitrage and sandwich transactions grouped by pool address.
Participants
Investigations on the count of unique bots
In this section, we have provided the number of unique bot contracts participating in arbitrage and sandwich transactions. It’s better to illustrate how many entities are behind those contracts, and we are actively working on contract address affiliation. We will provide more investigation in future reports. But in this report, we will focus on using the unique contracts and compare them from an overview perspective looking at how many contracts have participated in MEV in Curve.

Figure 20 The left graph shows a monthly count of unique bot contracts for arbitrage and sandwich attackers. The right graph shows monthly count of unique addresses of sandwich victims.
The number of arbitrage and sandwich attacker’s contracts is relatively stable in the time range we investigate. But more and more victims have suffered sandwich attacks and losses since June, with an increasing speed of 300%.
Detailed Analysis of Different MEV Types
In this section, we provide deeper information on each MEV type.
Arbitrage Bots
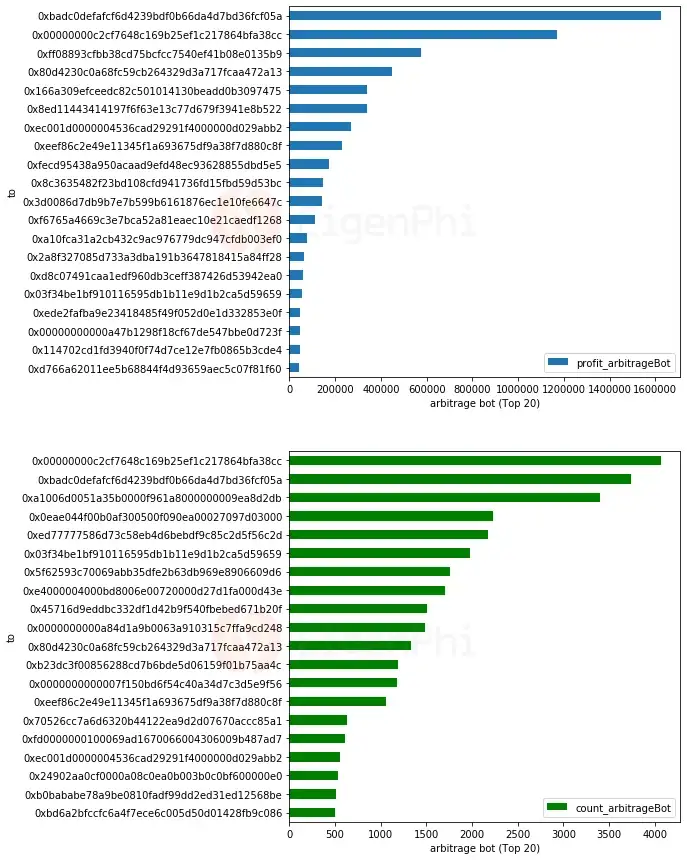
Figure 21 Top 20 arbitrage contracts sorted by total profit and counts
The plots show the top 20 arbitrage contracts, sorted by total profit and total activity count, respectively. We have also calculated the total profit generated by those contracts, and compared it with the total count of these bots that participated in arbitrage transactions. There is a positive relationship between total profit and total activity count. It is luck if a bot only conducts one arbitrage transaction and generates significant wealth. But most bots generate profit with a lot of effort.
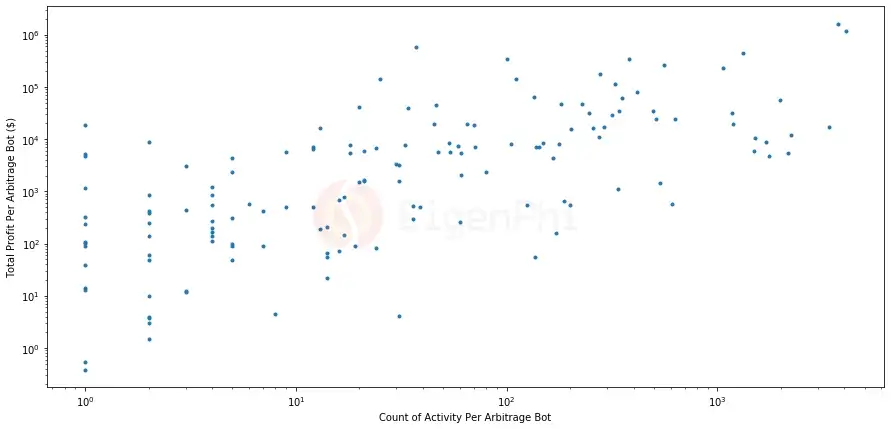
Figure 22 Correlation between total profit per arbitrage contract and count of activities per arbitrage contract.
We can observe the arbitrage transactions’ structure by counting the number of venues and the percentage of Curve pools involved. In most arbitrage observations, tokens are swapped between Curve pools and other venues.

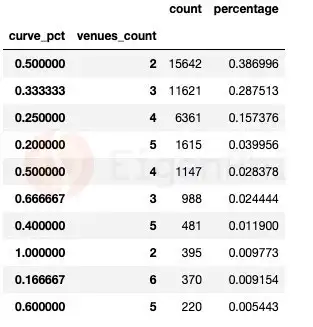
Figure 23 Percentage of Curve pools involved per arbitrage transaction
The most common arbitrage pattern is spatial arbitrage (where the venue count is 2), involving one Curve pool and another venue. This arbitrage type takes a percentage of 38.6%. The second primary common pattern is triangle arbitrage (where the venue count is 3), involving one Curve pool and two other venues.
There are also arbitrage transactions that only happen among Curve pools, where the curve_pct is 100%, indicating the participation of 100% of Curve pools in the arbitrage.
How complex could the arbitrage involving Curve pools be? A single arbitrage transaction can also involve 172 venues, where the Curve pool is one of them. (Transaction Flow Chart | EigenTx:0xd350fcce80d6aab3220b6bb2911e8bb55090d0f261f6cfde987c4433a6ec8cdd)

For the arbitrage transactions involving Curve pools, only 0.03% of the transactions contain taxed tokens. It is one magnitude lower than Uniswap. Since Curve pools do not contain taxed tokens, the result compared with Uniswap is reasonable. Those bots can find wealth even in taxed tokens, and all of them make positive profits.

Sandwich Bots
Only 19 sandwich bot contracts have initiated sandwich attacks in Curve pools. We provided their total profits and total activity counts in Figure 27. The effort pays off since the most active attacker is the second most profitable bot. However, the most profitable sandwich bot has only launched 14 sandwich attacks, using only 2 transactions to generate a total profit of more than $46k in the Curve stETH pool.
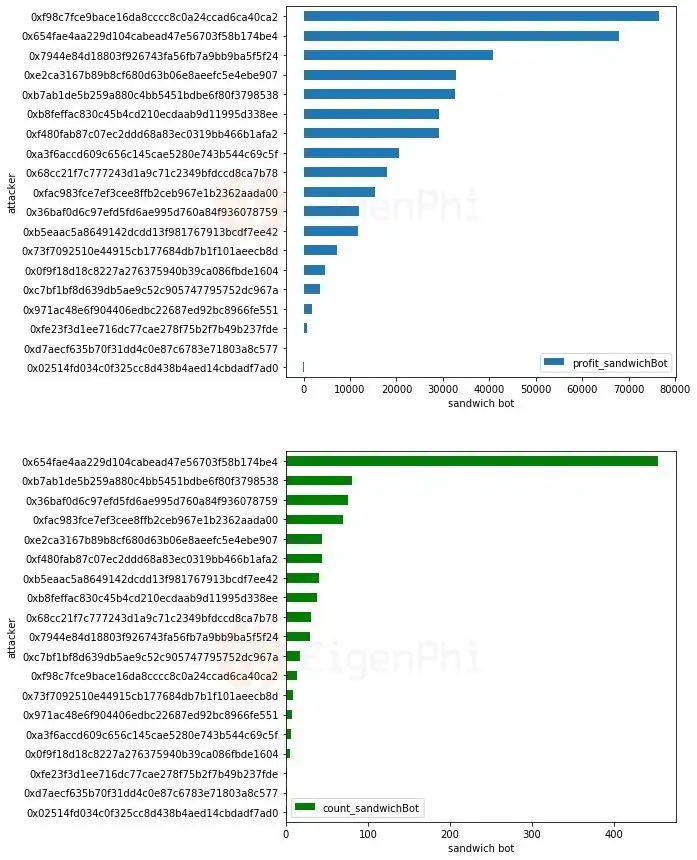
Figure 24 Top 20 sandwich attacker’s contracts sorted by total profit and counts
We have also compared the volume distribution of victim and attacker using a boxplot. As shown in the figures, the person conducting trading in Curve pools wouldn’t become a victim until the input volume is more than $100.
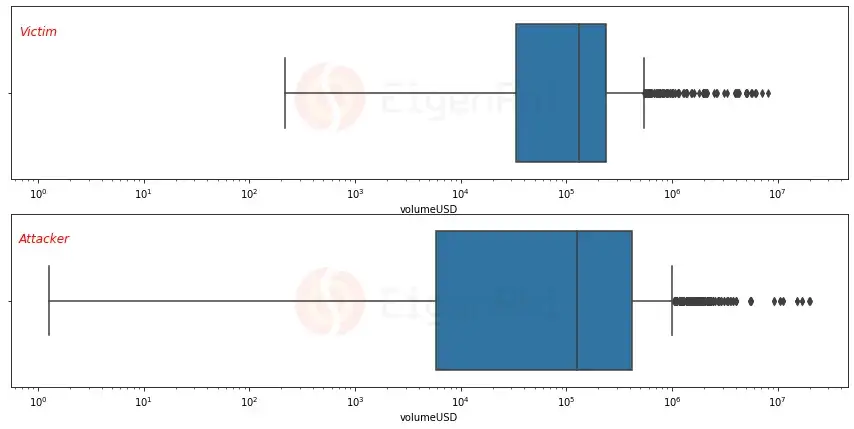
Figure 25 Boxplot distribution of the volume per transaction for sandwich victim and attacker
There are two attackers with input volume smaller than $100, and the revenue generated by sandwich attacks is negative. The rest of the attacks with a volume larger than $100 start to generate positive revenue.
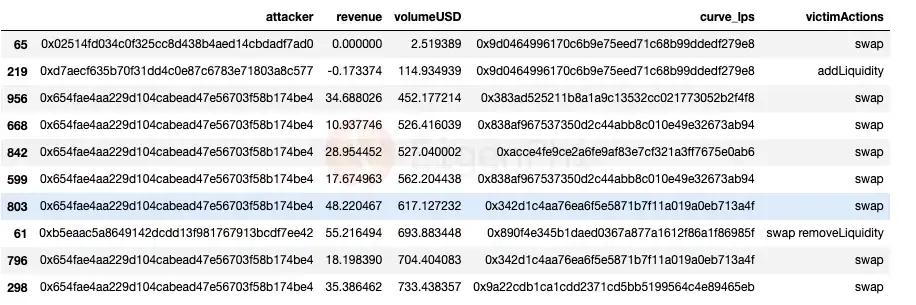
Here is the distribution of the volume for both attacker and victim. The majority of volume size prone to getting sandwiched is in the 10k to 1m range. Most of the attacker’s volumes concentrate in the 100k-1m range.

Figure 26 Histogram distribution of the volume per transaction for sandwich victim and attacker
We hope the investigation of volume distribution for attacker and victim could shed light on the design of slippage tolerance when conducting transactions in Curve liquidity pools.
Victims
When we identify the sandwich attack among the transactions on-chain, we also record the behavior of the victim when they got sandwiched. One common understanding of sandwich attacks is when the victim is exchanging tokens in a liquidity pools. But it is worth noticing that when the victim launches transactions like adding liquidity into the pool or removing liquidity from the pool, there is also chance that someone will attack him.
As shown in Figure 27, only 86% of sandwich transactions happened when the victim exchanged tokens in the Curve pool. The rest of the transactions contain the steps of adding/removing liquidity. For example, 63 sandwich transactions attacked their victim while they were adding liquidity to the Curve pool, which takes 6.5% of all sandwich transactions. Note that the average revenue generated from attacking victims when they were adding/removing liquidity is also considerable. Since Curve has a meta pool allowing one token to trade with another underlying base pool, the victims’ behavior could be a combination of swap and add/remove liquidity in the pool.
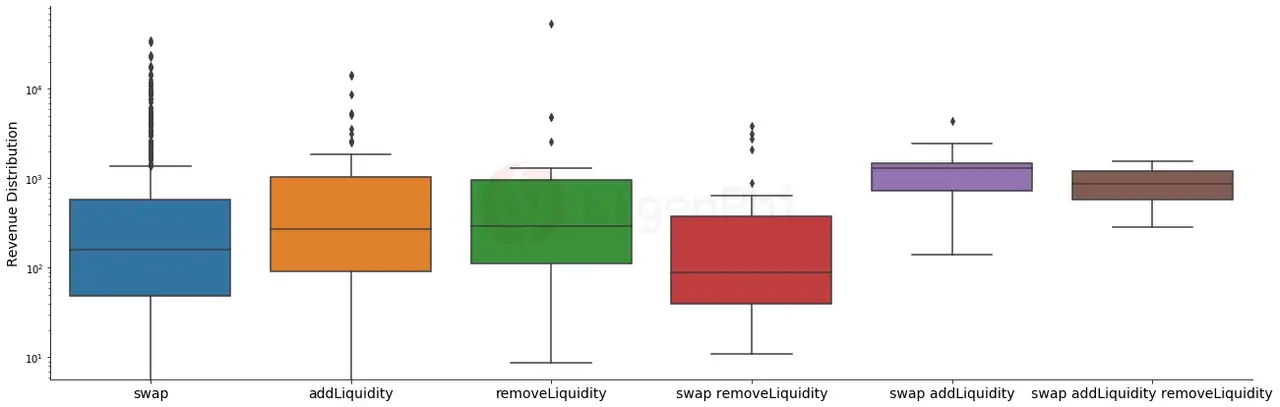
Figure 27 Tx counts and revenue break down by the victim’s actions when they get sandwiched
We have also calculated the counts of sandwich attacks in the percentage of total MEV types and compared the data with the report we have released on Uniswap. Sandwich attacks are less possible in Curve pools than in Uniswap. But it is worth noticing that the percentage of sandwiches in Curve keeps increasing in the time range we inspected.

Figure 28 The percentage of sandwich transactions counts in all MEV types.
Conclusion
From the above analysis, we can see that we cannot ignore the MEV impact on Curve. Understanding past MEV behaviors and trends could help stakeholders to better predict MEV’s future long-term influence on AMM.
Here are some interesting points we have concluded, hoping to enlighten the design of protocols and trading decision-making for stakeholders and together make a better DeFi world:
- Revenue — Arbitrage bots have generated more than $10 M in revenue from transactions that involved Curve pools, with total arbitrage counts of 40419. Sandwich bots extracted $ 0.98 M revenue from the victims trading in Curve pools, with total sandwich counts of 970. For sandwich bots, most of the revenue of a single transaction is higher than arbitrage bots, but the total revenue each month for arbitrage bots is one magnitude larger than the sandwich bots. There are no apparent interest conflicts between arbitrage agents and sandwich agents.
- Volume — The MEV volume accounted for 20% of the total volume on most days. The average volume of a single sandwich transaction is one magnitude larger than an arbitrage transaction. Compared with the volume distribution of arbitrage and sandwich, the median volume of sandwich attacks is one magnitude larger than arbitrage’s volume.Curve enables its pools to suffer less slippage in the stablecoin, which means the attacker will need to input more volume to initiate a price slippage for a sandwich attack. There is a positive relationship between the revenue extracted and trading volume for sandwich and arbitrage bots.
- Frequency — The activities for sandwich bots are significantly less than arbitrage bots. The result shows the occurrence of trading opportunities for arbitrage is relatively related to the intensity of market price fluctuations. However, the opportunities for sandwich bots do not seem to correlate with price fluctuations in the market.
- Profit — Arbitrage and sandwich bots gain an average profit on most days and have a few lucky days to generate significant wealth. The pdf of profit distribution follows the fat tail distribution. And the maximal profit of sandwich bots is at least two orders of magnitude smaller than arbitrage. Not all MEV bots can generate positive profit. Some also suffer losses.
- Cost — The arbitrage cost is relatively stable and low compared with sandwich bots. The cost of sandwich bots fluctuates more intensely, and the average cost is much higher than arbitrage bots. The proportion of revenue allocated to miners for arbitrage has decreased since June, but for sandwich bots the proportion kept increasing, approaching 90% in October, indicating an increasing competition for sandwich opportunities in Curve pools.
- Pools — The pool with three tokens: USDT/WBTC/WETH, provided the most arbitrage opportunities and is also the favorite pool for attackers. The pool with the most trading volume is the stablecoin pool: DAI/USDC/USDT. From the profit distribution, we can see that a small group of pools is involved much more than the average level.
- Participants — In the time range we investigated, the number of arbitrage and sandwich contracts is relatively stable. But more and more victims have suffered sandwich attacks and losses since June, with an increasing speed of 300%.
- Arbitrage Bot Details — There is a positive relationship between the total profit of arbitrage bot contracts and the total activity count. The most common arbitrage pattern is spatial arbitrage (where venue count is 2), involving one Curve pool and another venue. There are also arbitrage transactions that only happen among Curve pools. A single arbitrage transaction can also involve 172 venues, where the Curve pool is one of them. Only 0.03% of the arbitrage transactions contain taxed tokens. It is one magnitude lower than Uniswap.
- Sandwich Bot Details — Only 19 sandwich bot contracts have initiated sandwich attacks in Curve pools. The most profitable sandwich bot has only launched 14 sandwich attacks, using only 2 transactions to generate a total profit of more than $46k in Curve stETH pool. A person trading in Curve pools wouldn’t become a victim until the input volume is more than $100. Attackers won’t generate positive revenue until the input volume exceeds $100. It is worth noticing that token exchangers could be sandwich victims in the Curve pool. But those adding/removing liquidations to/from Curve pools could also be attacked, where the revenue generated from those victims is considerable. Compared with Uniswap, sandwich attacks are more challenging to execute in Curve pools. But it is worth noticing that the percentage of sandwiches in Curve keeps increasing in the time range we inspected.
Methodology
Data Source
We base our analysis on the raw block data fetched from the full Ethereum node we built. The data range of our investigation is from block number 14881677(include) to 15871479(include). We decode the raw data to get the fine-grained data field we need.
To compare certain parameters with the overall market situation and Curve’s macroscopic parameters, we adopted data from third parties as listed below:
- ETH’s historical close price from Coinmarketcap. https://coinmarketcap.com/currencies/ethereum/historical-data/
- Curve’s fee revenue from dune: 🏆Curve.fi trading fee per day
- Curve’s total trading volume per day: 📈Curve.fi total trading volume per day
How Do We Identify Bots?
- We consider a transaction to be a collection of asset transfers, and we use a set of rules to see if an MEV activity has happened by assessing the outcomes of these transfers. The rule of thumb is that there is more than one transfer (or swap) in the transaction, and the trader ends up with a surplus.
- To identify different types of MEV activity, we collect observations obeying our heuristic rules for each type in the current stage, and we continue enhancing our algorithms according to false negative or false positive detected by comparing the sample results with those from MEV-inspect each day.
- In this report, we identified two types of MEV type for Curve pools. The total number of observation results for arbitrage bots is 40419 and sandwich bots is 970. The investigation time range is from Jun 1, 2022, to Oct 31, 2022.
How Do We Calculate Profit and Cost?
- We are constantly optimizing our price index algorithm. For mainstream stable coins (USDT, USDC, DAI) and assets with relatively good liquidity (ETH, WETH, WBTC), the AMM and on-chain oracles can provide a relatively reliable quote source. With these mainstream assets’ prices settled down, we further calculate the prices of other tokens based on the swap ratio at the time of calculation.
- We only consider on-chain costs for each transaction detected. The calculation process is summing up the gas fee and the *coinbase.transfer() *value (if there is any) of each transaction and convert the result to USD based on the ETH’s price.
Disclaimer
The “Information” contained in this post has been prepared solely for informational purposes, is in summary form, and does not purport to be complete. The Information is not, and is not intended to be, an offer to sell, or a solicitation of an offer to purchase, any securities. The Information does not provide and should not be treated as giving investment advice. The Information does not take into account specific investment objectives, financial situation or the particular needs of any prospective investor. No representation or warranty is made, expressed or implied, with respect to the fairness, correctness, accuracy, reasonableness or completeness of the Information.
We do not undertake to update the Information. It should not be regarded by prospective investors as a substitute for the exercise of their own judgment or research. Prospective investors should consult with their own legal, regulatory, tax, business, investment, financial and accounting advisers to the extent that they deem it necessary, and make any investment decisions based upon their own judgment and advice from such advisers as they deem necessary and not upon any view expressed herein.
*We are open to discussion. Please feel free to contact us via contact@eigenphi.com.