SparkDAO is an investment research group focusing on the field of digital encryption, with members distributed all over the world. We are keen to explore the underlying logic and cutting-edge tracks in the field of digital encryption. Welcome to our Twitter: sparkdao_io

Is it either a bull market or a bear market right now?People always want intuitive data to be available for reference.We have selected multiple indicators for you to judge the status of the current market (the following indicators are all on March 31,2022 data):
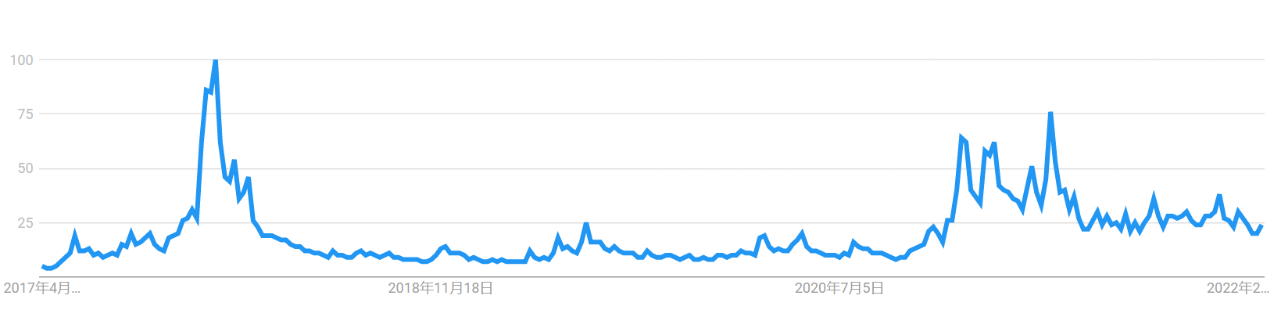
1.Google Search Index
BTC search popularity in the past 5 years:
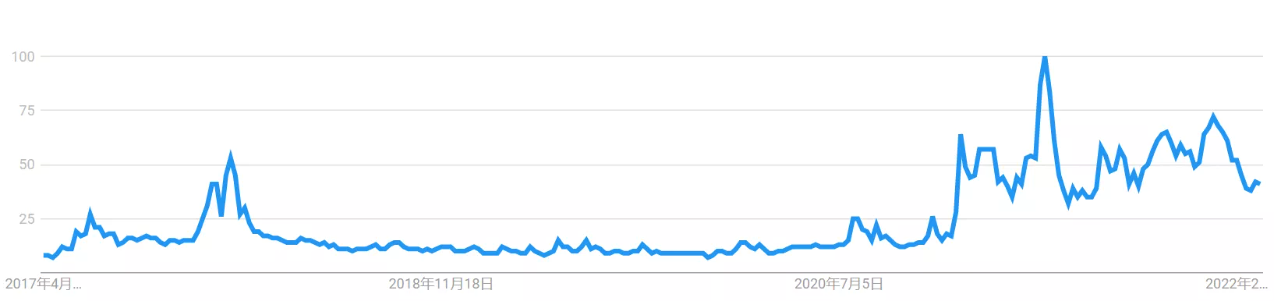
ETH search fever in the last 5 years:
2.S2F model
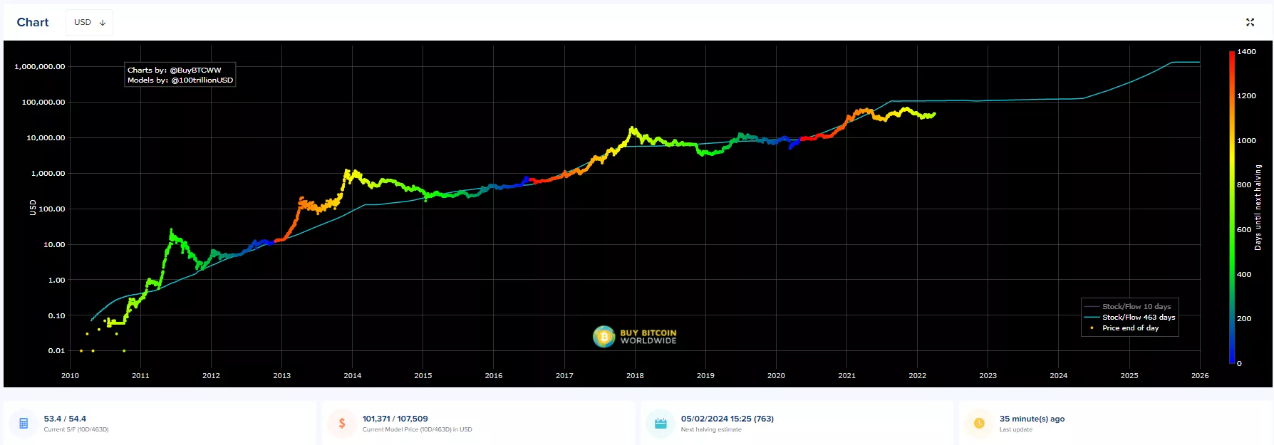
According to the model, the current estimated price of BTC should be over $100,000, the current actual price of about $47,000, a large deviation. If the model works, prices are significantly undervalued.
3.Btc-ahr999 Currency Index
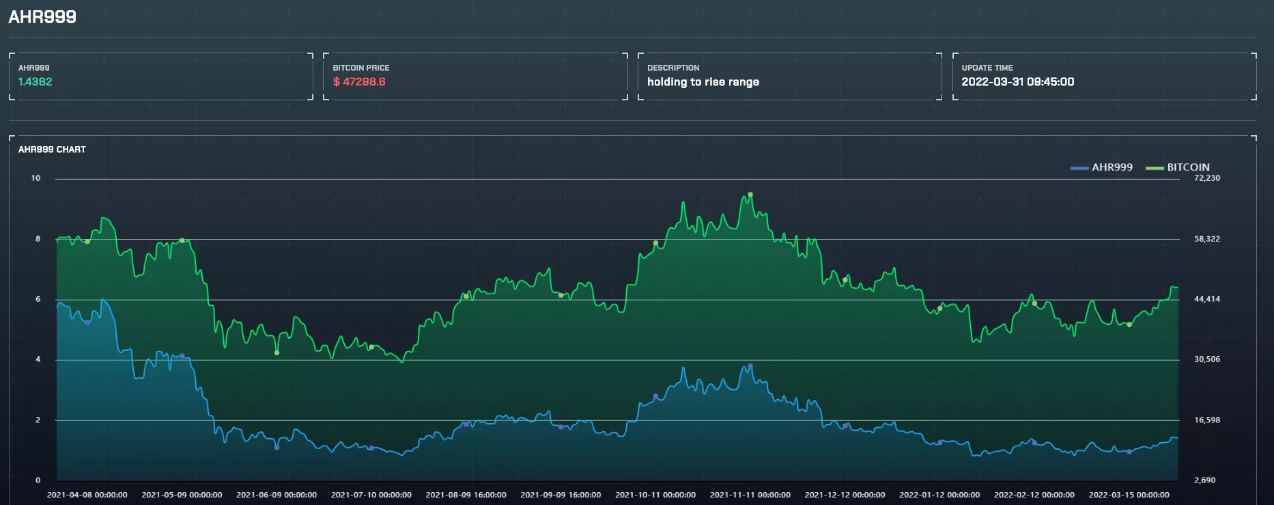
The index measures the price of a bitcoin and the timing of purchases. Value < 0.45 is the bottom-hunting range, 0.45-1.2 is the fixed-investment range, 1.2-5 is the bull market range and > 5 is the high-risk range. The current number rebounded to 1.43, returning to bull territory.
4.Two-year MA multiplier indicator
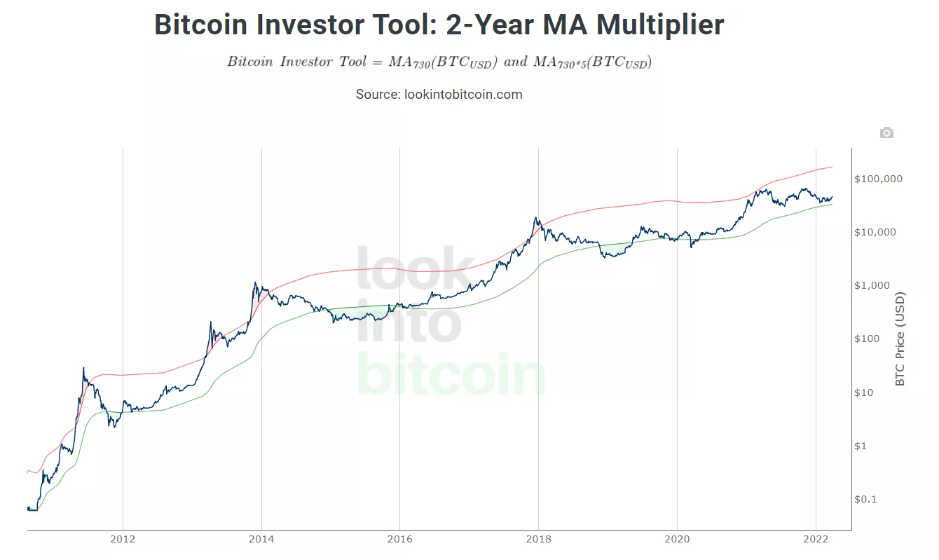
The indicator shows that bitcoin has gained significant support near the Green Line (buying area) and is beginning to rebound.
5.Bitcoin rainbow band
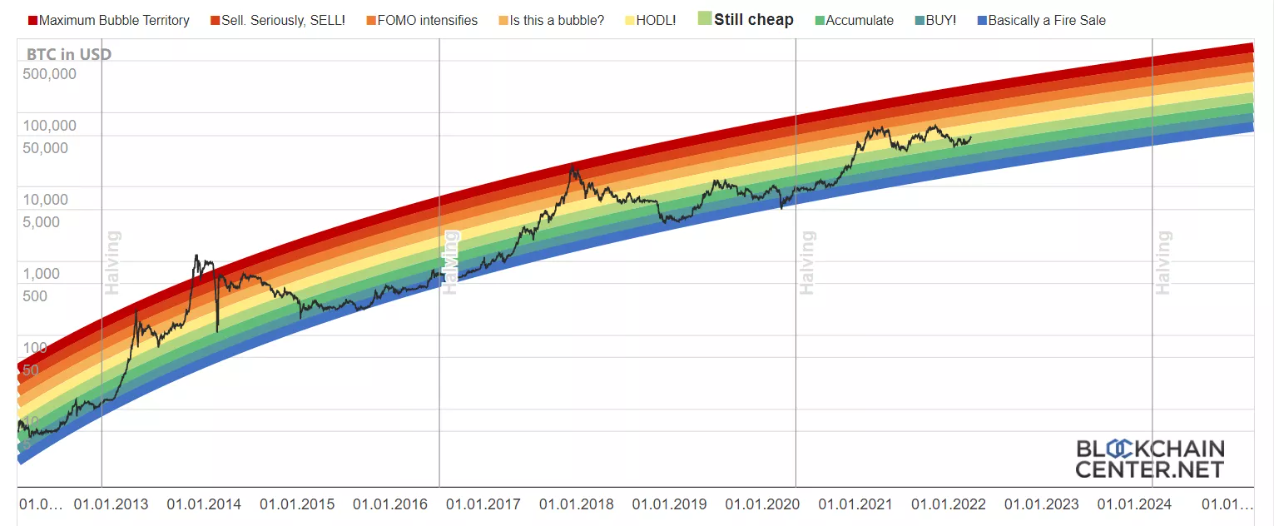
The indicator rebounded to light green (cheap) areas and light yellow (hold-RRB- areas.
6.NUPL indicators
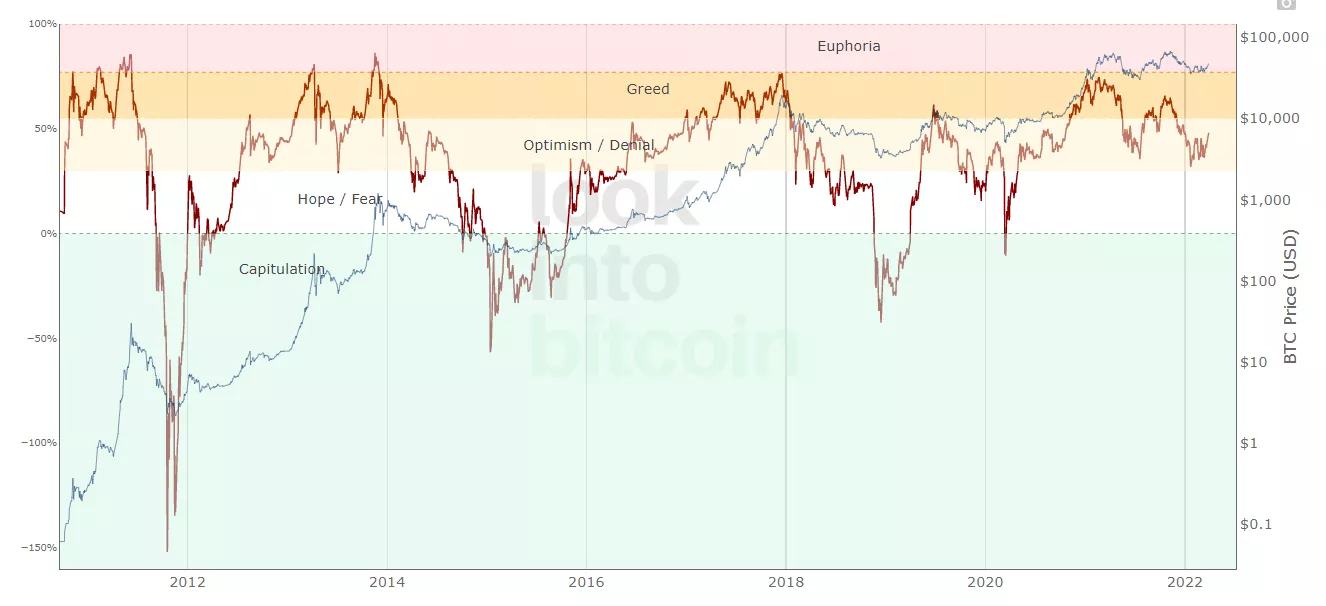
The indicator rebounded from near the white (fear) area to the positive range.
7.Puell Multiple index
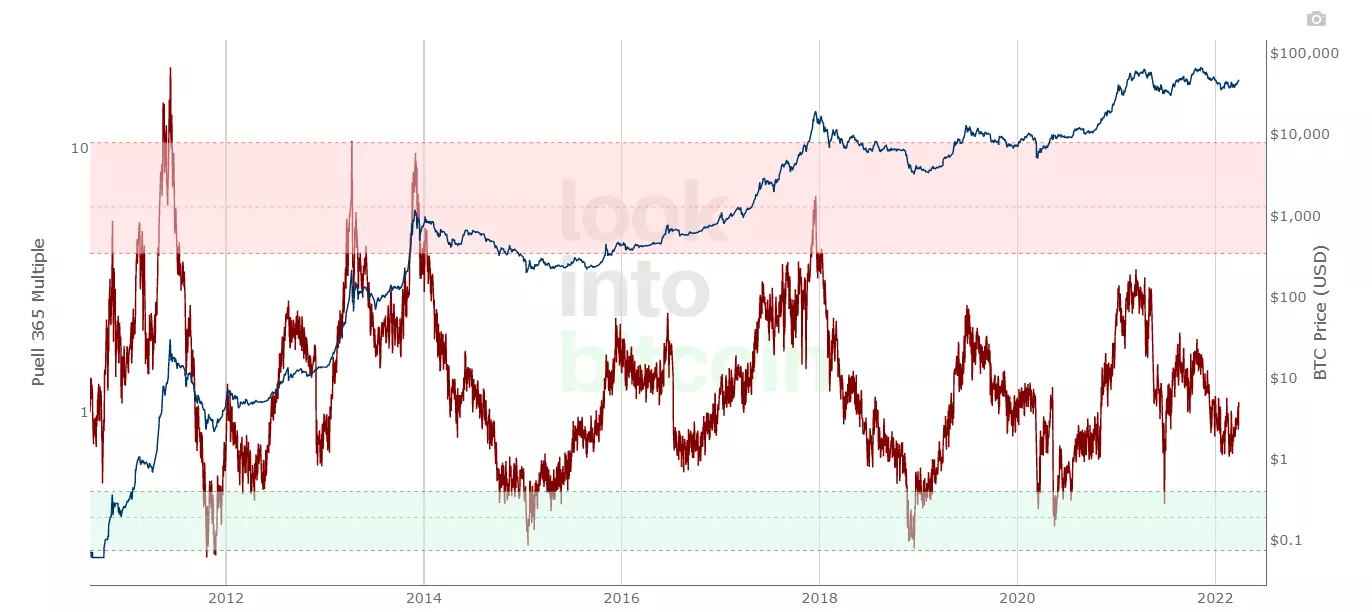
The green area is the buy signal and the red area is the sell signal. The indicator shows that the current relatively close to the buying area.
8.MVRV indicators
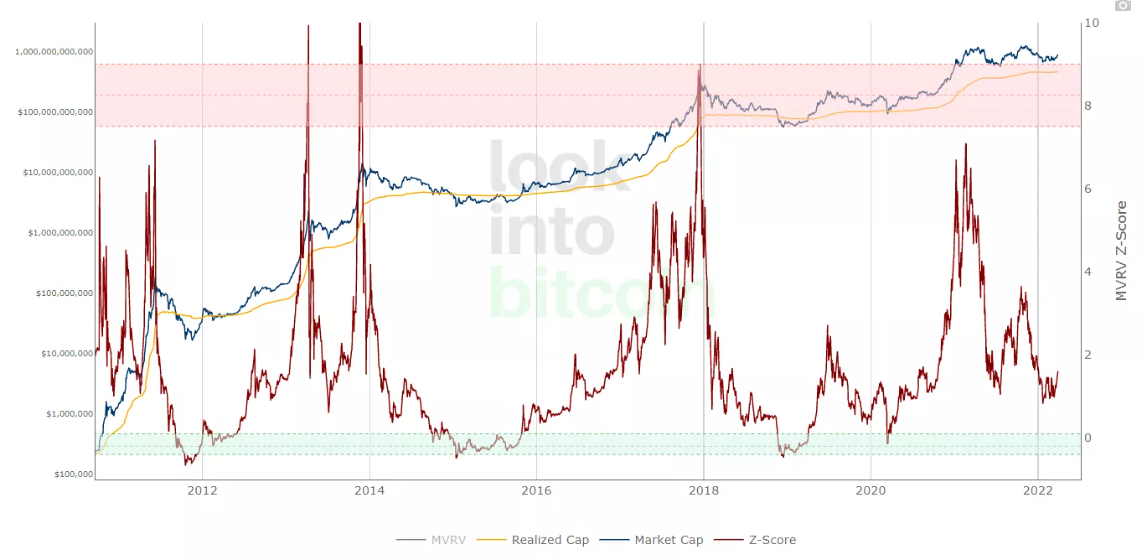
The index rebounded to near 1.6(high risk above 7, super bottom below 0.1) .
9.Rhodl Index
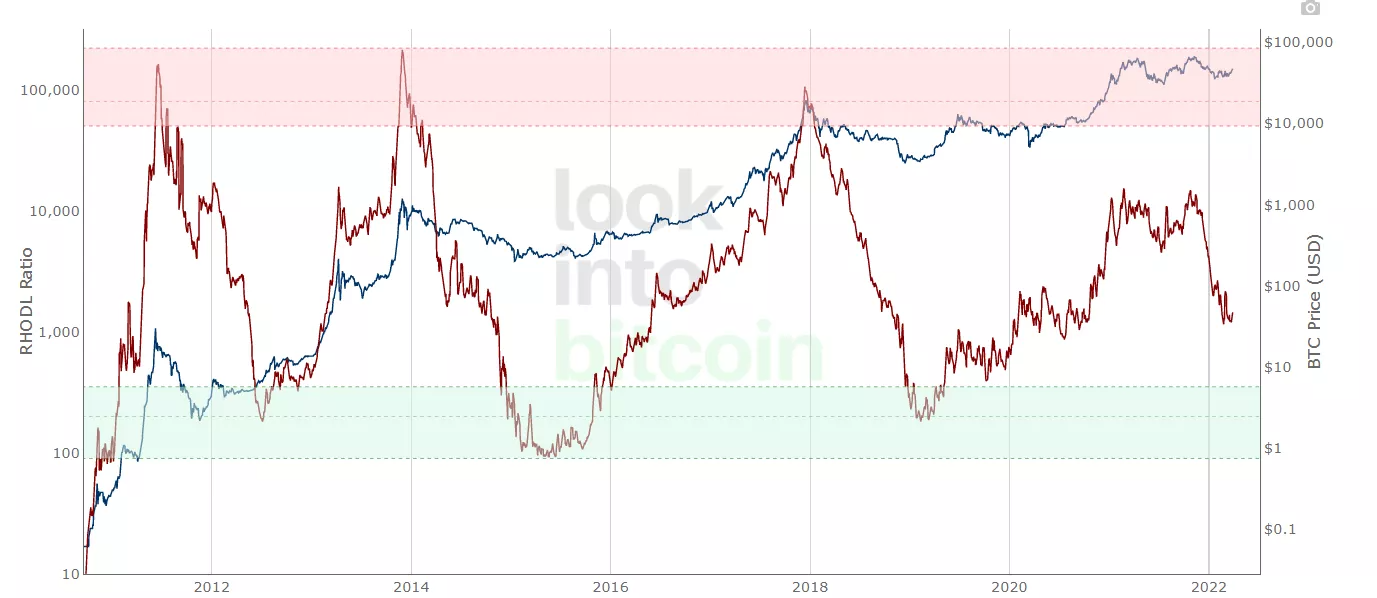
The index has fallen back to a neutral buying area.
10.Jiang Zhuoer 60-day accumulated BTC gains
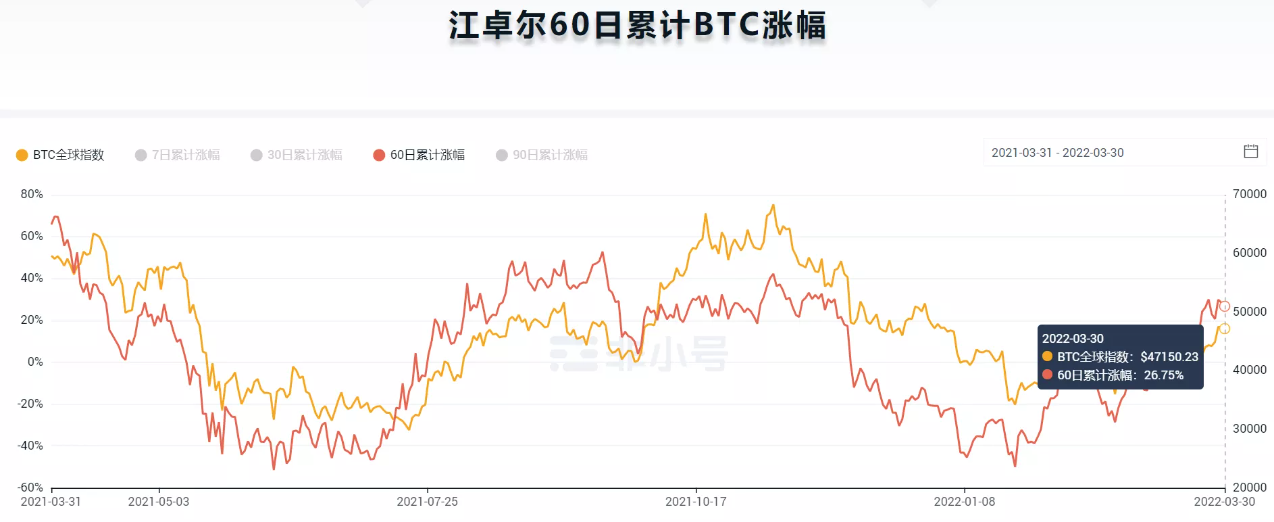
The index believes that when a bull market culminates in a frenetic, frothy one in which short-term money rises faster than new money enters the market, the bull market bubble will burst and the bear market will begin.
At the peak of the two bull markets in 2013 and 2017, the Index was 237 per cent and 134 per cent respectively. In the current bull market, when Bitcoin rose to $47,000, the index peaked at 108% and fell to 34% as it continued to rise to $64,000. At present, the target is 26.75 per cent.
11.Reserve risk
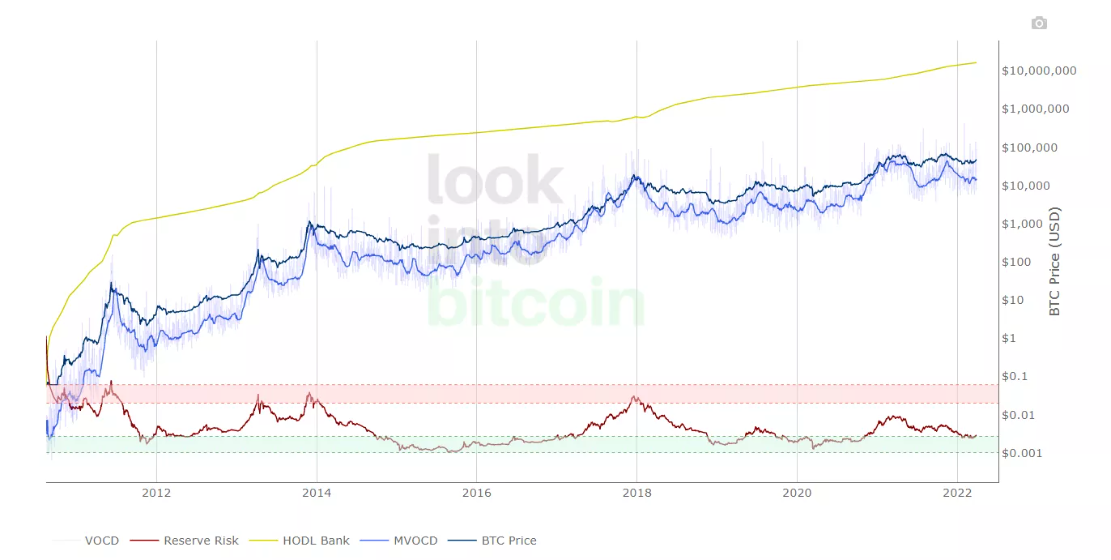
Reserve risk measures can reflect long-term bitcoin holders'confidence in the price of a bitcoin at any given time.
Investing in bitcoins has a higher return on risk when confidence is high and prices are low (green areas) ; conversely, investing in bitcoins when confidence is low and prices are high (red areas) generates losses.
The indicator shows that at the height of the current bull market, Bitcoin was still a long way from the red zone (the top signal) . Currently in the Green buy-in Zone.
12.Number of BTC held by institutional funds
Funds include Bitcoin etfs in Europe and Canada and Closed-end fund in the United States and Canada.
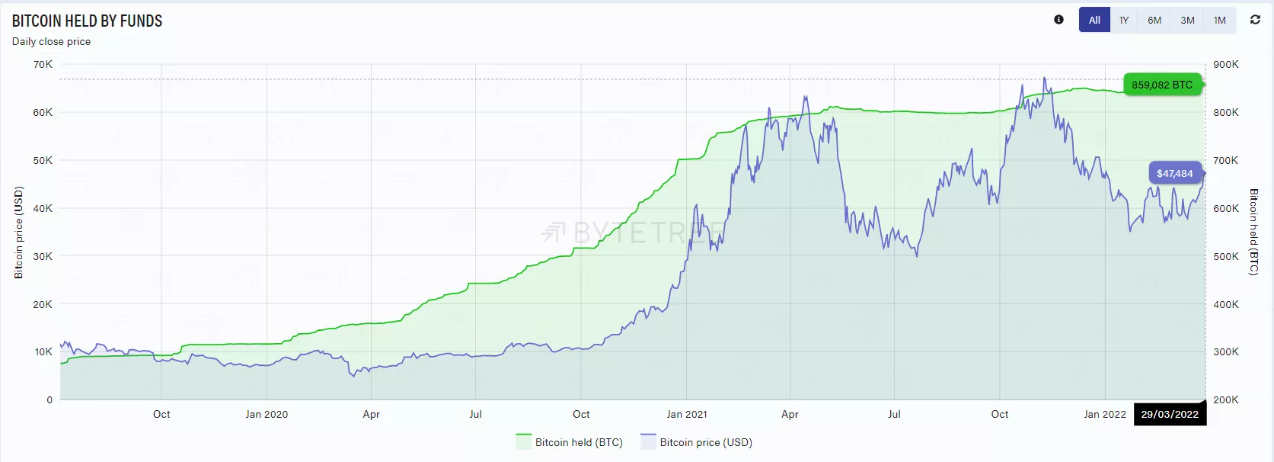
On March 31st it stood at 859,082, about 6,500 more than the last update (852,549) .
13.Location of whale wallet
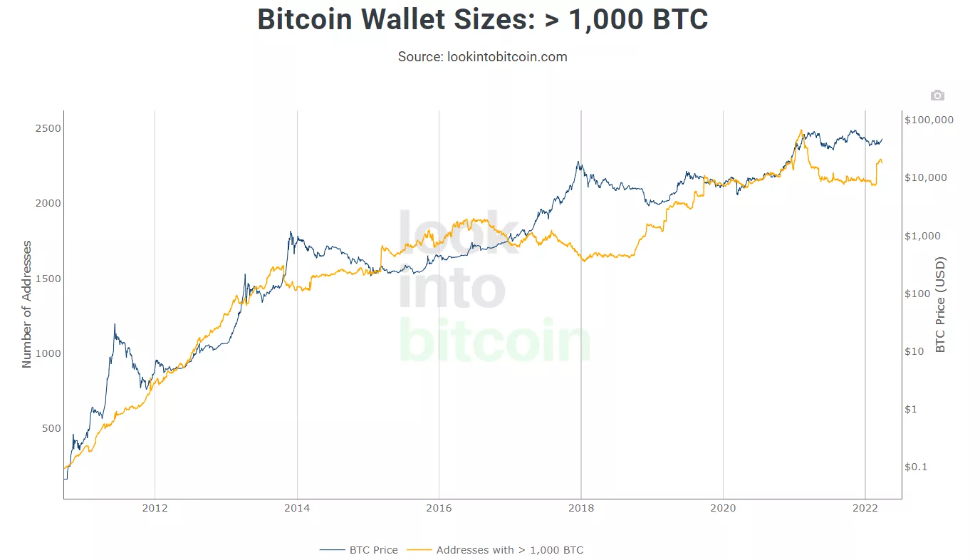
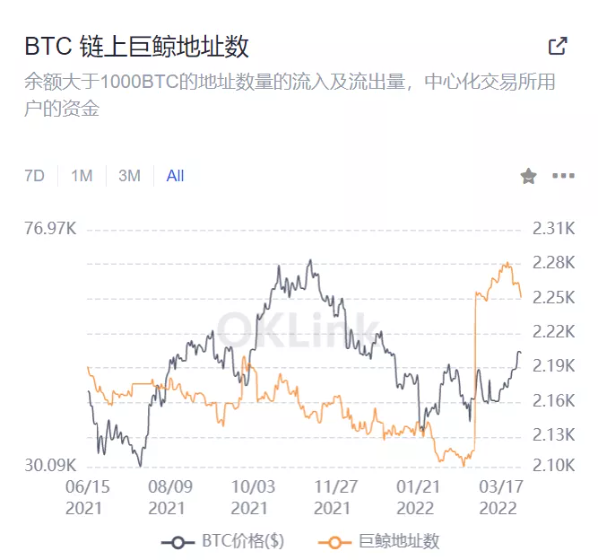
After a recent surge from 2,100 to 2,280, the population has fallen back to 2,251.
14. 1Year+ HODL Waves
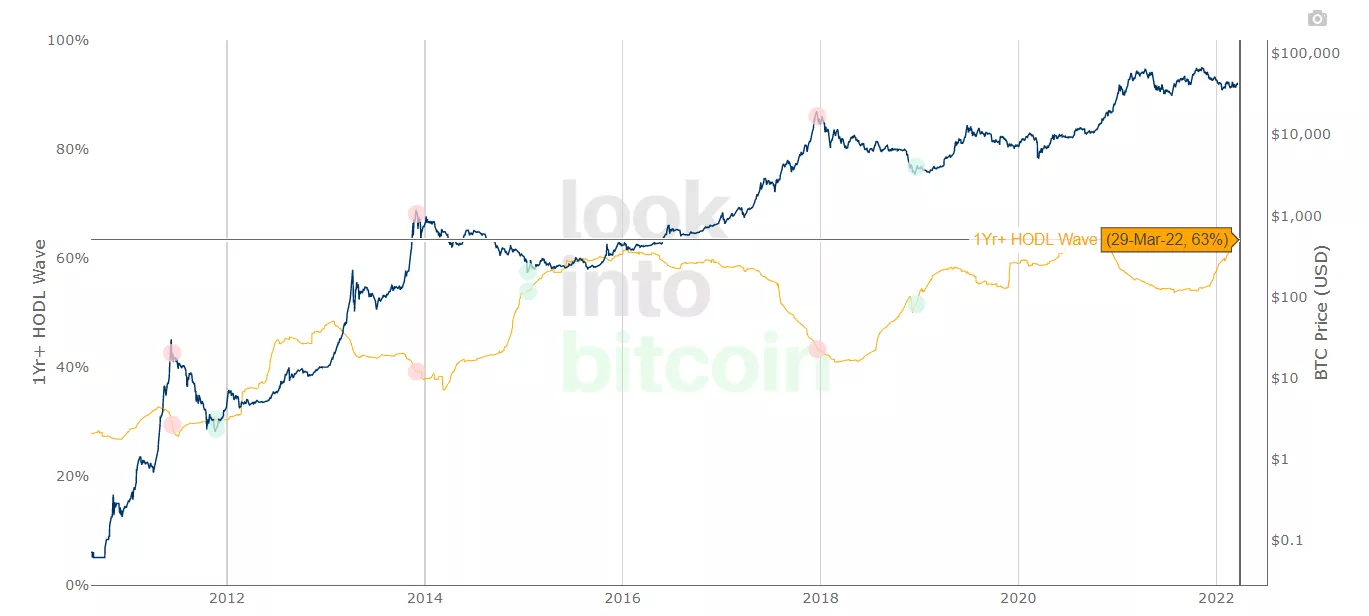
More recently, that figure has risen to 63% (less than 45% is historically high-risk) .
15.Total Holdings of BTC by listed companies
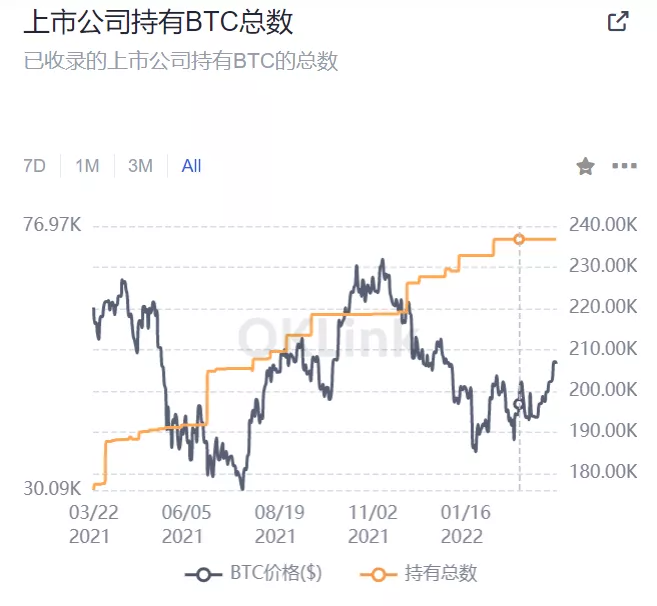
The total number of btcs held by listed companies is 40,000 more than in May last year, although prices are well below their all-time highs.
16.ETH institutional position
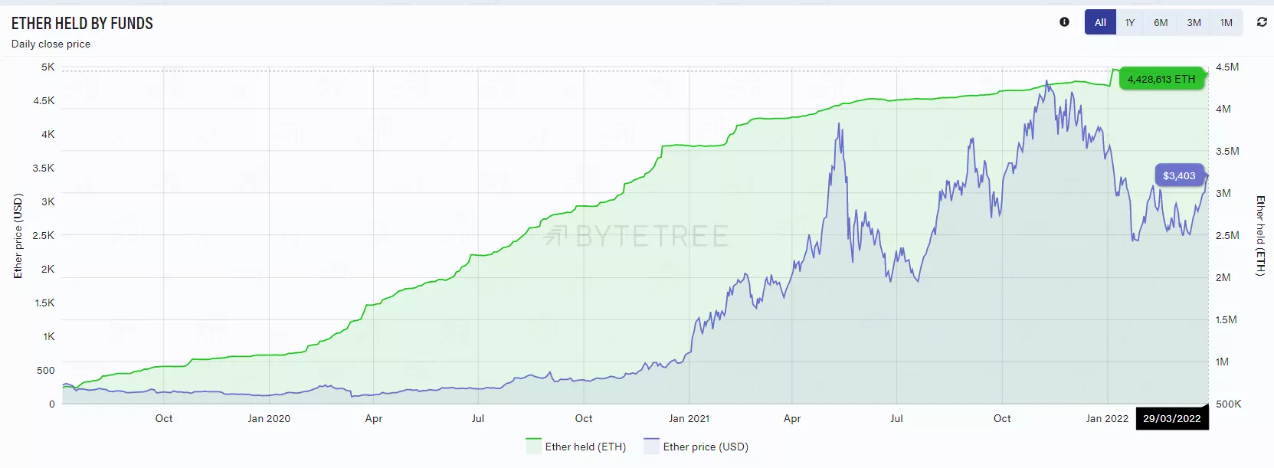
The ETH institutional position fell from a high of 4.47 million to 4.4 million.
List of institutions: Grayscale Eum Trust (Ethe) , Ether Tracker (COINETHE SS) , Ether Tracker One/XBT Eum (Coineth) , coenshares Physical ETHEREUM (the SW) , wisdomethereum (eth SW) , vanecheck Vectors ETHEREUM ETN (VETH) , ETC Physical Group Ethereum (Zeth) , SA1 Ethereum ETP (Seth SW) , 21ethereum ETP (Aseth) , Ci Ethereum ETF 21010, Galaxy Ethereum ETF (ETHX/U) , Galaxy Ethereum (c $UNETHEREUM Series)
17.Stable money market value
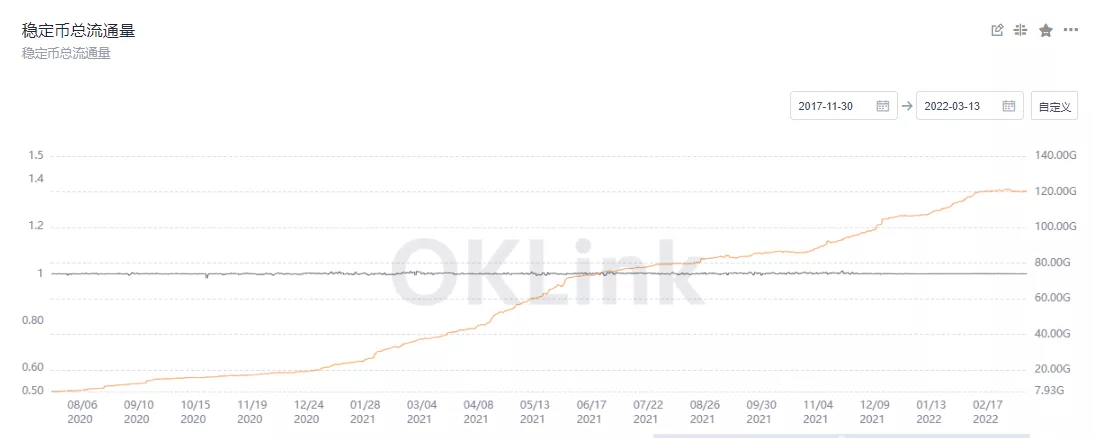
2021, the rate of growth of the stable money market value slowed from June to the end of July and began to rise in August and is now stable at a high level.
18.Ethereal Square Rainbow Belt
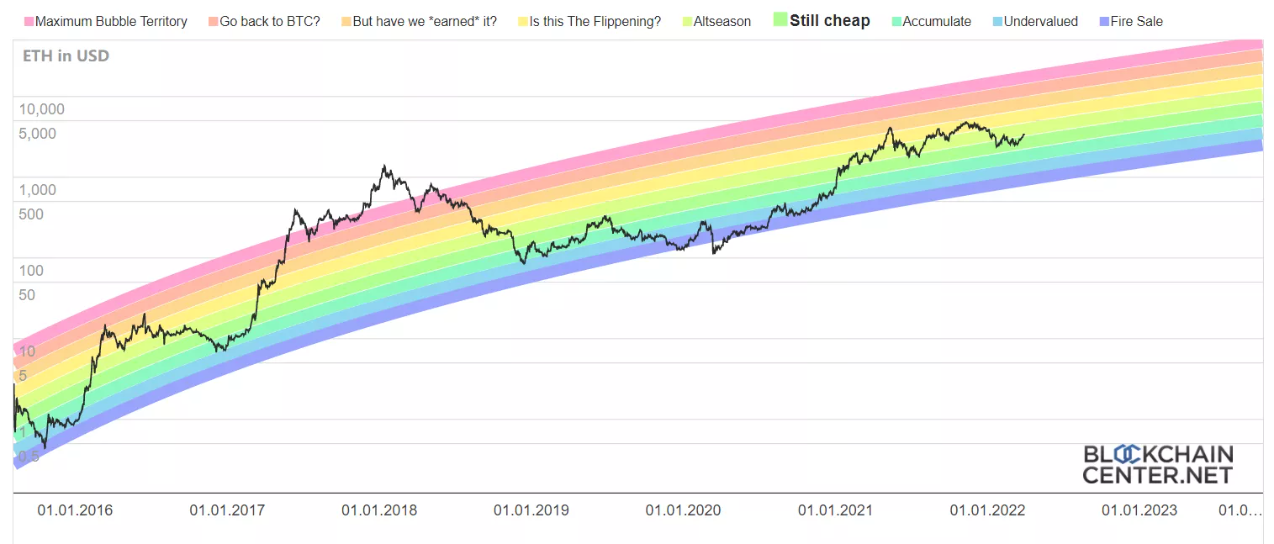
Ethereal Square rainbow band bounces from "cheap" area to "Shanzhai season" area.
19.BTC exchange balance
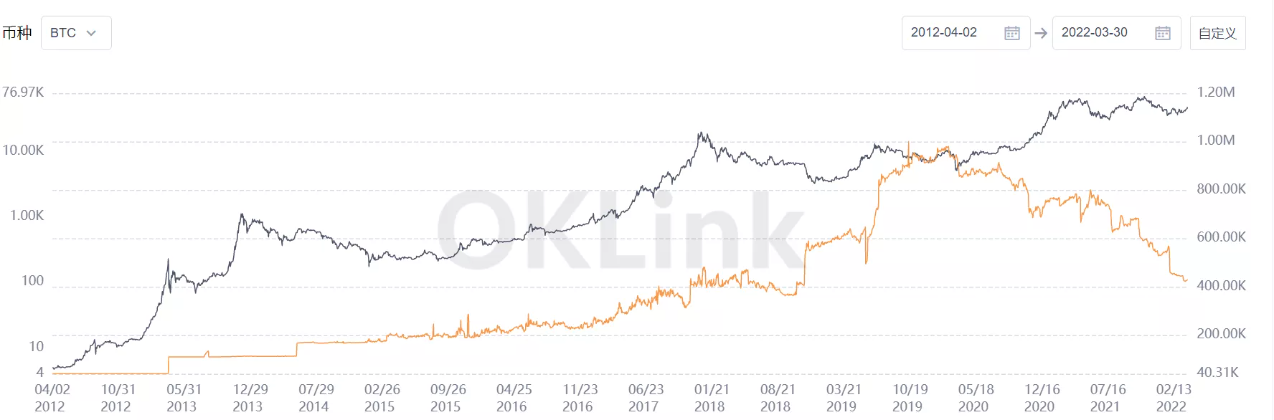
The balance on the BTC Exchange has fallen from 568,000 to 429,000 in the past two months.
20.ETH exchange balance
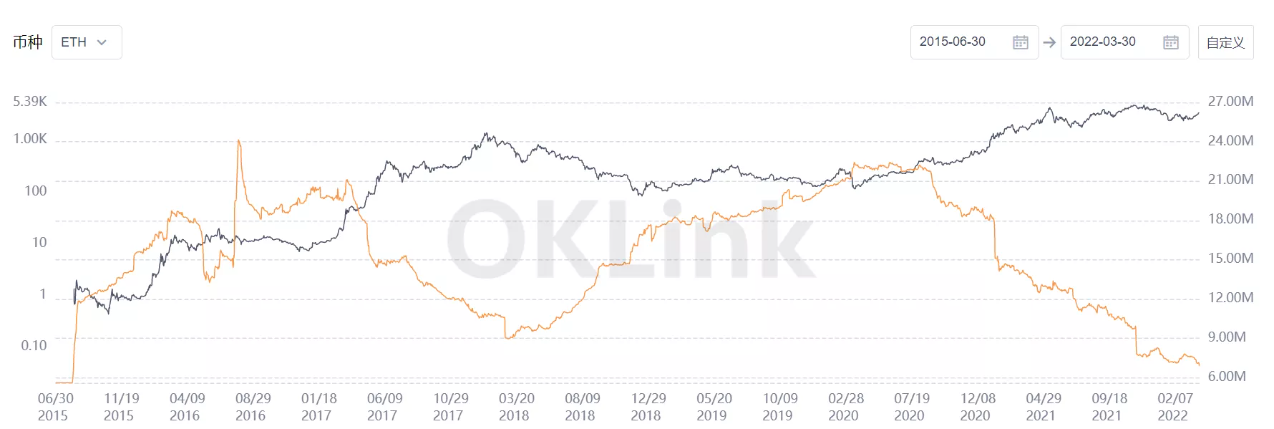
The ETH's balance has fallen from 8 million to 6.89 million in the past month.
[ note: All the above indicators are as at March 31,2022]
Other metrics: (source: some paid data shared by Twitter bigv)
BTC, ETH wallet address change (March 29 data)
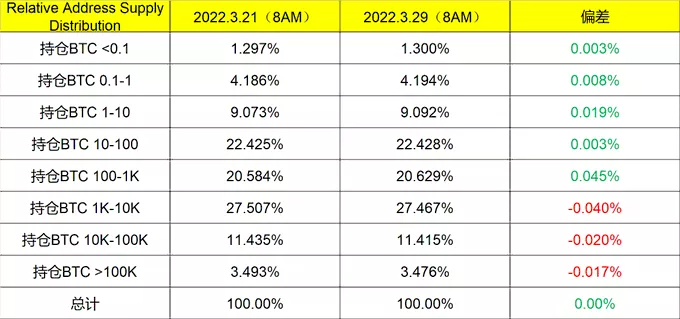
Overall change is not big, buying and selling action is more cautious.
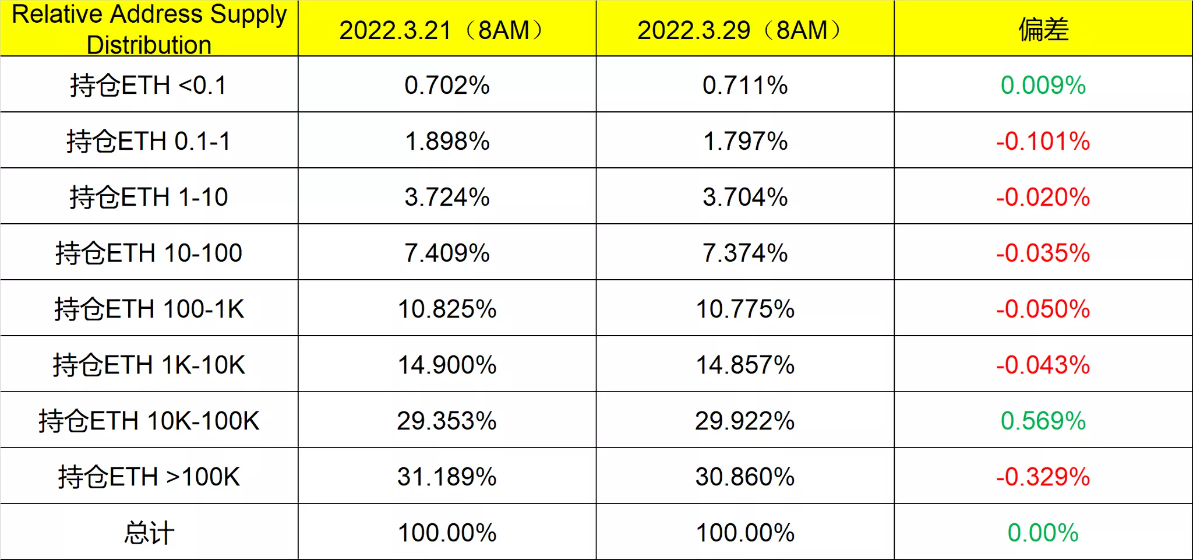
Except for a slight increase in individuals with less than 0.1 ETH, almost all of the bands were underweight, and almost all of the underweight chips went to the ETH whale. The 10k-100k whale was the most underweight. (> 100K addresses are mostly exchanges, and a sell-off means ETH is out of the market and into the wallet.)
*The views and opinions expressed here are solely those of the author and do not necessarily reflect the views of SparkDAO. Every investment and trading move involves risk, you should conduct your own research when making a decision.