
Preamble
Welcome to our dashboard, which aims to provide a comprehensive analysis of the impact of the ongoing conflict between Russia and Ukraine on the global economy, with a specific focus on Bitcoin as a major cryptocurrency index. As analysts, we recognize the importance of staying informed about current events and how they can affect the global economy.
In recent years, the ongoing conflict between Russia and Ukraine has been one of the most worrying things going on.So, we decided to make this dashboard to learn more about how this war is affecting the global economy, especially when it comes to cryptocurrencies.
Our dashboard will evaluate weekly transactions, unique active and new users, volume changes, and other relevant economic indicators affected by this conflict since 2021 and compare them before and after the war event. We aim to provide insights that will help investors and decision-makers navigate this complex economic landscape with greater confidence and understanding.
Price Changes
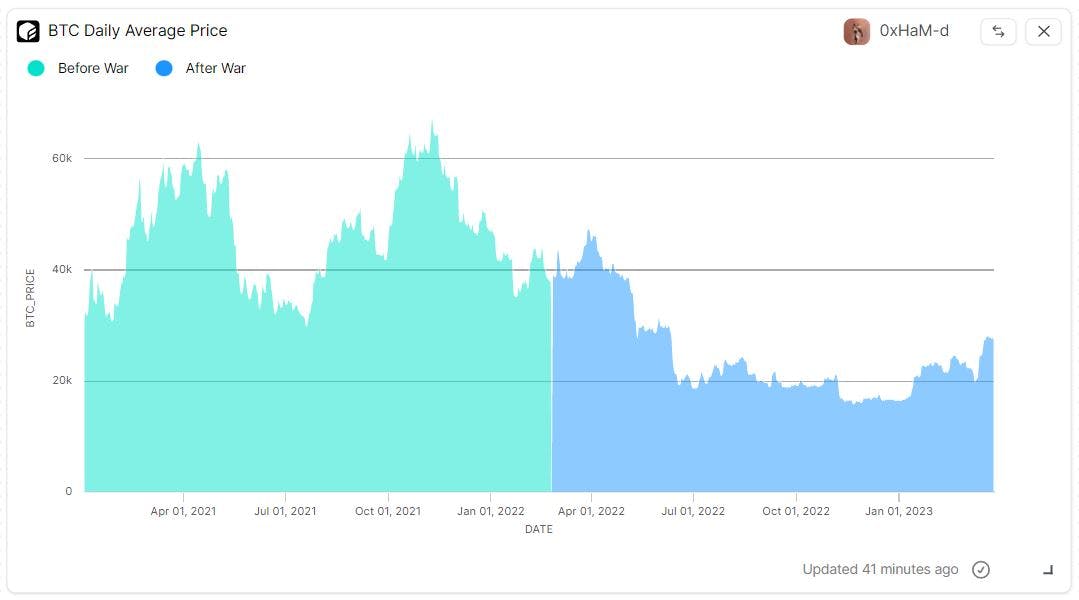
Once upon a time, when the Russian-Ukrainian war began, investors found themselves at a crossroads. They were looking for safe havens to protect their investments from the potential economic implications of this terrible event.
Many investors turned to Bitcoin as their refuge. They saw the decentralized nature of cryptocurrency as a shield against the volatility of traditional markets. So, they decided to invest in BTC, and their faith in this digital asset was soon rewarded.
In the next month after the beginning of the war on February 24th, 2022, the price of BTC surged from 37 to 48K, an increase of roughly 30%. The investors were ecstatic with the gains they had made, and many were convinced that they had made the right decision to invest in Bitcoin.
However, their happiness was short-lived. Despite the initial price surge, the value of Bitcoin began to plummet just three months later. The price dropped below $20,000, wiping out much of the gains that the investors had made earlier.
The investors who had put their trust in BTC were left wondering what went wrong. Was Bitcoin not the safe haven they thought it was? Had they made a mistake by investing in it? These were the questions that haunted them as they struggled to come to terms with their losses.
Despite the rollercoaster ride that Bitcoin had taken them on, the investors did not give up on it completely. They knew that cryptocurrency was still a valuable asset, and they believed that its potential for growth and stability would continue to make it an attractive investment option in the future.
Network’s Traffic
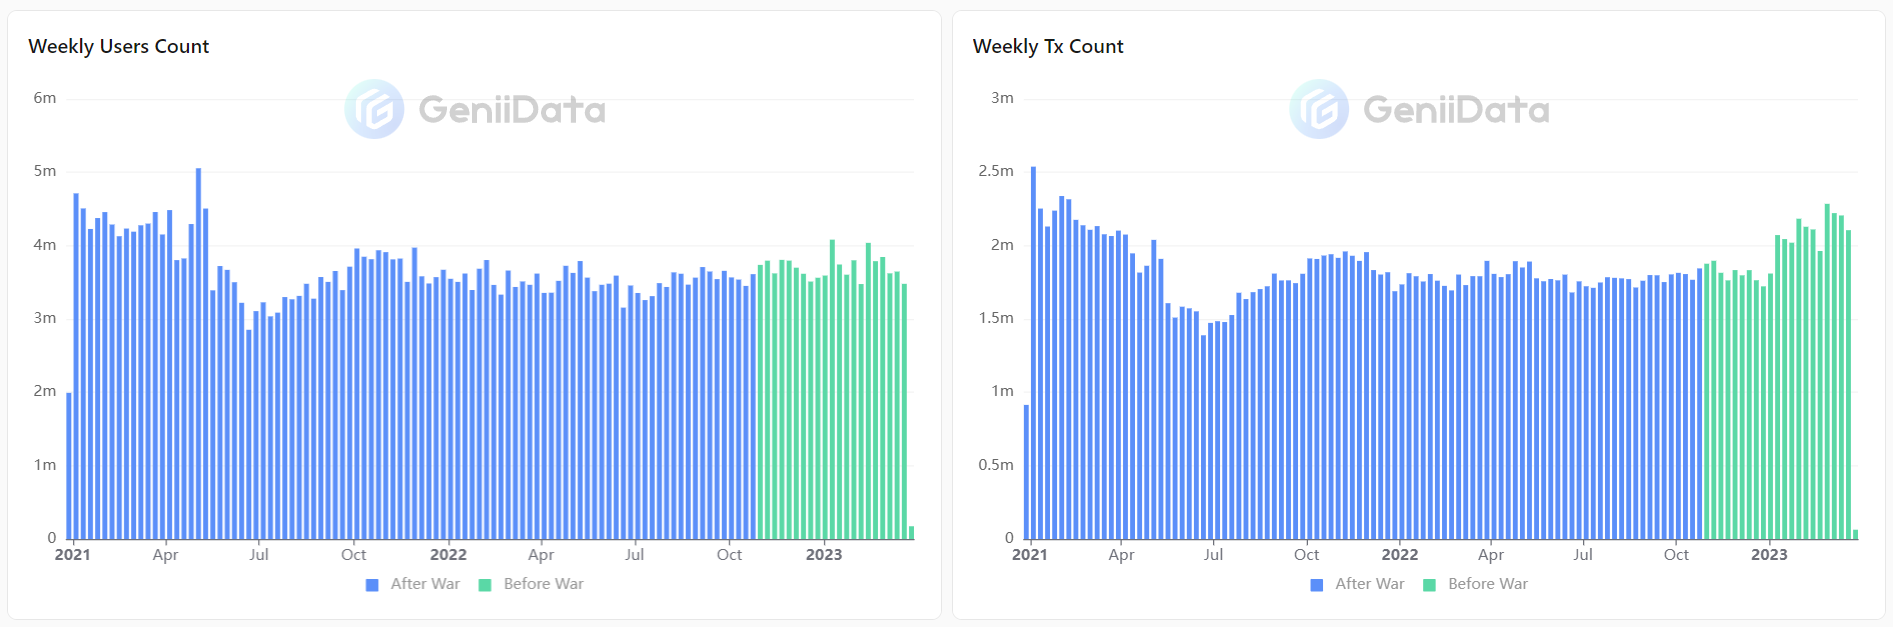
The visualizations below give a fascinating look at how much traffic there has been on the Bitcoin network since 2021, broken down by week and by the important war event that happened on February 24, 2022.
The charts show that the war event had an impact on the price of Bitcoin, which saw a significant increase right after the event and then dropped below pre-war levels over the ensuing months. However, it is worth noting that the number of weekly active users on the Bitcoin network continued to rise steadily, with only a slight dip immediately after the war event.
Also, the number of weekly transactions on the Bitcoin network stayed pretty stable and, in the weeks after the war, even went up in a smooth way.However, this upward trend in transaction counts slowed down towards the end of 2022 before picking up again in early 2023.
The data represented by these charts suggests that, despite the fluctuations in Bitcoin price, the network's usage continued to grow over the period, demonstrating the resilience of the cryptocurrency's underlying technology. It will be interesting to monitor the traffic on the Bitcoin network in the future to see how these trends continue to develop.
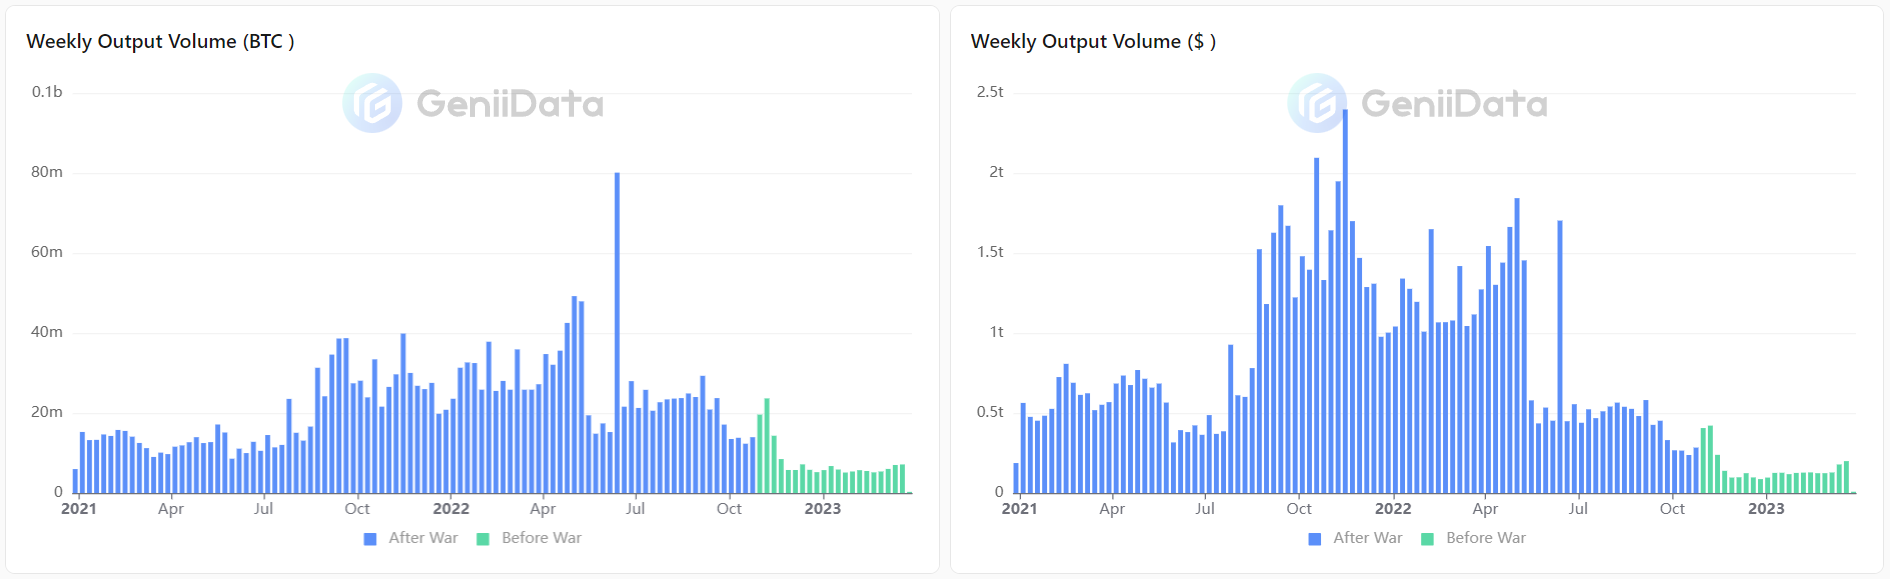
The data also shows an interesting trend in the average transferred volume on the Bitcoin network after the war event. Just two weeks after the beginning of the war, the average transferred volume surged dramatically. However, this surge was short-lived, and the volume quickly dropped to below pre-war levels.
In fact, the average amount of BTC transferred each week after the war was always less than the lowest amount recorded before the war, which was less than 5,000 BTC. This big drop in volume transferred shows that the war had a big effect on how people used Bitcoin's network, at least in terms of volume transferred.
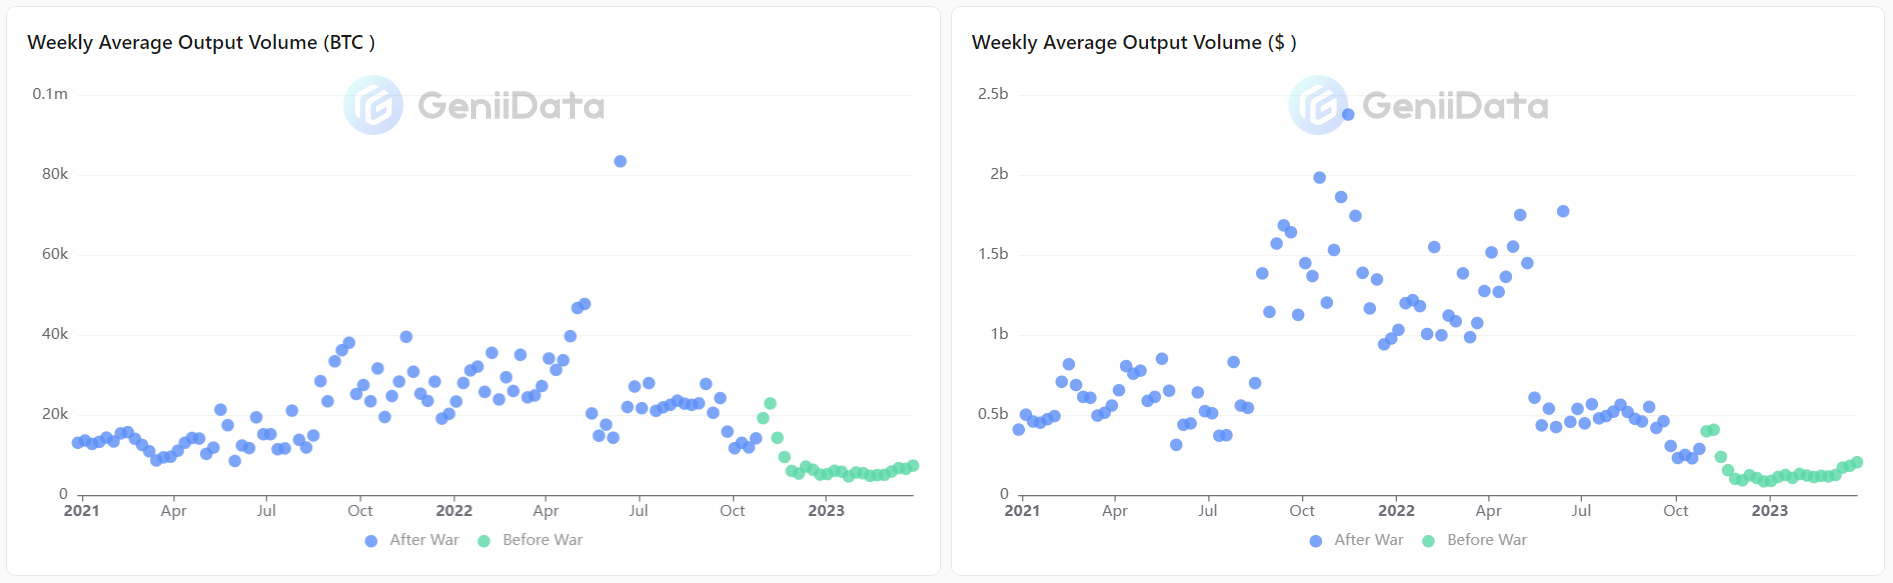
Even though the amount of money being transferred went down, the number of people using the Bitcoin network kept going up. This suggests that while the war event had a negative impact on the volume of Bitcoin transferred, it did not significantly affect the overall usage of the network by individual users. In the world of cryptocurrencies, these trends show how complicated the relationship is between global events, market sentiment, and network use. It will be interesting to see how these trends evolve in the future, particularly as the global economic and political landscape continues to shift and evolve.
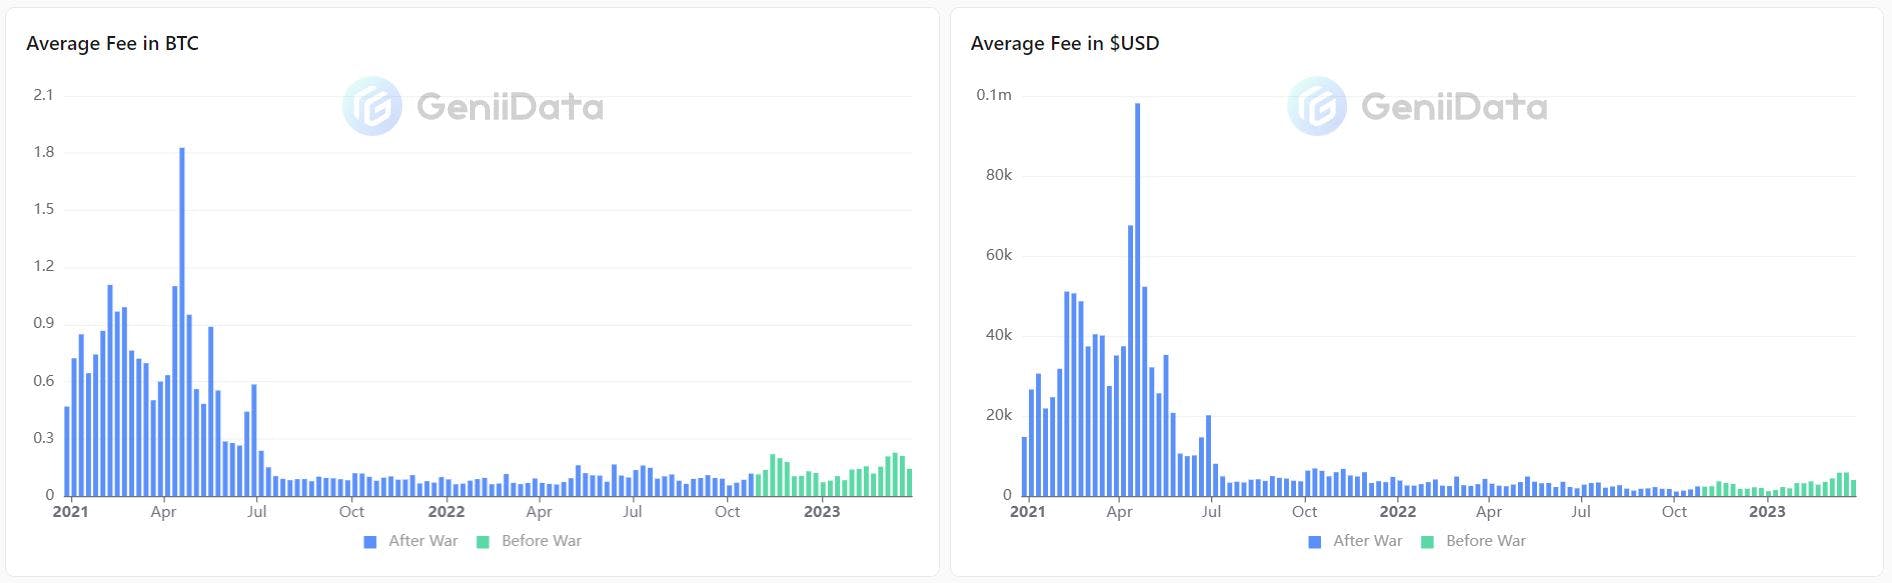
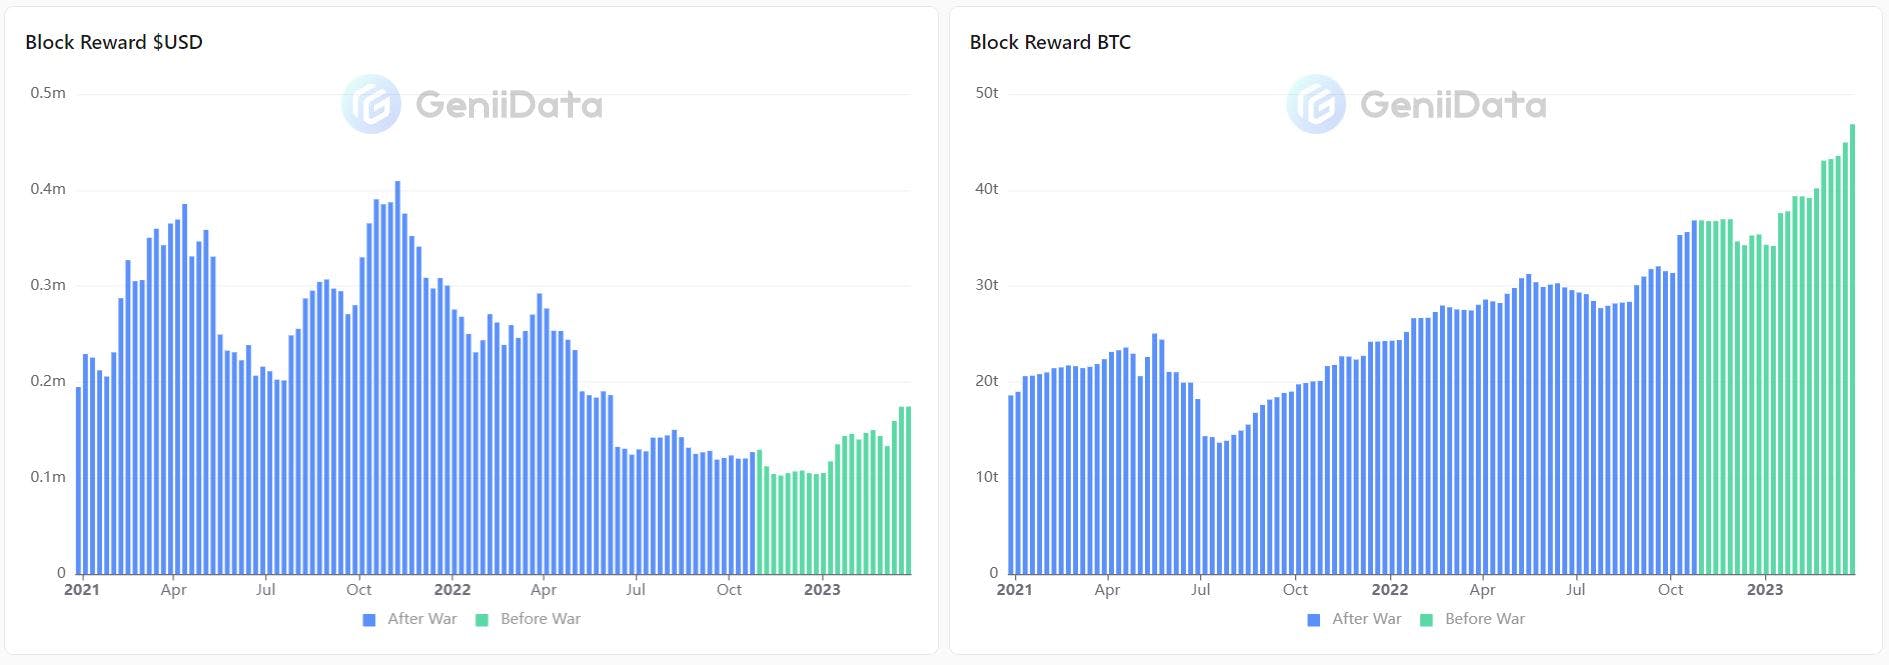
Security Budget Overview
The term "security budget issue" in the context of the Bitcoin blockchain refers to the decreasing percentage of the total miner revenue that is allocated to securing the network over time. This percentage, measured as miner revenue divided by market cap, is a crucial metric in assessing the disincentive for attacking the network.
The security budget is measured in relative terms (i.e. miner revenue / market cap, whereby miner revenue = block reward + transaction fees).
In the current research, we only measured transaction fees and block rewards because of the short-term evaluation.
The graphs that show how much money the network made in fees give an interesting look at how well the network is doing. As the data shows, the network's generated fees had been declining since the second half of 2021. However, after the war event in February 2022, the generated fees began to increase again.
This increase in generated fees indicates that the network's traffic has also increased, as users are willing to pay more for their transactions to be processed more quickly. It is worth noting that this increase in generated fees was a gradual and steady trend, indicating the growth of the network's traffic and its continued relevance in the cryptocurrency world.
Overall, these trends show that the Bitcoin network is still active and important, despite the problems and changes in the cryptocurrency market. It will be interesting to see how the network evolves in response to future global events and shifts in the cryptocurrency landscape.
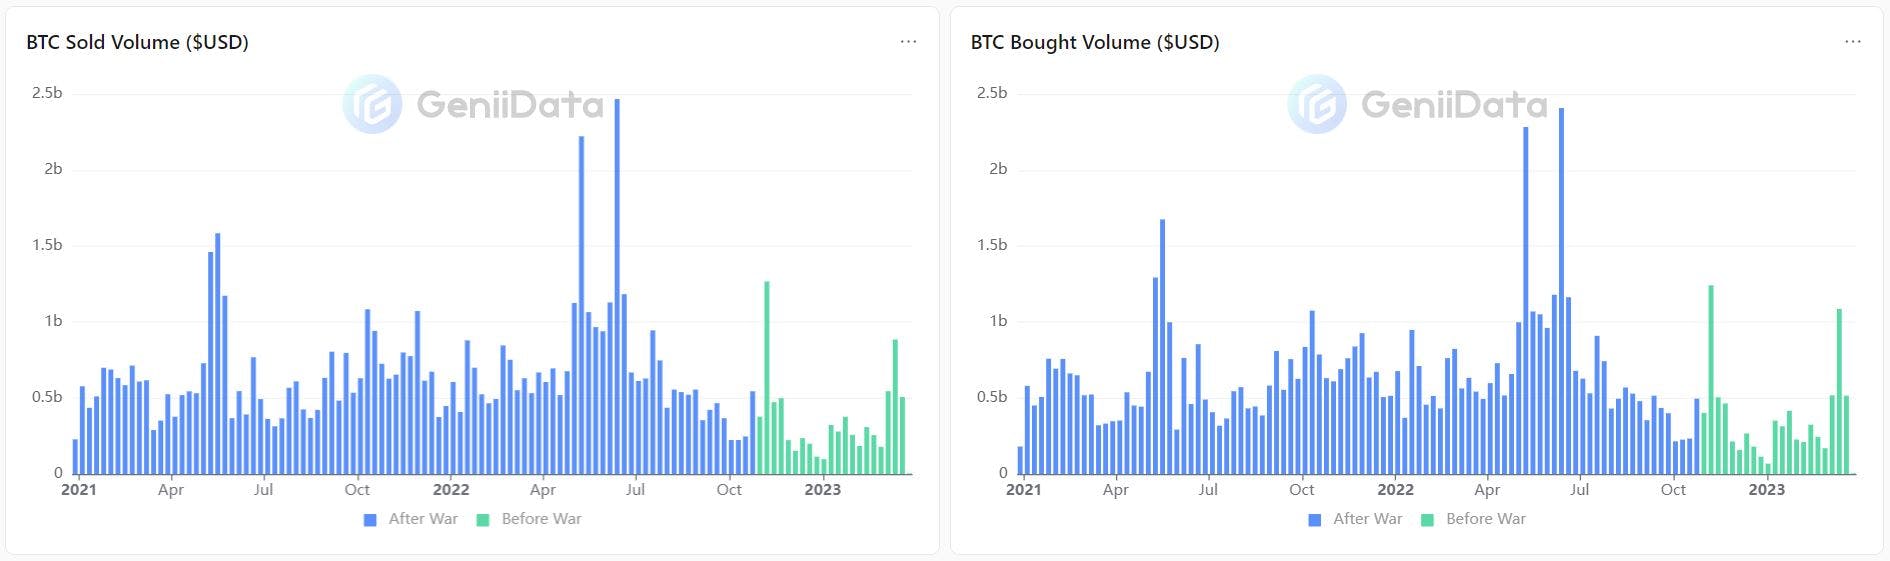
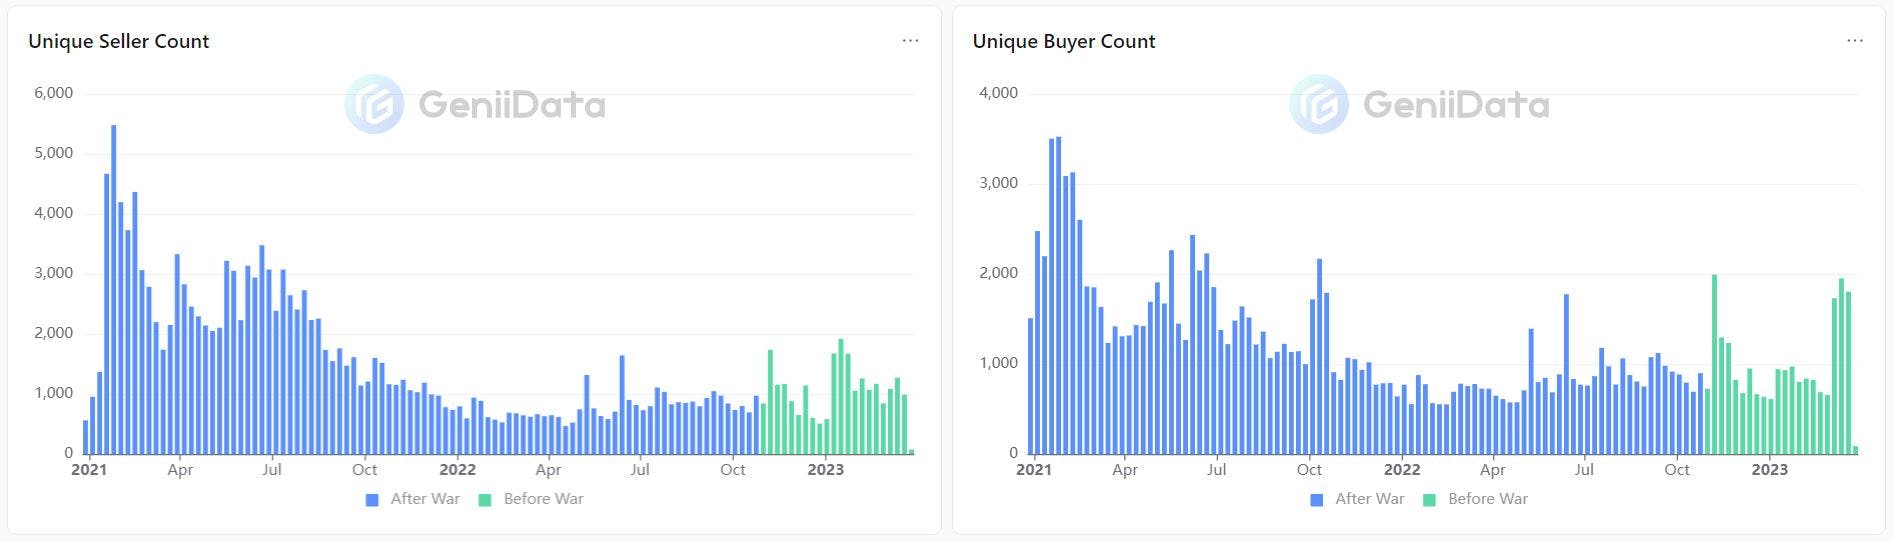
Swapping Overview
The following visuals provide an overview of swaps metrics over these two time periods.
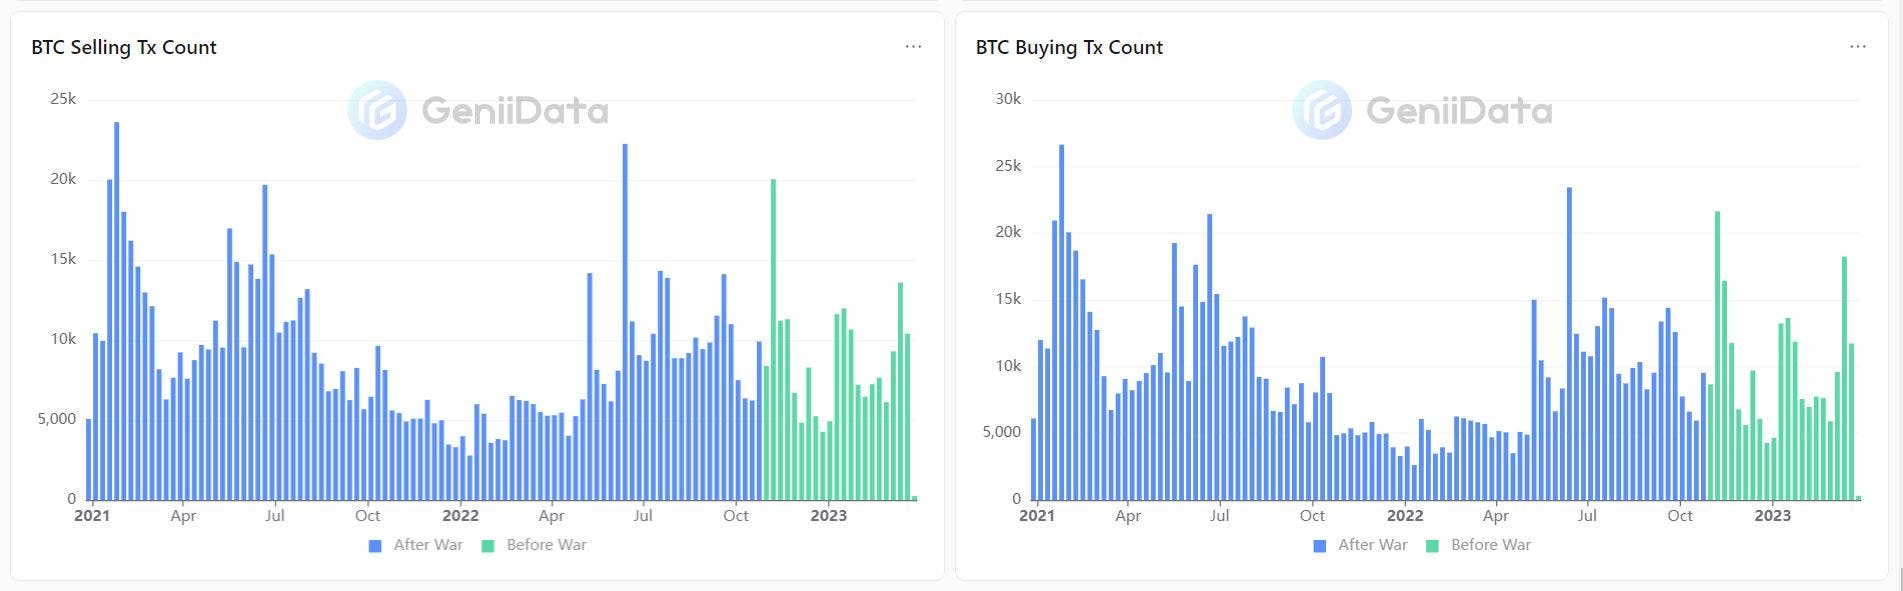
The data also shows interesting patterns in the Bitcoin network's swap transactions, which were affected by the war.Two weeks after the war, the number of swap transactions went up a lot, which shows that more people want to trade cryptocurrencies.However, this surge was short-lived, and swap transactions began to decrease rapidly until the beginning of 2023.
During this period, the selling/buying swapped volume and unique swappers count followed a similar pattern, declining along with swap transactions. However, towards the end of 2022, all of these indicators began to increase again, indicating a resurgence in demand for swap transactions and a growing interest in cryptocurrency exchange.
These fluctuations in the swap transactions and related indicators demonstrate the dynamic and ever-changing nature of the cryptocurrency market, which can be impacted by a range of external factors, including global events and shifts in investor sentiment. As the market continues to evolve, it will be interesting to see how these trends develop and what new patterns emerge in the swap transactions and other key indicators of the Bitcoin network.
It is worth noting that a significant portion of Bitcoin holders had zero balance on the dates before and after the war event, with approximately 143.8M BTC transferred through empty wallets before the war and 153.2M BTC transferred through empty wallets after the war. This suggests that many users were actively moving their Bitcoin holdings around during this time, possibly to take advantage of market fluctuations or to safeguard their funds.
The movement of funds during this time is not surprising, as global events and market conditions can have a significant impact on the value and stability of cryptocurrencies. Bitcoin's decentralized and transparent nature makes it a popular choice for those seeking to move their funds quickly and efficiently in response to market changes.
It is important to note that while the movement of funds during this time may have been driven by market conditions, it also demonstrates the power and potential of cryptocurrencies as a tool for individuals seeking to transact and hold value securely and efficiently. As the cryptocurrency market continues to evolve and mature, it will be interesting to see how these trends and behaviors develop over time.

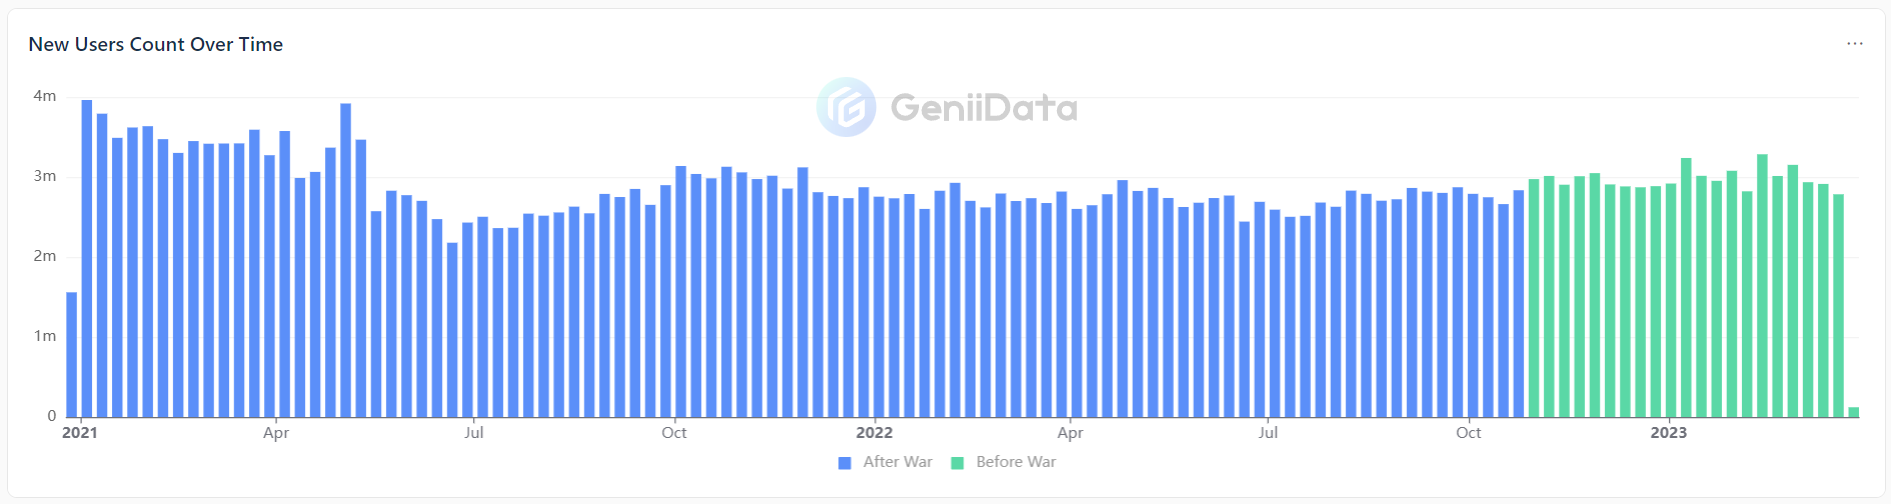
New Users
In addition to the previous metrics, it is also worth looking at the influx of new users to the Bitcoin network during the two assessed periods. Surprisingly, the data shows that the war event did not have a significant impact on the number of new users entering the network.
As shown in the chart, there was a significant increase in new users joining the Bitcoin network prior to the war event, which remained relatively stable throughout the post-war period. This indicates that despite the uncertain global situation and the impact it had on the cryptocurrency market, interest in Bitcoin remained high among newcomers, who saw the potential value and benefits of joining the network.
Overall, the data highlights the resilience of the Bitcoin network and its users in the face of external events and market fluctuations. Despite the impact of the war event on other metrics such as price, transfer volume, and swap transactions, the network's traffic and interest remained stable and even continued to grow in some areas. This demonstrates the robustness and potential of the Bitcoin network as a tool for investors and individuals seeking to transact with cryptocurrencies.
Conclusion
In conclusion, the data shows that the Russian-Ukrainian war event had a significant impact on various metrics related to the Bitcoin network. While the price of Bitcoin initially surged after the war event, it later dropped to below pre-war levels. However, the network's traffic remained stable and even increased in some areas, indicating its resilience to external events and market fluctuations.
Moreover, the movement of funds during this time highlights the potential of cryptocurrencies as a tool for individuals seeking to transact and hold value securely and efficiently, even in times of uncertainty and global turmoil.
Overall, the data suggests that the Bitcoin network remains an important and valuable asset for investors and individuals seeking to transact with cryptocurrencies. As the market continues to evolve and mature, it will be interesting to see how these trends and behaviors develop and shape the future of cryptocurrencies.
Definitions:
-
Bitcoin Price: The value of one Bitcoin, typically measured in a fiat currency such as US dollars.
-
Weekly Transactions: The number of transactions made on the Bitcoin network during a given week.
-
Weekly Active Users: The number of unique users who made at least one transaction on the Bitcoin network during a given week.
-
Average Transferred Volume: The average amount of Bitcoin transferred in each transaction during a given week.
-
Network Fees: The fees paid by users to process transactions on the Bitcoin network. These fees are paid to miners who verify and add transactions to the blockchain.
-
Swapped Volume: The amount of Bitcoin being bought and sold on decentralized exchanges (DEXs) or other trading platforms.
-
Unique Swappers: The number of unique users participating in the buying and selling of Bitcoin on DEXs or other trading platforms.
-
Newcomers: The number of new users joining the Bitcoin network during a given period of time.
This dashboard has been made for MetricDAO’s bounty by geniidata’s atabase.
References: