
Introduction
Welcome to the On-Chain Analytics Dashboard for the Bitcoin Blockchain! This dashboard provides a comprehensive overview of the overall activity on the Bitcoin network, with a special focus on the effects of FTX and SVB bankruptcy. You'll be able to track the sentiments of bitcoin's community. Additionally, you can see the total fees spent affected by these events and get a clear picture of the users behaving on the Bitcoin blockchain. This dashboard gives you a visionary from effects of major economical events on cryptocurrency specially BTC to make a stronger risk management in the future.
Background
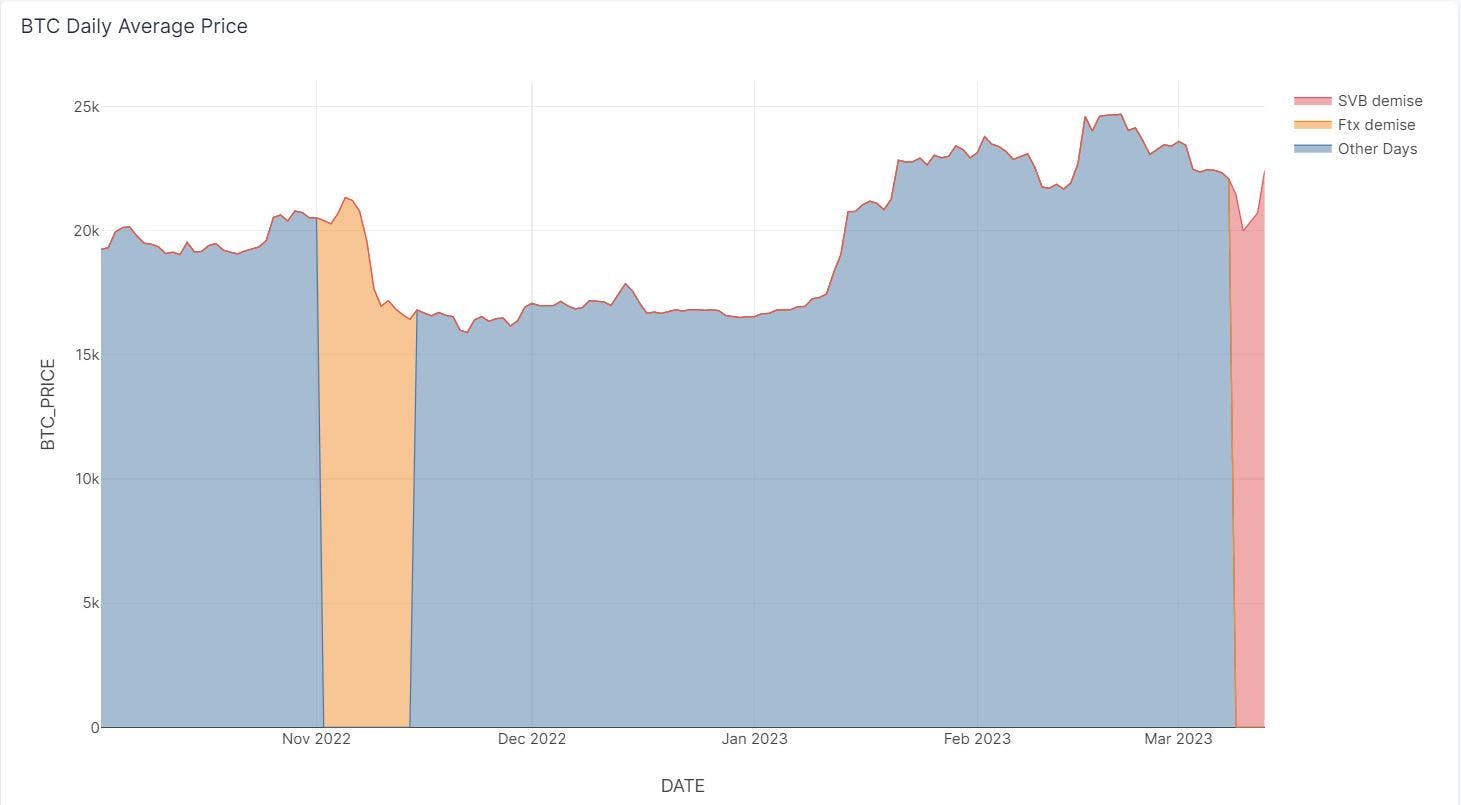
On November’s second week in 2022, FTX, a cryptocurrency exchange, had a technical problem that caused the prices of some tokens, like bitcoin, to drop sharply. This caused panic selling and led to widespread losses among traders. The incident raised concerns about the reliability of cryptocurrency exchanges and the need for better risk management.
Four months later, Silicon Valley Bank (SVB), the premier financial institution for Silicon Valley tech startups for the past 40 years, was shut down by US federal regulators. This sent shockwaves through the tech industry and raised concerns about whether companies would be able to get their money back and pay their employees.
The effects of these events on the cryptocurrency market were significant. Bitcoin's price dropped sharply in response to the FTX incident, and the depegging of USDC caused fear and panic among stablecoin users. However, efforts by individuals and companies to recover USDC's lost value have led to a partial recovery of its price.
Overall, these events highlight the need for better risk management and regulation in the cryptocurrency industry. Stablecoins and reliable exchanges are important for the growth and use of cryptocurrencies, and events like these can make investors less confident and slow down progress.
What are we going to look at?
In the current research, we are going to take a look at the following metrics since one month before FTX’s demise in November 2022, to date (March 2023).
-
Daily transactions and active unique Users counts.
-
Daily transferred volume and paid fee.
-
Daily swapped volume from/to in event’s date.
-
Top 10 assets swapped from/to BTC in event’s date.
Analysis
In all of the following visuals, the highlighted zones refer to one week before and one week after the events.
- From November 1 to 15 in 2022 for FTX and March 5 to date for SVB.
Transfer Overview
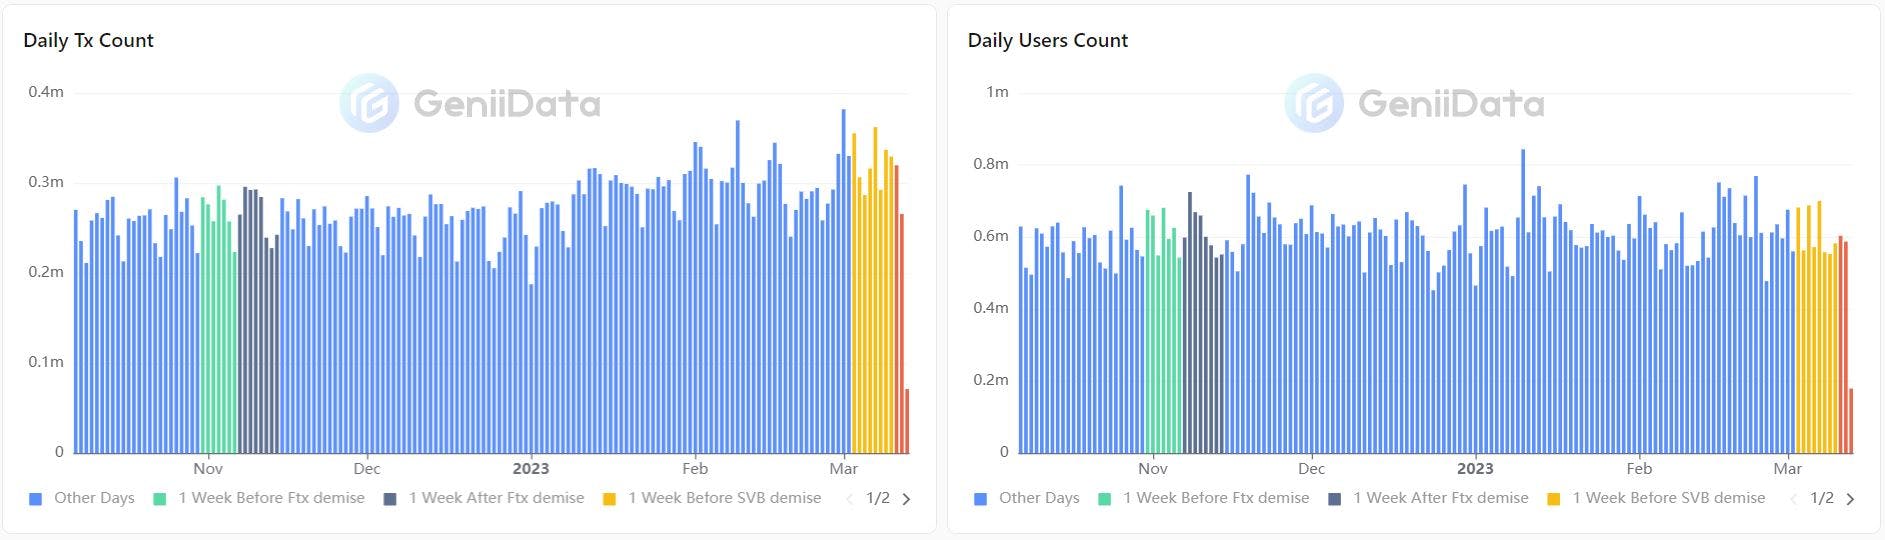
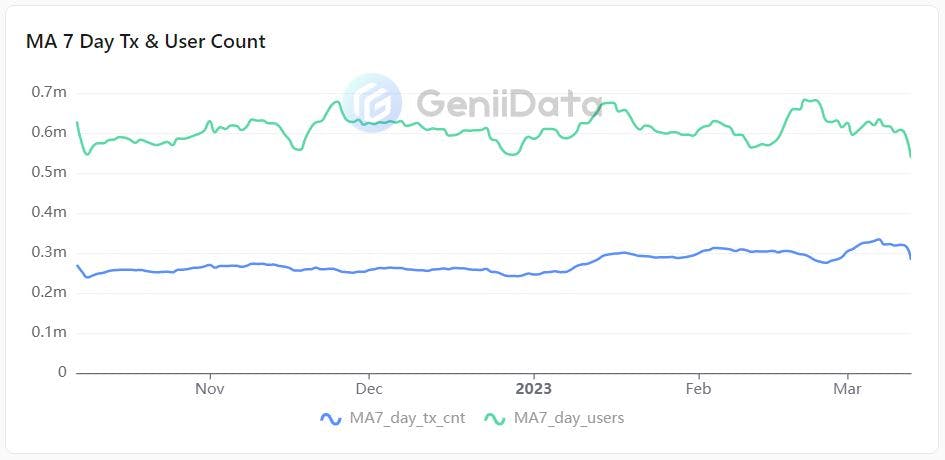
Over the past five months, there has been an increase in the number of Bitcoin transactions, but the number of active users has remained steady. However, the demise of FTX and SVB has had a noticeable impact on these metrics. After a spike on November 7th and March 11th, the dates of FTX and SVB's downfall, both the daily transaction count and active unique user counts on the Bitcoin blockchain dropped. The 7-day moving averages of these metrics also reflected this trend.
Overall, it appears that while the number of transactions is on the rise, the number of active users hasn't followed suit, and recent events have played a role in shaping these metrics.
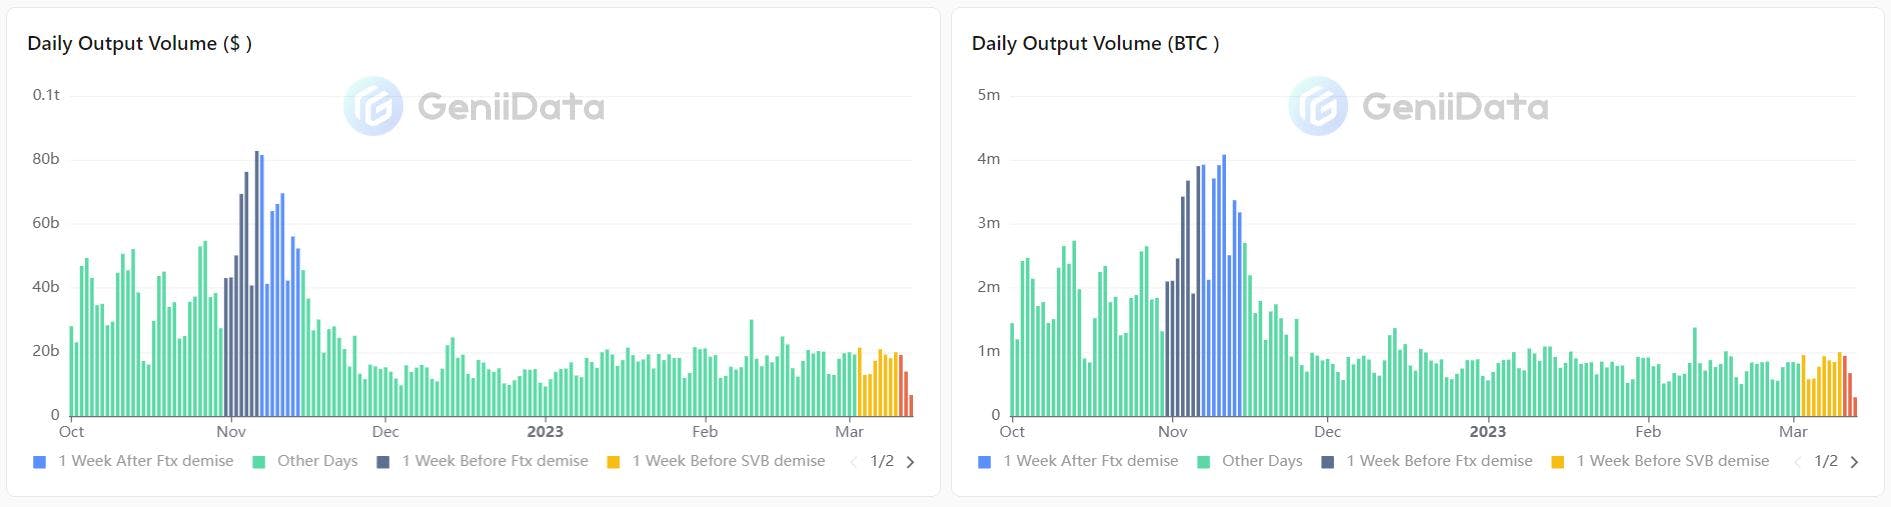
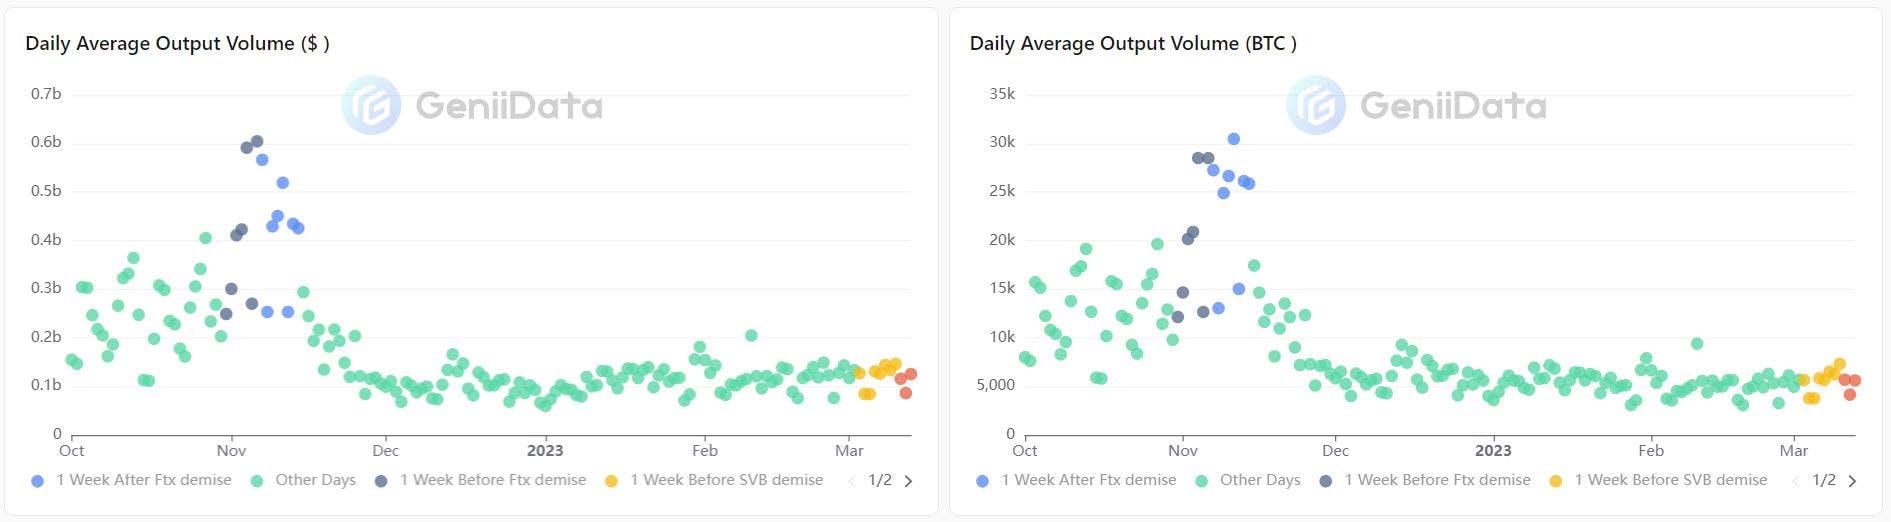
While the impact of events on the transaction and active user counts on the Bitcoin blockchain was not entirely clear, the effects on transfer volume are more apparent. The charts reveal that the demise of FTX had a much more significant impact on transferred volume than the demise of SVB.
The transferred volume affected by FTX's event increased to over two times higher than before the event, only to experience a significant drop to below one third after a few days. Conversely, the SVB's event had little impact on transferred volume.
This could be because FTX was directly related to cryptocurrency, while SVB was a bank and investor in fintech, but not directly related to cryptocurrency.
Security Budget (BTC & $USD) Overview
The term "security budget issue" in the context of the Bitcoin blockchain refers to the decreasing percentage of the total miner revenue that is allocated to securing the network over time. This percentage, measured as miner revenue divided by market cap, is a crucial metric in assessing the disincentive for attacking the network.
The security budget is measured in relative terms (i.e. miner revenue / market cap, whereby miner revenue = block reward + transaction fees).
In the current research, we only measured transaction fees and block rewards because of the short-term evaluation.
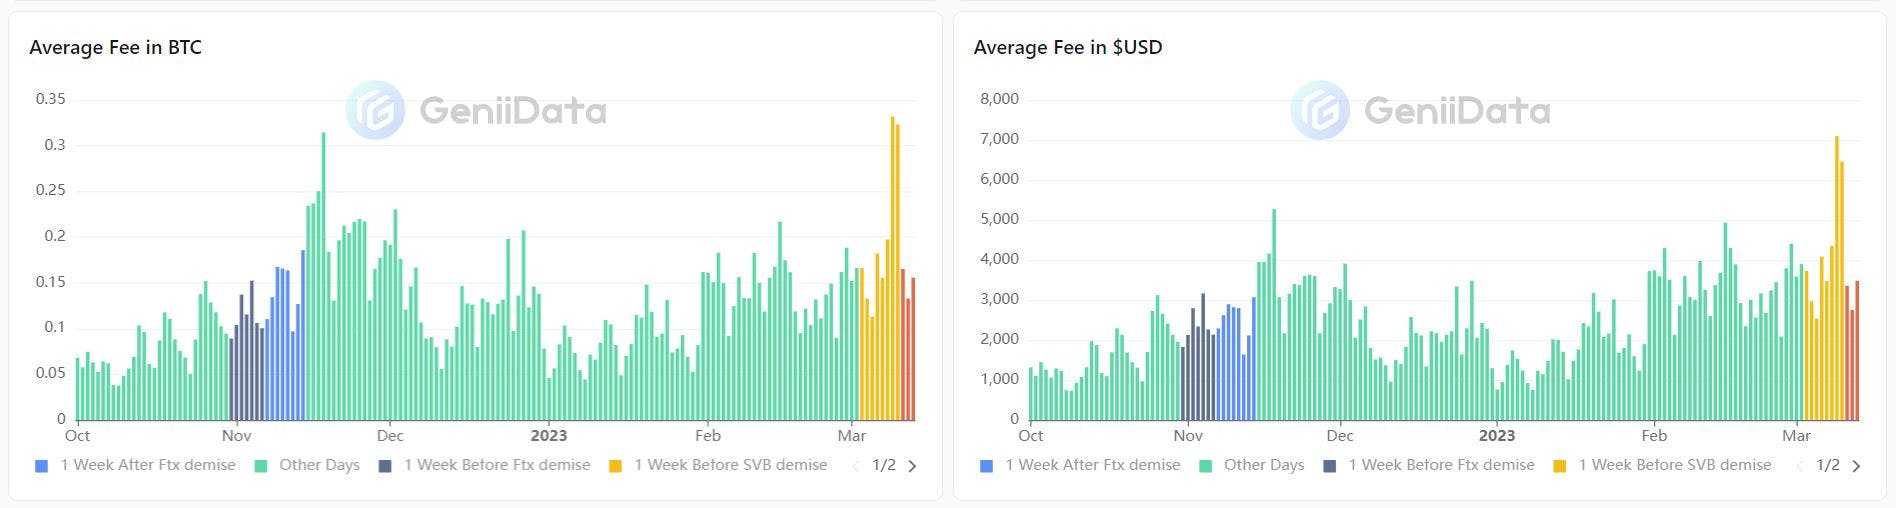
The events of FTX and SVB had a significant impact on the transaction fees of Bitcoin. Though the daily average transaction fees were already increasing, the effects of the events were much higher due to market panic and increased network traffic.
The impact of SVB on average fees was much greater than FTX, which is contrary to the effects seen on transferred volume. The chart below indicates that block rewards decreased significantly because of FTX's event, while SVB's bankruptcy had a lower impact.
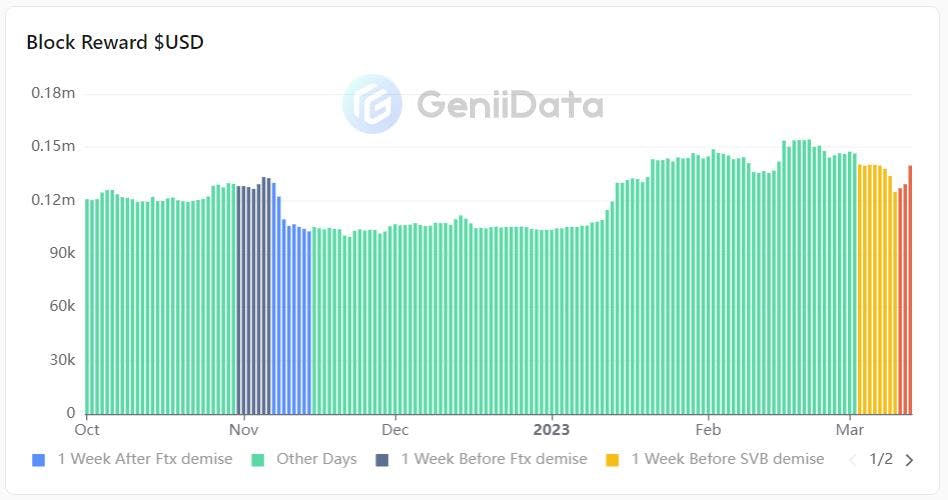
The average block reward in BTC is 6.25 per each block, which remains constant until 2024, and it will decrease to 3.125 after the next halving in 2024.
Swapping Overview
The following visuals have dedicated to swapping volume since one month before FTX’s demise to date (March 12th, 2023).
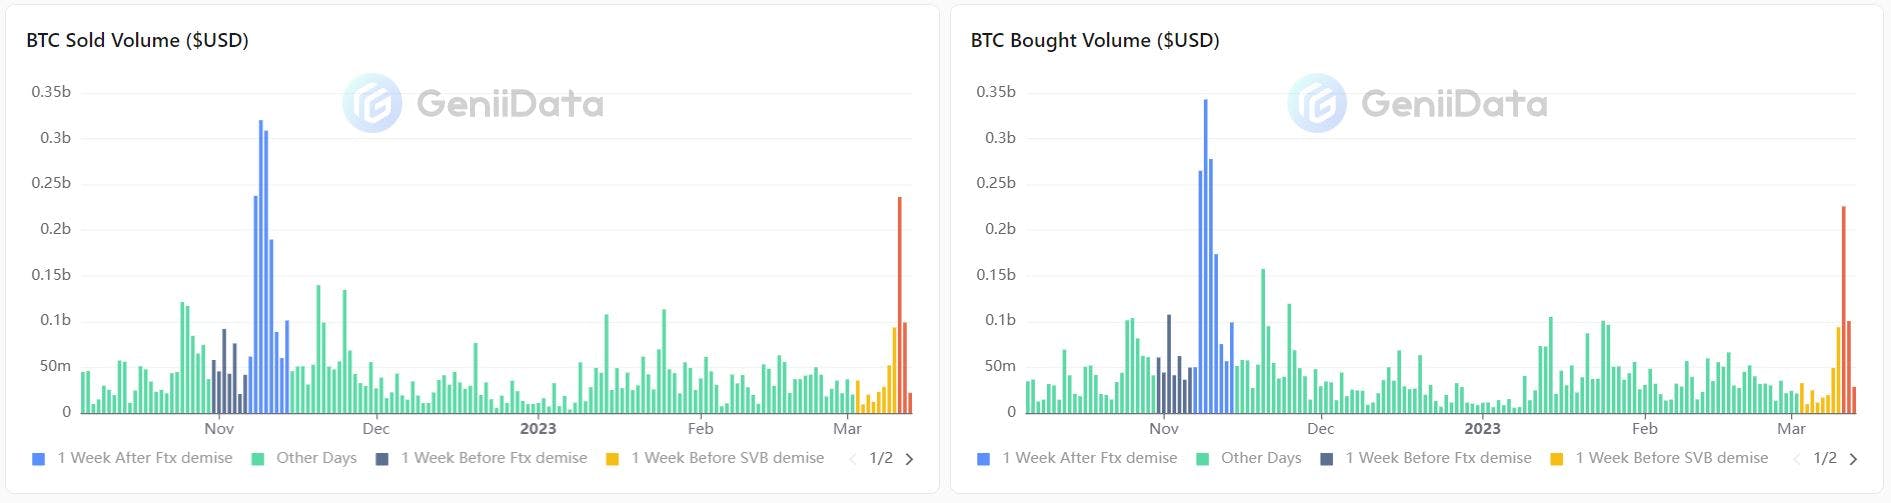
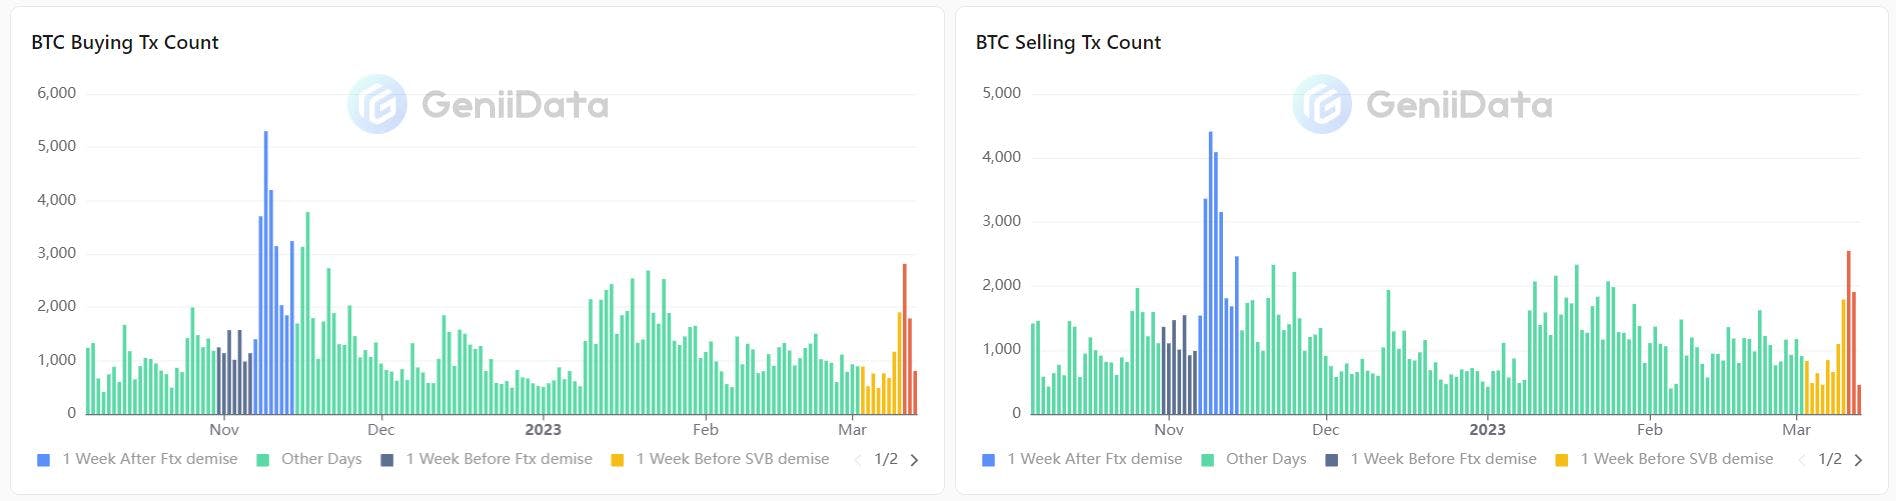
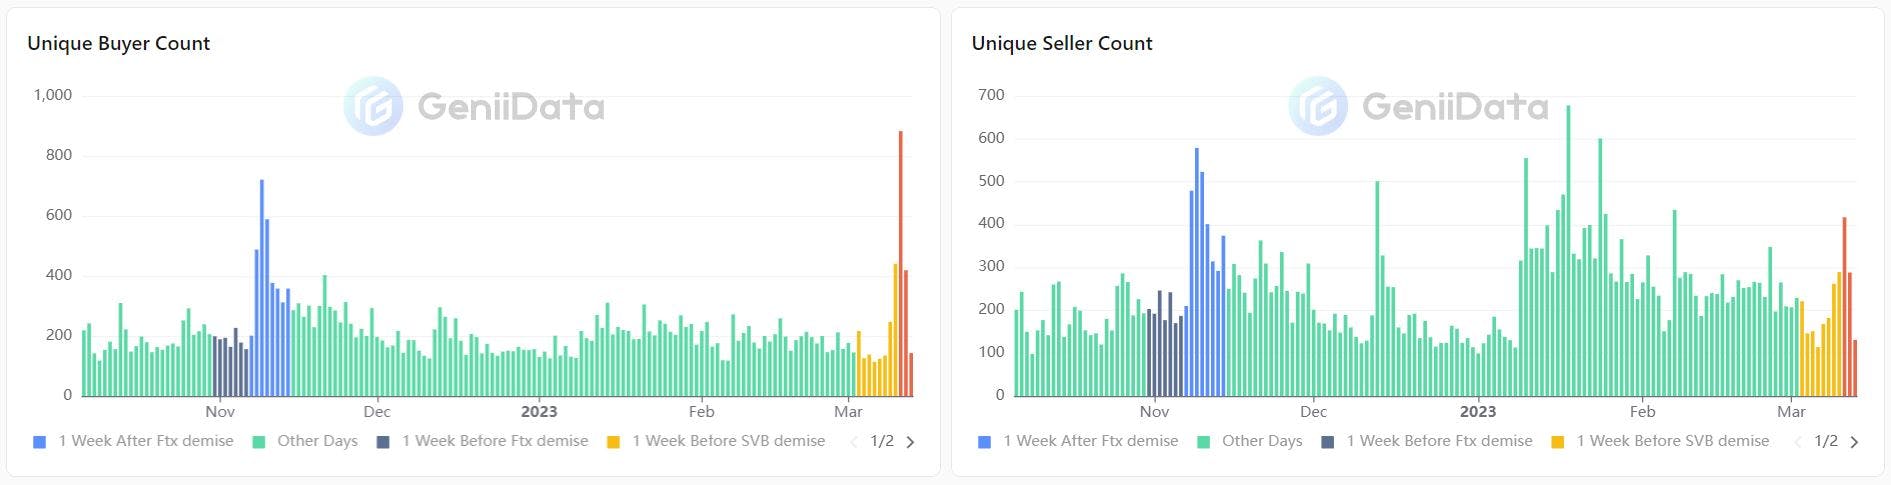
The charts presented above provide an insight into the impact of recent events on swap metrics. As evident from the charts, the events have had a substantial effect on these metrics. The charts show a sharp increase in swap transactions, active unique buyers, and sellers after the occurrence of the events.
This surge in swap activity is likely due to market participants reacting to the events and seeking to adjust their positions accordingly. The increase in swap transactions is indicative of higher trading activity, as market participants rush to take advantage of potential opportunities or mitigate risks.
Moreover, the rise in active unique buyers and sellers is reflective of greater market participation, as more market participants enter or exit their positions. This is likely due to the increased volatility and uncertainty caused by the events, which may have prompted more market participants to actively trade in order to capitalize on market movements or to safeguard their positions.
Top 10 Assets Swapped From/To BTC in the Events Dates
The following charts represent the top 10 most popular assets on Ethereum blockchain, based on swapped volume that swapped in FTX and SVB events on November 7th and March 11th, respectively.
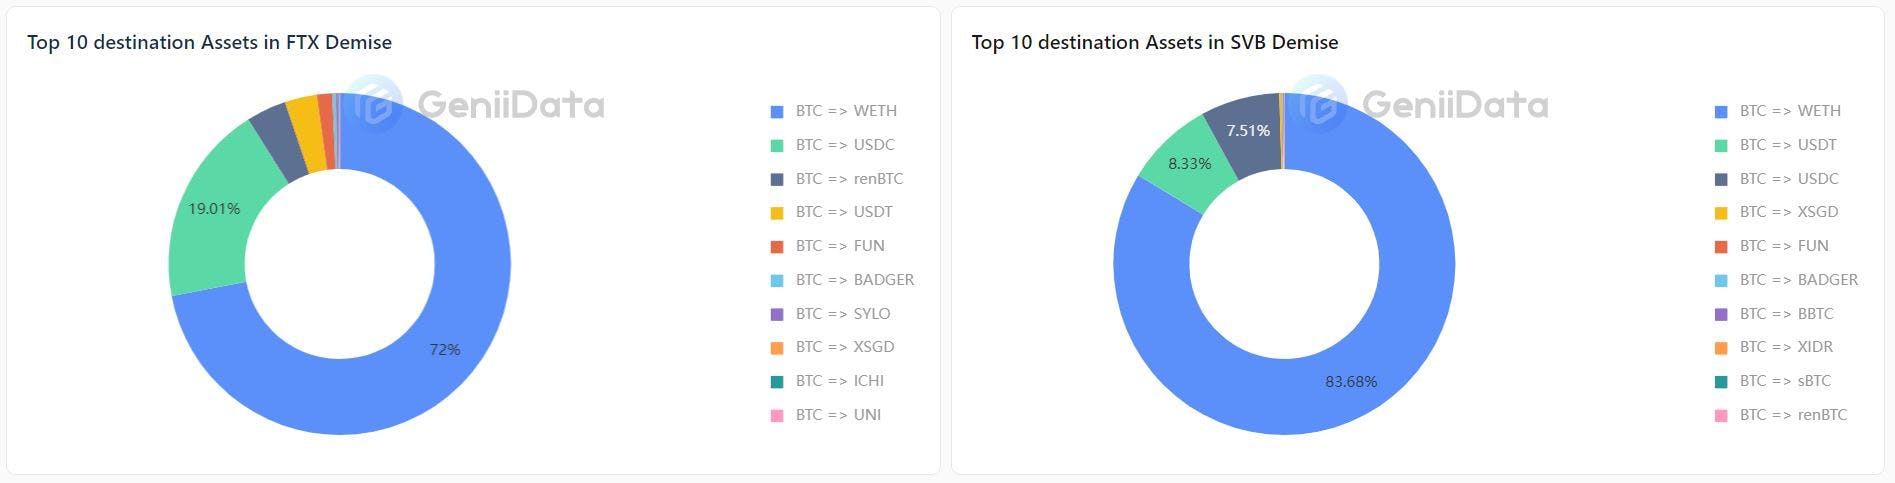
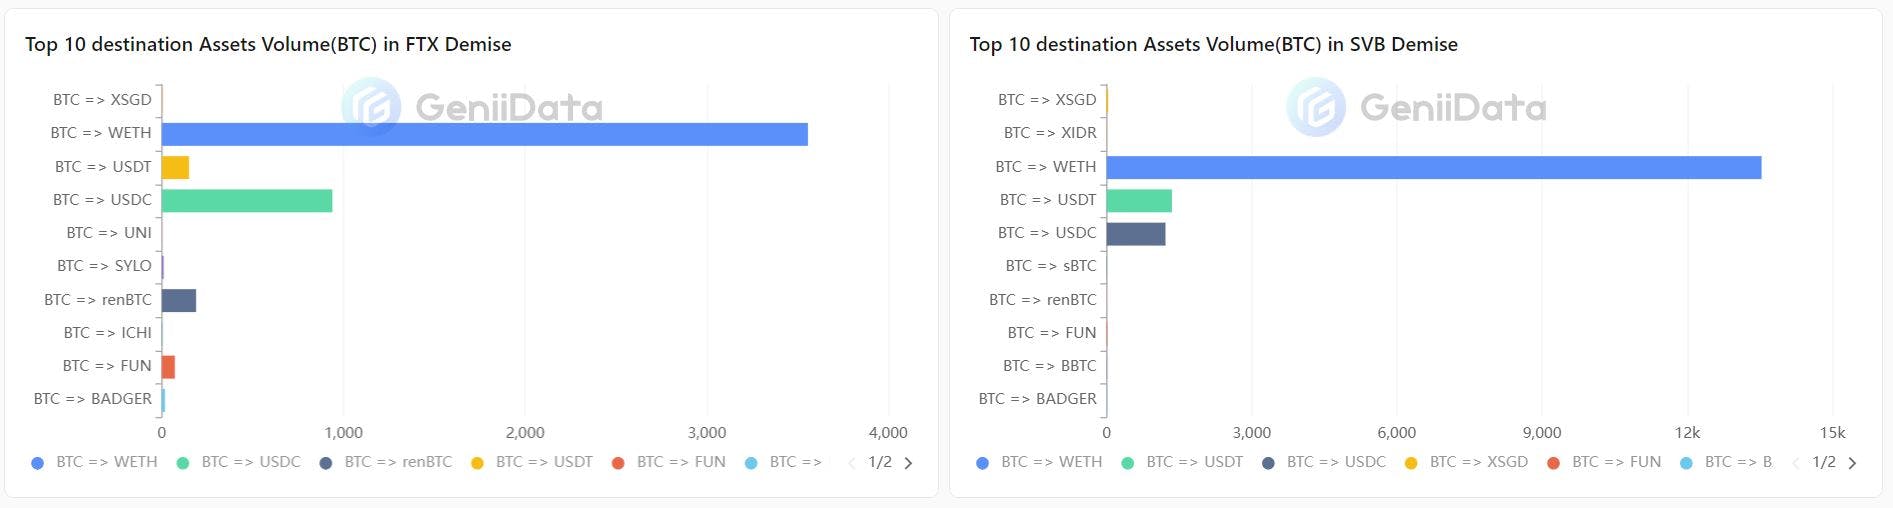
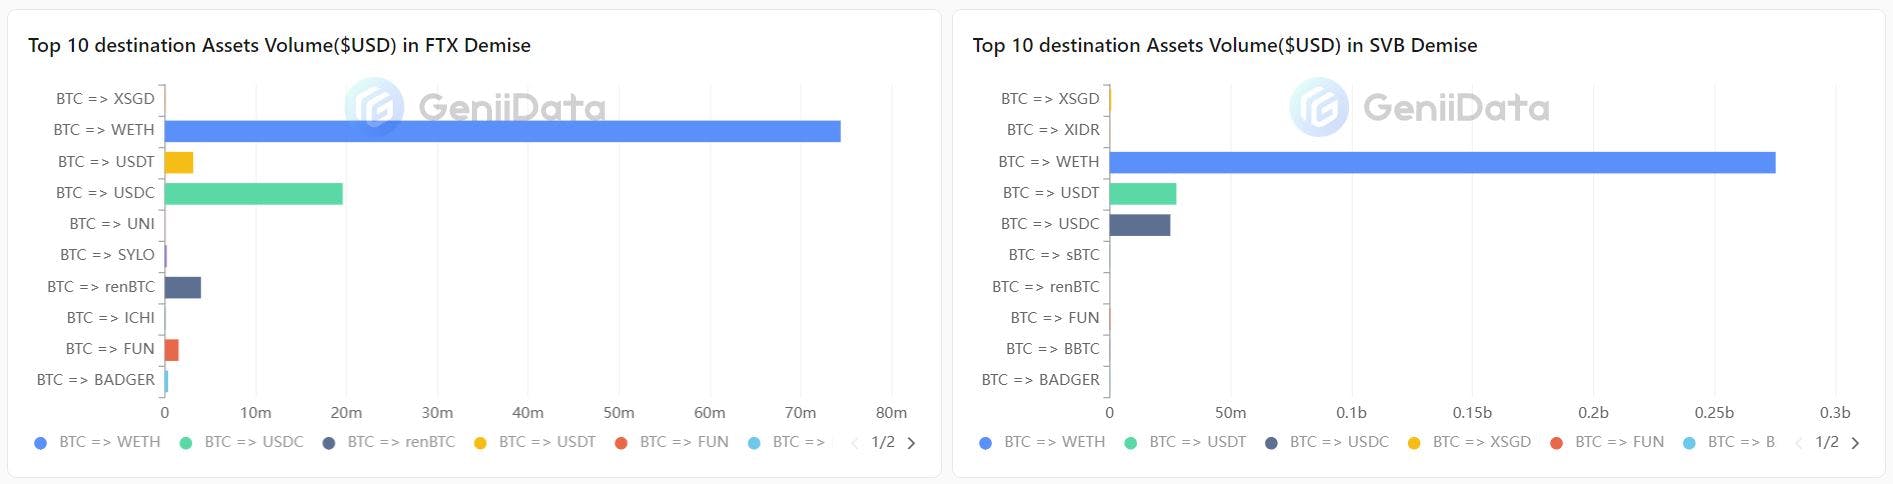
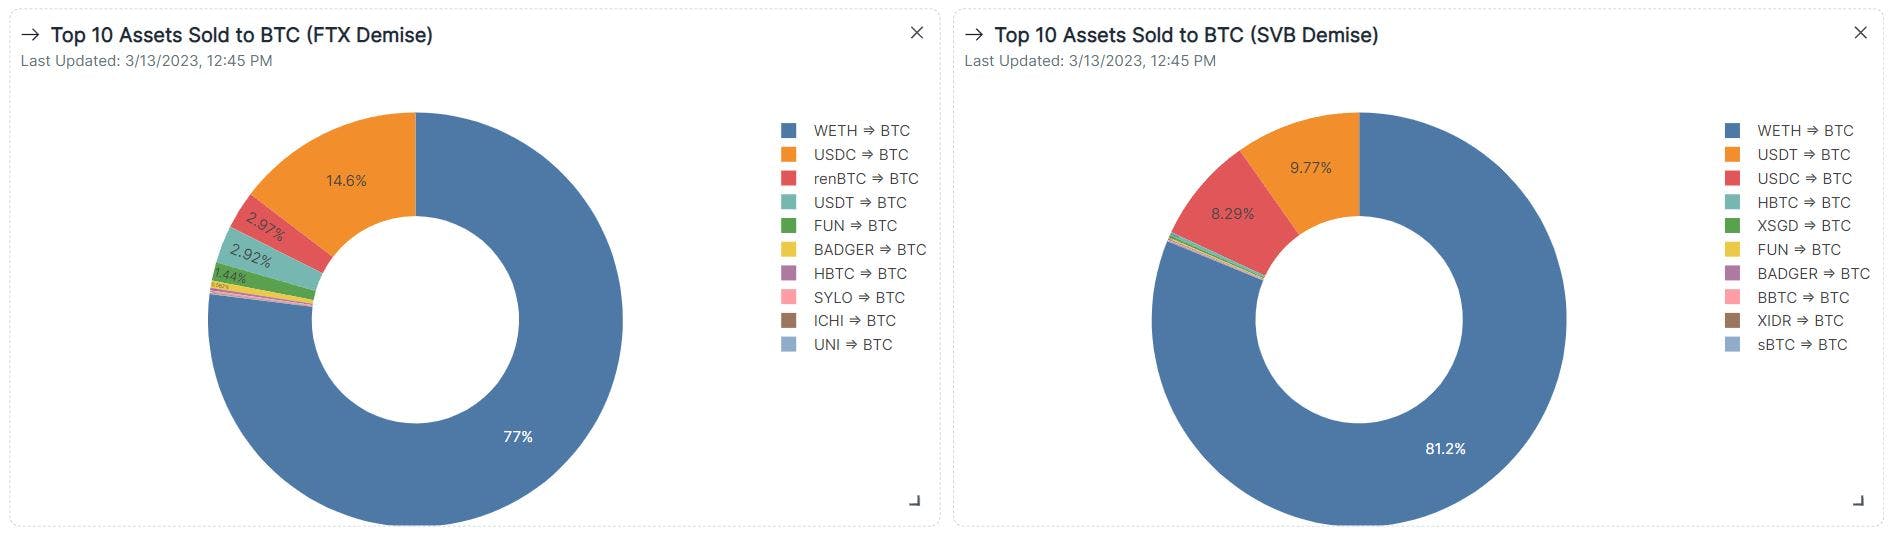
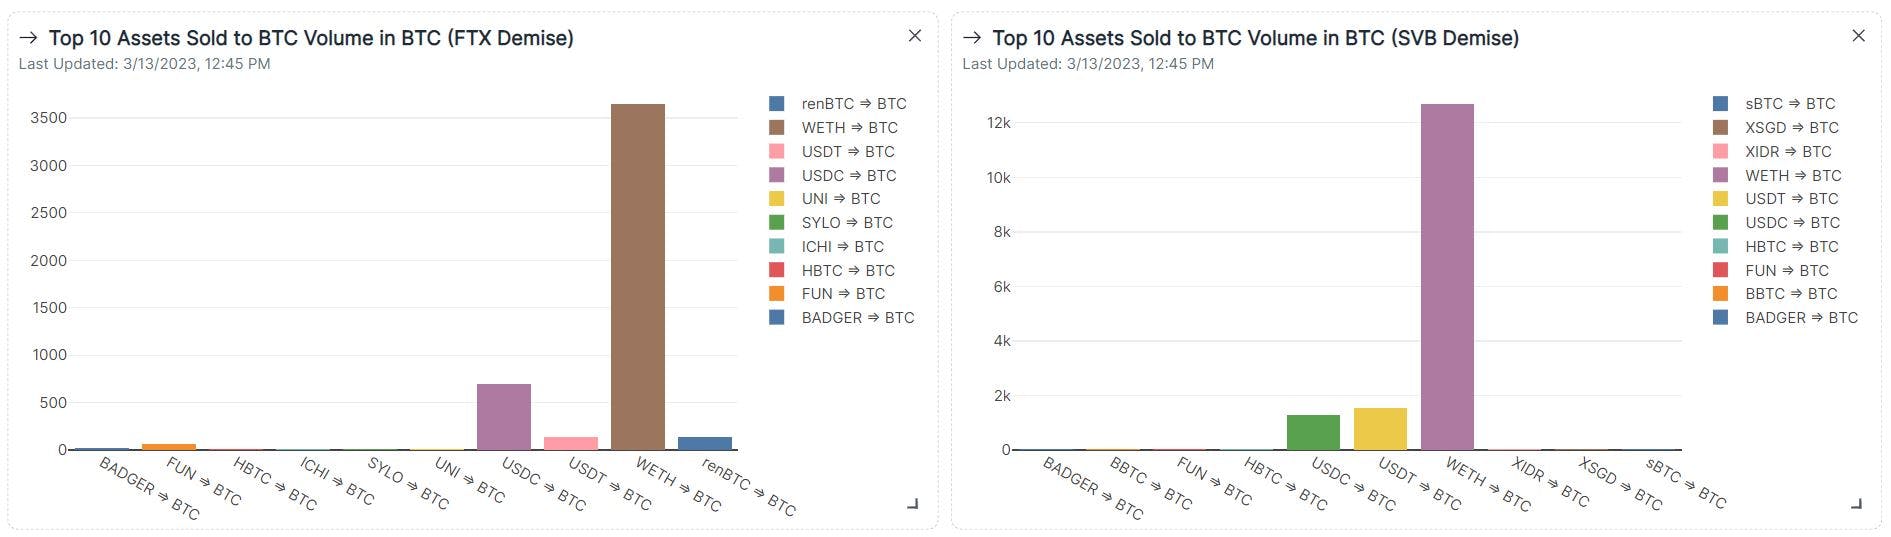
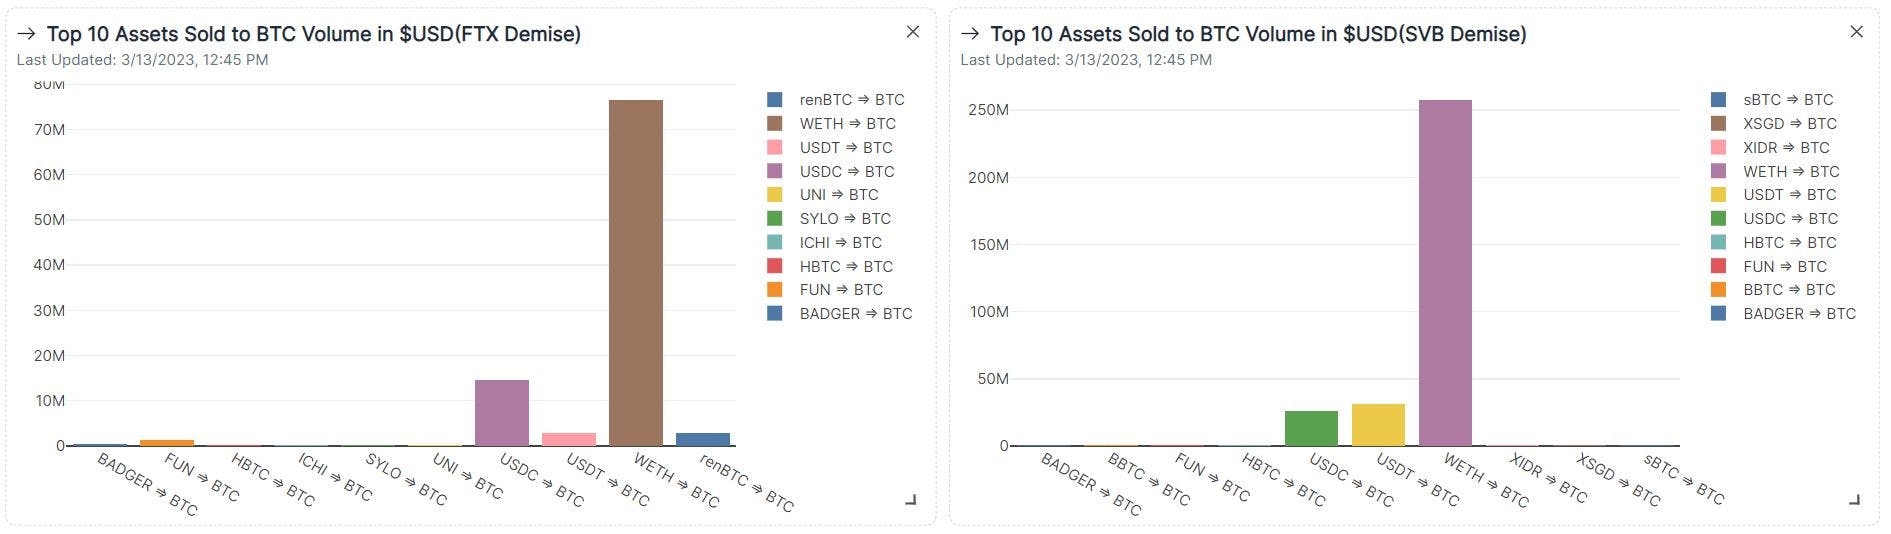
The charts presented earlier showed that the most swapped assets during the events were WETH and WBTC. Additionally, the following graphs give an overview of BTC balances held by users with the most input/output volume during the events.
Interestingly, the largest group of BTC holders on these dates had zero balance, with approximately 600,000 BTC for FTX's date and 664,000 BTC for SVB's date. This suggests that a large number of users were actively moving their BTC holdings around during these events, possibly in an effort to take advantage of market fluctuations or to ensure the safety of their funds.

Conclusion
Based on the findings presented above, it can be concluded that the bankruptcy of SVB and the FTX event had significant impacts on the cryptocurrency market, particularly on swap metrics and transaction fees. The average transaction fees increased due to both events, but the block rewards decreased significantly due to FTX’s event. WETH to WBTC and vice versa were the most swapped assets by traders during these events. The largest group of BTC holders during these dates belonged to those who had zero balance.
Overall, these events highlight the importance of understanding market trends and events that may impact the cryptocurrency industry. It is important for traders and investors to stay informed and up-to-date with the latest news and developments to make informed decisions and mitigate potential risks.
Methodology
In conducting the analysis, we used specific tables and conditions to retrieve relevant data. To obtain information on bitcoin blockchain, we employed the bitcoin.blocks, models.fact_dex_trades and bitcoin.transactions table and calculate the total and averages key metrics.
We distinguished events dates by one week before and one week after the FTX’s demise and one week before of the SVB’s bankruptcy to end during the period of one month before FTX’s event to date (March 13th, 2023).
Definitions
-
Security budget: The amount of resources dedicated to securing a blockchain network from potential attacks. It is measured in relative terms by comparing miner revenue (block rewards and transaction fees) to the network's market capitalization.
-
Miner revenue: The total amount of compensation received by miners for verifying and adding transactions to the blockchain. It consists of the block reward and transaction fees.
-
Market capitalization: The total value of all the coins or tokens in circulation for a given blockchain network. It is calculated by multiplying the current price of a single unit of the cryptocurrency by the total number of units in circulation.
-
Halving: A programmed reduction in the block reward given to miners in a blockchain network that occurs approximately every four years. This reduces the rate at which new coins are created, and helps to prevent inflation.
-
Swap: The act of exchanging one cryptocurrency for another.
-
Input/output volume: The amount of cryptocurrency that is sent or received in a transaction.
-
BTC balance: The amount of Bitcoin held by a user in their wallet.
This dashboard has been made for MetricDAO’s bounty by geniidata’s atabase.
Queries and Graphs: Link
References: