Summary
Name: The Graph | Symbol: $GRT | Website: https://thegraph.com/en/ | Price: $0.09051 | FD Market Cap: $914,595,870 | Market Cap (Circulating Supply): $627,491,660 | 24h - Volume: $44,849,970
Description: The Graph is an indexing protocol for querying networks like Ethereum and IPFS. Anyone can build and publish open APIs, called subgraphs, making data easily accessible in a decentralized way.
Product Market Fit
- Value Proposition: The Graph protocol targets the problem of indexing blockchain data through a decentralized protocol that allows for high performance and speed indexing and querying of blockchain data. This is done through the creation of APIs called subgraphs that can be queried using the standard GraphQL API ${^1}$
- Key Issues with Blockchain data access
-
Decentralization: Data lives in decentralized nodes, complexity adds up
-
Opacity: Data is often subjected to different levels of encryption
-
Sequential Data Storage: Data for transactions is stored in groups of blocks. Block structure has poor navigation capabilities
The value proposition for The Graph is very straightforward. They are reducing the friction associated with web3 product development.
-
- Key Issues with Blockchain data access
- Target User: Blockchain developers working for protocols that need to index and query data on-chain in an efficient and cost-effective manner.
- Product: Decentralized network for on-chain querying and indexing. This solves an important problem with blockchain technology in general, since accessing on-chain data requires developers to build indexing and querying infrastructure from scratch. By introducing the concept of a SubGraph —an indexing API built on GraphQL purpose built for each protocol— developers can now avoid the hassel of building indexing infrastructure from scratch, and jusr query data directly using their preferred protocol’s subgraph. The Graph monetizes their services through a fee per query.
- For this network to properly operate, it needs the following key network contributors:
-
Indexers: operators in The Graph network that stake Graph Tokens ($GRT) in order to provide indexing and query processing services. They are incentivizedby earning query fees and indexer rewards.
-
Delegators: network operators that delegate $GRT to indexers of their choice in exchange for a small percentage of their profits. Delegators secure the network without having to run a Graph Node.
-
Curators: network operators that parse through subgraphs and indicate when one of the subgraphs needs to be indexed by the network. They are incentivized by earning a share of the query fees that subgraphs generate.
The business model for The Graph is straightforward: monetize per query request. They are directly solving a user pain for web3 developers trying to build and scale their solutions effectively. As will be shown with the traction below, Product Market Fit is strong for The Graph.
-
- For this network to properly operate, it needs the following key network contributors:
- Traction to Date: The key metrics to measure the traction to date for The Graph Network is based on their Network Contributors(Analogous to employees), Query Fees Collected (Analogous to Revenue), Number of Subgraphs (Analogous to customers in a B2B sense) and on-chain token transfer ammounts.
- Network Contributors:
- Indexers
- Number of Indexers: 166
- Total Staked: 1.1B GRT = $99,561,000
- Delegators
- Number of Delegators: 9261
- Total Staked: 1.8B GRT = $162,918,000
- Curators
- Number of Curators: 2427
- Total Signaled (Deposited into Subgraphs): 5.6 M GRT = $506,856
- Indexers
- Query Fees Collected:
- Total Collected in the past three months: 531.2k GRT = $48,078
- Starting 3.5k GRT on April, 9.8k GRT on May, 91.4k GRT on June, 62k GRT on July
- x2.8 (April-May 2022)
- x9.32 (May-June 2022)
- x0.67 (June-July 2022)
- Number of Subgraphs: 397
- Notable Customers: ENS, Compound V2, Uniswap V2, Livepeer, USDC, Alchemy, Aave v2, Audius, SushiSwap, UMA, Synthetix, Snapshot, Curve, Decentraland Marketplace, CryptoPunks and many more…
- GRT Token Contract Transaction Data: The graph below was obtained from Etherscan, overlays the total Ammount of GRT tokens transferred and the total Transfer count over the last year. It is clear to see that the volume of transactions has remained fairly consistent, oscillating between 1.5k and 2.5k transactions daily.
- Network Contributors:
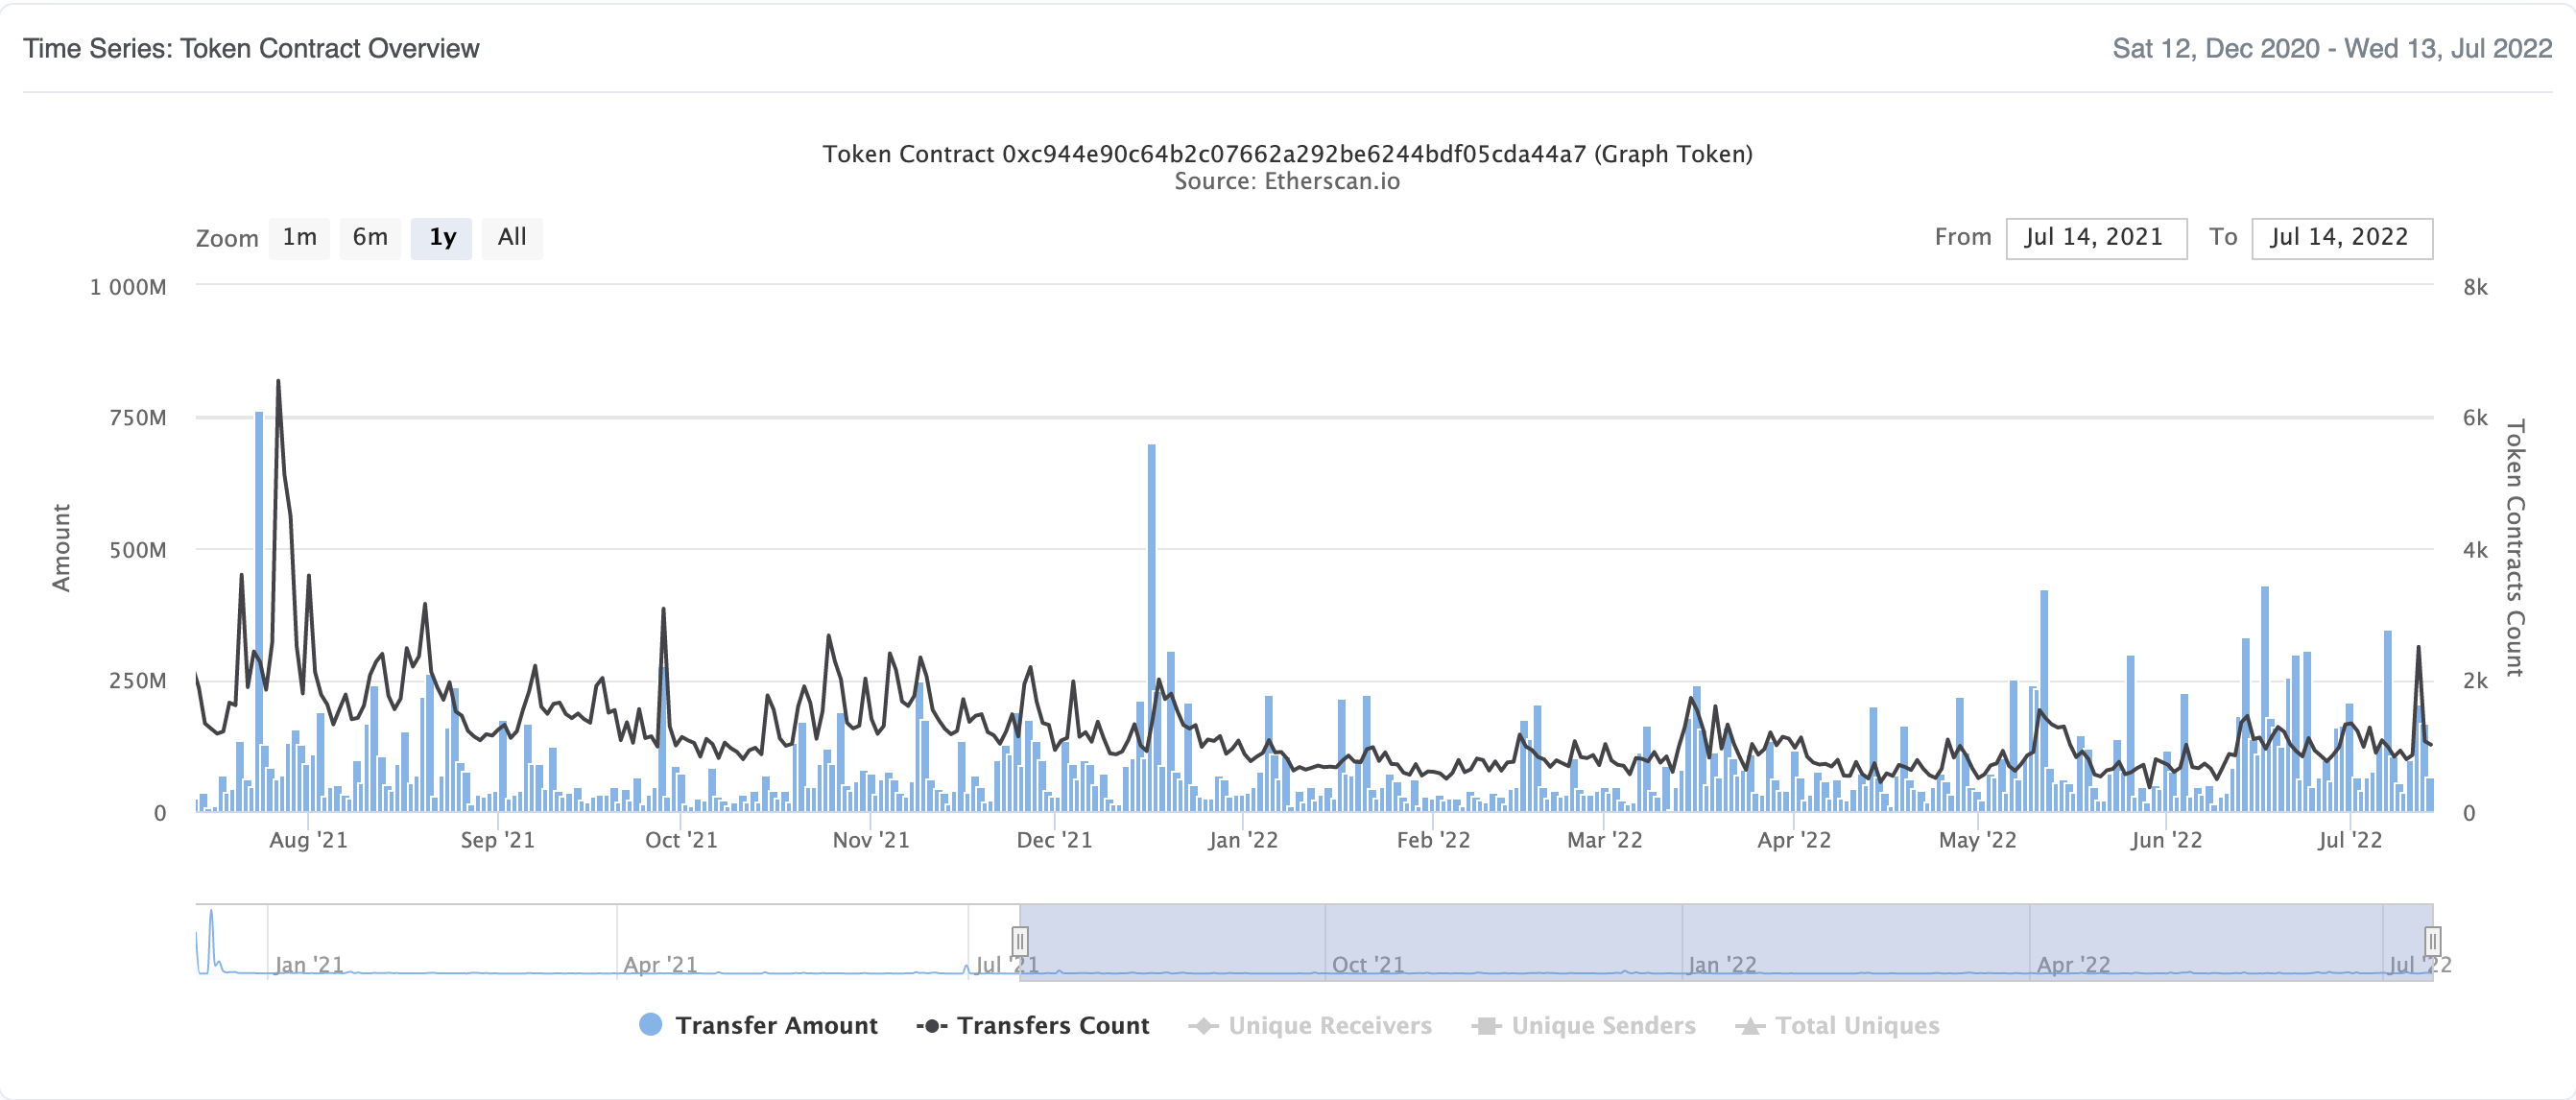
Given The Graph was only launched in December 2020, their traction to date has been impressive to say the least. With $99M staked by indexers, $162M staked by delegators and contract counts ranging in the thousands each day, The Graph is positioned to become a strong contender in the web3 infrastructure space.
Market Potential
-
According to Grand View Research, the Global Market Size for Blockchain Technology is $5.92B, and is expected to grow at a compound annual growth rate (CAGR) of 85.9% from 2022 to 2030 to a value of $844.42B.
-
The infrastructure & protocols segment dominated the market in 2021 and accounted for more than 62.0% share of the global revenue.
-
The Cloud Database and DBaaS market in the U.S. is estimated at US$140.33 Billion in the year 2020.
-
The global cloud computing market size is valued at US $445.3 Billion in 2021
-
From this we approximate that the share of Database as a Service sector of cloud computing represents 140.33/445.3 = 31.5% of the Cloud computing Market
-
In order to size the market opportunity for Database as a Service Providers in the Blockchain Infrastructure ecosystem, we will make the following assumption:
Assumption 1: The DbaaS segment for Blockchain will account for approximately 31.5% of the Blockchain Infrastructure segment once the market enters the later stages of solidification, where it has a couple of leading protocols. This assumption comes directly from the proportions of Database as a service providers compared to the broader cloud computing services market, which is a more stabilized market since its been around for decades.
-
With this, the market potential for The Graph protocol can be approximated:
-
Blockchain Technology Market Size (2030): $844.42B
-
Blockchain Infrastructure Technology Market Size (2021): $844.42B*0.62 = $523.54B
The Potential Market size for the Blockchain Database as a Service Market in 2030 is $523.54B*0.31.5 = $164.92B
-
Key Trends Driving Growth:
- Growth in birth of web3 protocols, where new tokens are being created at the tune of 100% YoY (2020-2021). With 4000, 8000 new tokens in 2020 and 2021 respectively.
- Evolution of Digital Technologies
- Transfer of data ownership to internet users
- Growing concerns about data security
- Growing adoption of cryptocurrencies
- Web3 Infrastructure (new protocols, layers 1 and 2, oracles, cloud solutions, etc.) represent a 33,3% of web3 VC preferred verticals
Tokenomics
All data obtained from The Graph Tokenomics site:
- Max Supply: 10,057,044,431 GRT (Maximum ammount of coins that will ever exist)
- Total Supply: 10,000,000,000 GRT (Max Supply - Tokens Burned)
- Circulating Supply: 6,900,000,000 GRT
- Circulation Ratio (Circulating / Total Supply): 0.69
- Burn Rate: The average annual burn rate is expected to be around 1%. This is not a fixed percentage.
- Mint Rate: Set to 3% for the first year. Future Mint Rate will be periodically reviewed via technical governance and can go as low as 0%. This is not a fixed percentage.
- Token Unlocks: The Graph protocol has different unlock percentages and periods for every type of ecosystem stakeholder. This is used as a way to stabilize the price of GRT, by locking stakes of the biggest tokenholders, effectively prohibiting them from dumping a big ammount of tokens and crashing the price of GRT. The table below presents the unlock schedules for the key GRT stakeholders:
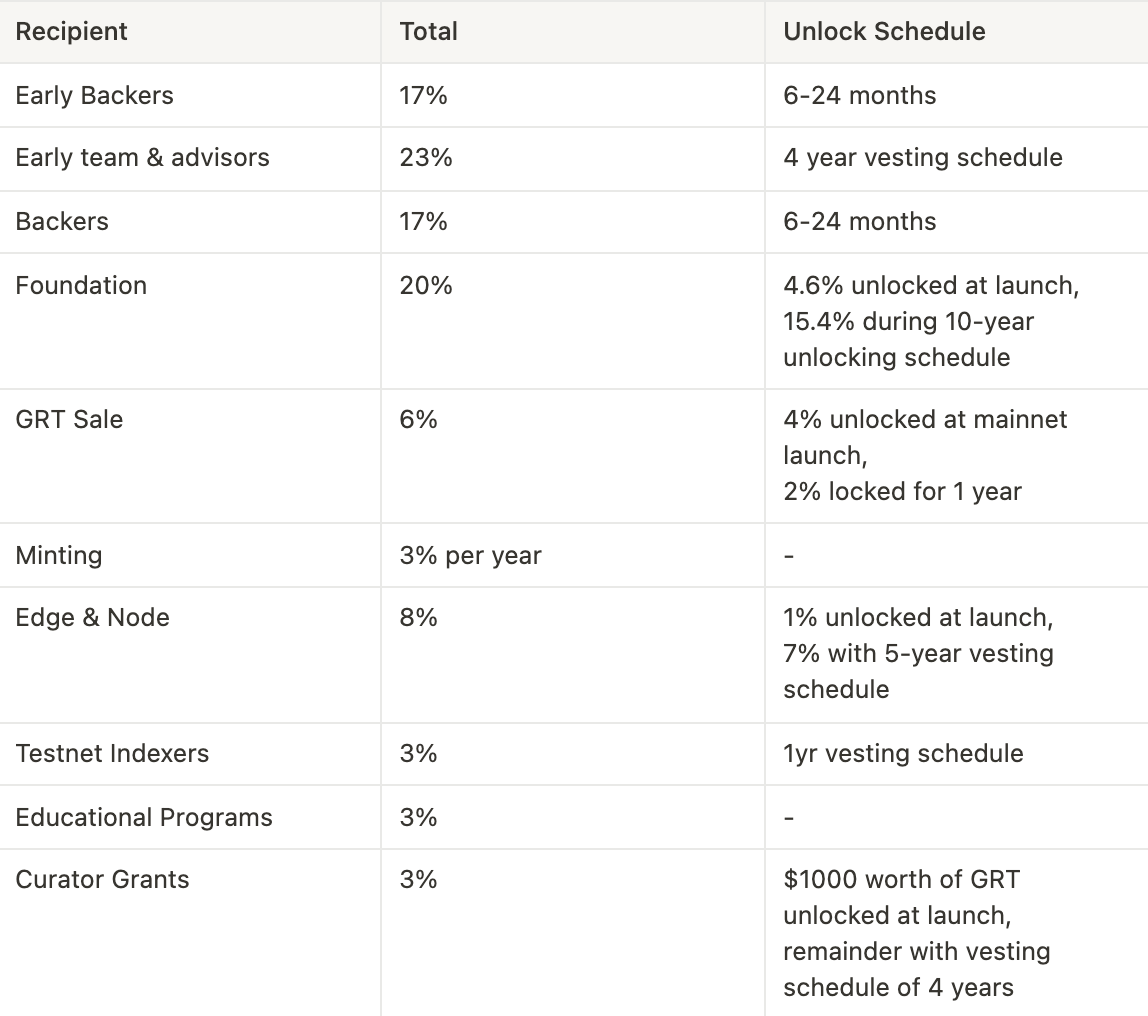
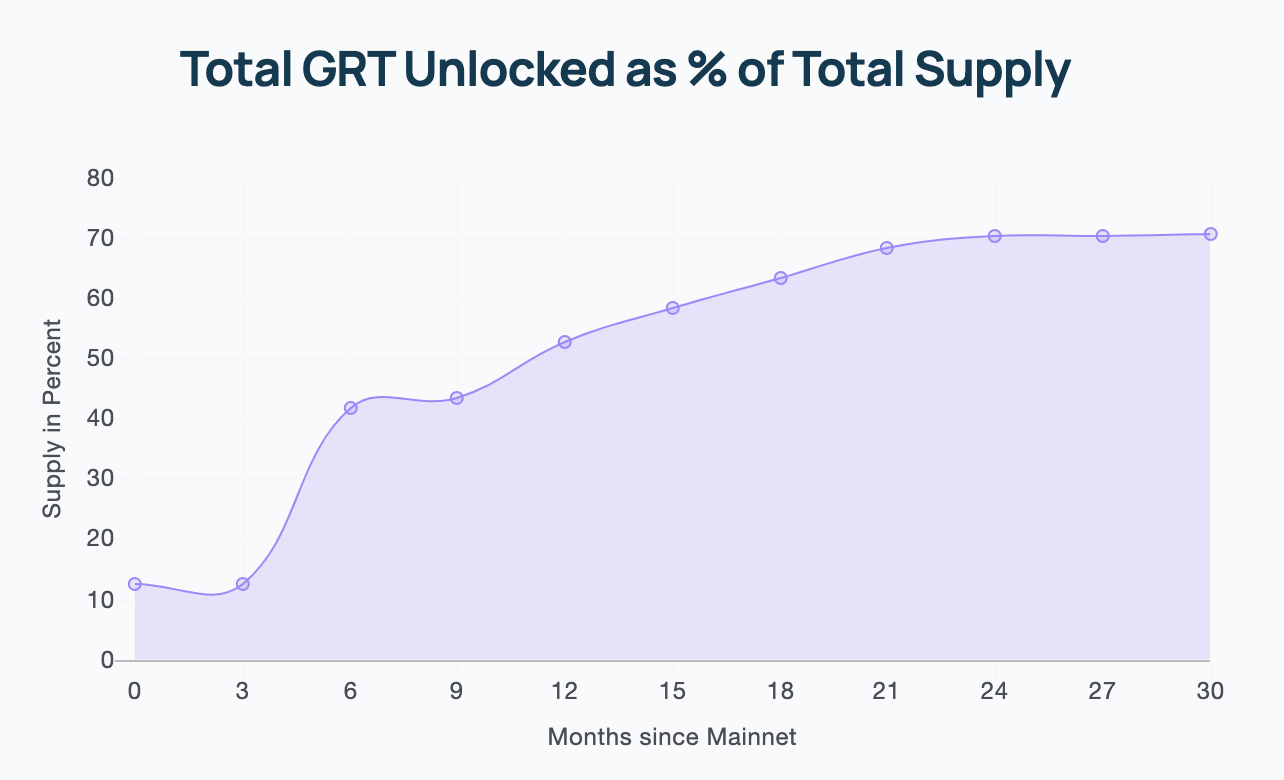
According to [Eqonex](https://learn.eqonex.com/news/trade-grt-on-eqonex-now#:\~:text=From launching on mainnet in,%2C and Compound%2C among others.), The Graph launched on mainnet on December 2020. As of the time this memo is being written (July 2022), we are at 19 months after mainnet launch. This means that according to the unlock schedule presented above, there stilll remains approximately a 5% of the GRT Supply to be unlocked for trading (for the remaining 11 months in this release schedule). According to [Tokpie](https://tokpie.io/blog/token-circulation-supply-how-increase-important/#:\~:text=The increase of token circulating,from coins of lazy owners.), an increase in circulating token supply has the following effects:
- If the token price is stable, a higher circulating supply is likely to increase the token’s market cap
- With an increase in market cap, the token will rise in the rankings, increasing the projects noticeability and further fueling website traffic, token purchases and users.
- Finally, with higher token circulating supply, the token’s price will be less affected by sudden increases in supply (i.e one wallet selling large quantities of GRT).
Alternatively, an increase in tokens circulating can lead to increased sell pressure on the token price. Given GRT is mostly held privately, this 5% increase in circulating supply is likely to be liquidated as soon as unlocked, making the scenario above the more likely one.
-
Approximately 95.83% of all GRT tokens are privately held, since the Public GRT Sale accounts for only 4.165% of the total GRT Supply.
This is important since it tells us that the price of the GRT token can easily be manipulated by the remaining 95.83% that is holding the token privately. This represents a compelling risk factor when considering an investment in the GRT token.
-
There is a small percentage of the token supply dedicated to the key activity performers: Indexers and Delegators.
This is a risky token design decision, since rewarding the key stakeholders in the ecosystem should be one of the top priorities to ensure the sustainability of the protocol on the long term.
Token distribution amongst GRT tokenholders is highly unequal, making this token highly volatile as the Gini Coefficient is 99.4%, with 100% representing one wallet owning all tokens.
See Appendix 1 for the computation of the Gini Index from On-chain tokenholder data.
Governance
This section explores how The Graph Protocol is governed, its initial founding team and plans for further decentralization:
Number of Proposals: 4 | Snapshot Members: 8,400 | Average Active Voters per Proposal: (331+191+370+303) /4 = 298.75 → 299 Voters/Proposal
From the data above we can see that The Graph community has a voter turnout rate of 3.56%.
Founding Team: Edge&Node
- Jannis Pohlmann Tech Lead & Co-Founder
- Brandon Ramirez Research Lead & Co-Founder
- Yaniv Tal Project Lead & Co-Founder
- Tegan Kline Business Lead
- Martin Tellechea Community Lead
- Rodrigo Coelho Operations Lead
- Carl Hagerlin Creative Director
- Nena Djaja Product Engineering Lead
- Ariel Barmat Smart Contracts Lead
The Graph Council
“Perhaps the most important governance group for The Graph protocol. The members of The Graph Council were inaugurated in December 2020. The Graph Council governs the decentralized Graph Network. A 6-of-10 multisig balances the interests of five different stakeholder groups in the ecosystem: Indexers, token holders, initial team, users and technical domain experts” - The Graph academy
The Graph Council is responsible for the following functions
- The Graph Foundation Operations
- Grants and Ecosystem Funding
- Protocol Upgrades
- Protocol Parameterization
- Emergency Protocol Operations
According to The Graph Academy, in the future, it is planned to further decentralize The Graph's governance, for instance by replacing individual members with nested multisigs or DAOs.
The members of The Graph Council are presented below:
- Jim Cousins Indexers
- Gary Morris Indexers
- Justin J Moses Users
- Kayvon Tehranian Users
- Santiago Palladino Researchers
- Yondon Fu Researchers
- Michael Anderson Backers
- Spencer Noon Backers
- Brandon Ramirez Initial Team
- Yaniv Tal Initial Team
The Graph Council is cleverly comprised of two of each user class that actively participates in the protocol. This ensures a balanced opinion board when the time comes for decisionmaking around the protocol. The only risk with this governance model is who appoints the council members? Currently, these members were not voted in by the community, which presents the risk of centralization for a protocol aiming to decentralize its governance.
AdvocateDAO
“The Graph Advocates is a community-driven initiative serving as a portal into web3 for people all across the world. Advocates have the unique opportunity to learn and contribute to The Graph community and web3 mission. Anyone can become an Advocate and subsequently join the Graph AdvocatesDAO.” - The Graph Academy
While AdvocateDAO does not have any governance into The Graph protocol, they are an important group in The Graph ecosystem to ensure proper community building. Given the importance of community building in web3, this is a great foundation for a strong community.
Voting
The Graph has recentrly rolled out a feature to allow tokenholders, indexers and delegators to vote on governance proposals through Snapshot The bar for voting on these proposals is very low, users need to have at least one GRT token to have their vote accounted for.
According to The Graph Academy, voting power on Snapshot is not a one token equals one vote mechanism. Instead, there is a weighed voting depending on the contribution that is made to the network.
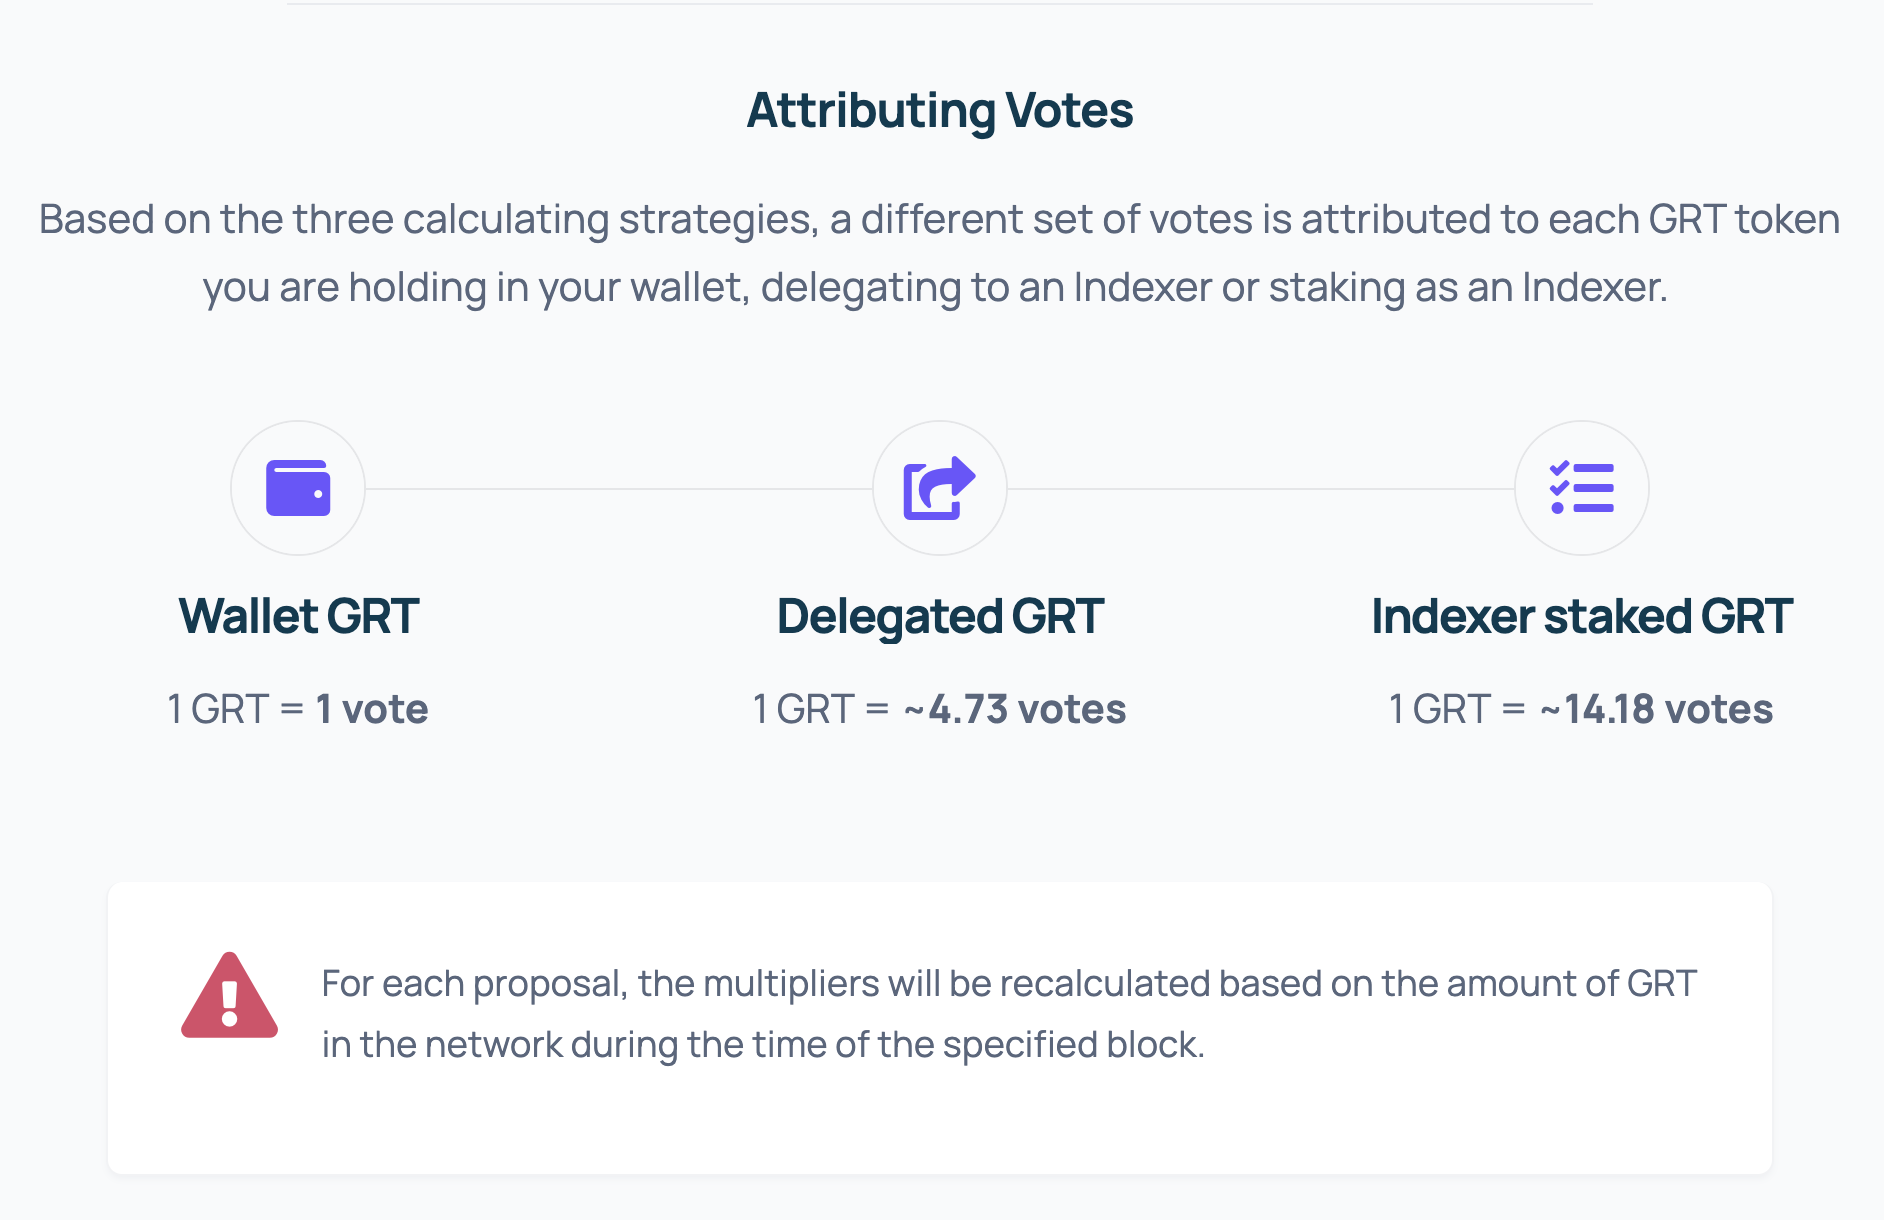
Voting on The Graph protocol is done through Snapshot and each vote is weighed depending on the ammount of GRT in the network suring the specified timeblock being processed. The screenshot above represents how Wallet GRT, Delegated GRT and Indexer Staked GRT have different weights and thus result in a more fair voting system, since Indexers are the ones performing the computational tasks of querying and indexing. Their vote should and does take precedence over the vote of a Wallet GRT holder.
Investment Rationale
Overall, based on the research presented above, I’m convinced by GRT’s value proposition but very turned off by this project’s token design.
They are targeting the right problem, for the right user at the right time, and have the right team and governance to show for it. With the number of use cases for blockchain growing at an exponential rate, I see this protocol will become central to the majority of current and new protocols in the web3 space.
GRT token ownership is widely unequal, where the allocation for indexers (key network participants) stands much lower than early backer or founding team allocation. This is a very big risk for this protocol’s survival in the long term.
Positives
The value proposition for The Graph is very straightforward. Their Value Proposition is to reduce the friction associated with web3 product development, specifically indexing and querying data from the blockchain.
The business model for The Graph is fairly straightforward: monetize per query request. They are directly solving a user pain for web3 developers trying to build and scale their solutions effectively.
Given The Graph was only launched in December 2020, their traction to date has been impressive to say the least.
- Total Value Staked: $99M staked by indexers, $162M staked by delegators
- Current Customers are leading protocols such as: Uniswap, Synthetix, Decentraland, Aragon and Aave
- Backed By: Framework Ventures, Coinbase Ventures, DCG, ParaFi Capital, Collider Ventures and numerous other institutional investors. With its key partnerships, current customer track record and total value staked, The Graph is positioned to become a strong contender in the web3 infrastructure space.
The Potential Market size for the Blockchain Database as a Service Market in 2030 is $523.54B*0.31.5 = $164.92B
The key trends driving growth in this space are:
- Growth in birth of web3 protocols, where new tokens are being created at the tune of 100% YoY (2020-2021). With 4000, 8000 new tokens in 2020 and 2021 respectively.
- Evolution of Digital Technologies
- Transfer of data ownership to internet users
- Growing concerns about data security
- Growing adoption of cryptocurrencies
- Web3 Infrastructure (new protocols, layers 1 and 2, oracles, cloud solutions, etc.) represent a 33,3% of web3 VC preferred verticals
Governance
- The Graph Council is cleverly comprised of two of each user class that actively participates in the protocol. This ensures a balanced opinion board when the time comes for decisionmaking around the protocol.
Voting
- Done thru Snapshot, each vote is weighed depending on the ammount of GRT in the network suring the specified timeblock being processed.
- Since Indexers are the ones performing the core activity of the protocol, their vote is more powerful than the vote of a Wallet GRT holder. The Graph protocol has properly designed voting power around who performs the key activity, this is a sign of efficient governance.
Negatives
Unequal token Distribution
The price of the GRT token can easily be manipulated by the remaining 95.83% that is holding the token privately. The Gini Coefficient for this token is 99.4%
This represents a compelling risk factor when considering an investment in the GRT token.
Low Voter Turnout
The Graph community has an average voter turnout rate of 3.56%. Meaning the community is not as active in the governance of the protocol, making it more centralized.
This is a risk factor worth considering when investing in $GRT
What’s Next?
- Connect with me on Twitter
- Connect with me on LinkedIn
- Subscribe to my mirror.xyz newsletter
- Read the Disclaimer below
Disclaimer
This Content is for informational purposes only, you should not construe any such information or other material as legal, tax, investment, financial, or other advice. Nothing contained on this site constitutes a solicitation, recommendation, endorsement, or offer by me or any third party service provider to buy or sell any securities or other financial instruments in this or in in any other jurisdiction in which such solicitation or offer would be unlawful under the securities laws of such jurisdiction.
Appendix 1: Token Gini Index Calculation using On-Chain Data
Named after Italian statistician Corrado Gini, the Gini coefficient is a way to measure the income distribution of a population. The value for the Gini coefficient ranges from 0 to 1 where higher values represent greater income inequality and where:
- 0 represents perfect income equality (everyone has the same income)
- 1 represents perfect income inequality (one individual has all the income)
On the vein of understanding the level of equality in token distribution for GRT we proceed to compute the Gini Index for the GRT token using on-chain data from Etherscan:
import pandas as pd #We import required libraries
import numpy as np
df = pd.read_csv('GRT_HolderData.csv') #Import Etherscan data
df = df.drop(columns=['PendingBalanceUpdate']) #Drop unneccesary columns

def gini(x):
#Define function to calculate Gini coefficient
    total = 0
    for i, xi in enumerate(x[:-1], 1):
        total += np.sum(np.abs(xi - x[i:]))
    return total / (len(x)**2 * np.mean(x))

balances = df['Balance'].array #We convert the balances to an array data type
gini(balances) #We compute the Gini Coefficient for all wallets
After running the code above, the Gini Coefficient for all wallets holding $GRT is 0.9970944291810845, which is very very close to one. We proceed by looking at the top 10 GRT holders:
df.sort_values(by='Balance', ascending=False).head(10) #Represents the Top 10 Wallets
According to Etherscan, the top three tokenholders are actually The Graph Lockup wallets that are holding the tokens under lockup. So a better quantification of the Gini Index for actual owners distinct from the lockup protocols can be calculated by removing the top three wallets.
df = df.sort_values(by='Balance', ascending=False)
df = df.drop(index = [65473,1570, 1528]) #Hard coded the indexes for the top wallets
balances_n = df['Balance'].array #We re-calculate the Gini Coefficient
gini(balances_n)
The revised Gini Coefficient is 0.99416, which is only a variation of 0.00293 after removing the custodial wallets.