
All charts have the queries in the sub-header! This is my first Mirror post, so please feel free to reach out to me on Twitter for edits or add-ons @biff_buster Cheers!
Overview
The cryptocurrency market has seen tremendous growth over the past few years, with the total market capitalization rising from about $10 billion in January 2016 to over $1.3 trillion in January 2021 (according to coinmarketcap). Despite this overall growth, there are still several challenges facing the crypto market following the aftermath of Celsius, FTX and many others collapse. Some of these challenges include regulatory uncertainty, lack of transparency, market manipulation and much more. With all this negative news and price movement, one would think 2021 - 2022 entrants have given up and see no light at the end of the tunnel. In this analysis, our goal is to analyze user on-chain activity to find bullish or bearish trends heading towards the end of the first month of the new year.
Methodology
Our objective will be to measure on-chain metrics from 8 major blockchains to track growth or slowdown in user activity. (Bitcoin, Ethereum, BNB, Polygon, Arbitrum, Optimism, Solana, Avalanche) We will also be looking at aggregated transactions, trading volume, active users, gas usage, token prices and much more to answer the following questions:
-
Does the outlook of the crypto market forecast a bullish or bearish trend?
-
Are users leaving the space after the FTX collapse or has the contagion faded away? Support your thesis.
I used Dune Analytics V2 query engine to write and run my queries. You can find the tables used in the sources below.
Analysis
Since the collapse of FTX, crypto markets have struggled to get back to normal. With funds going insolvent, protocols winding down, and layoffs reaching yearly highs, what other reasons would users and investors want to stay? We’ve made sure to highlight a few promising trends.
Below we will be breaking down withdrawals since November 8th, followed by daily aggregated cross chain activity. We can usually tell the strength of an ecosystem from a variety of factors, to name a few:
-
Decrease in deposits to Centralized Exchanges (CEX)
-
Increase in Daily Active Users (DAU) and transactions
-
Increase in network usage (gas consumption)
Lets break down our analysis in 3 main parts:
-
CEX Withdrawals since FTX
-
Active Users Per Chain
-
Contracts Created Per EVM Chain
CEX Withdrawals
The following chart only contains the labeled CEX wallet addresses on Etherscan. (Possibly missing some other wallet addresses)
Exchanges Listed:
-
Coinbase
-
FTX
-
Gate.io
-
Kraken
-
Kucoin

(Data from January 18th, 2023)

Taking a look 120 days back we can clearly see the build up of withdrawals from Centralized exchanges leading up to November 7-8th when FTX started to freeze withdrawals. However, looking past November, withdrawals reached 6 month lows and have since stabilized. We can even see an uptick in withdrawals leading up to 12th of January…
Cross Chain User Activity

Cross chain transactions have also seen noticeable declines, especially from Solana who seems to carry over 70% of the blockchain transaction market share (According to Dune Analytics).
Next we will be looking at daily active users and transactions per chain. This will give us an idea of how active each chain is, and which chains are thriving more than others. The data is only going back 120 days, so we can see 2 months before FTX up to now.

(Data from January 18th, 2023)
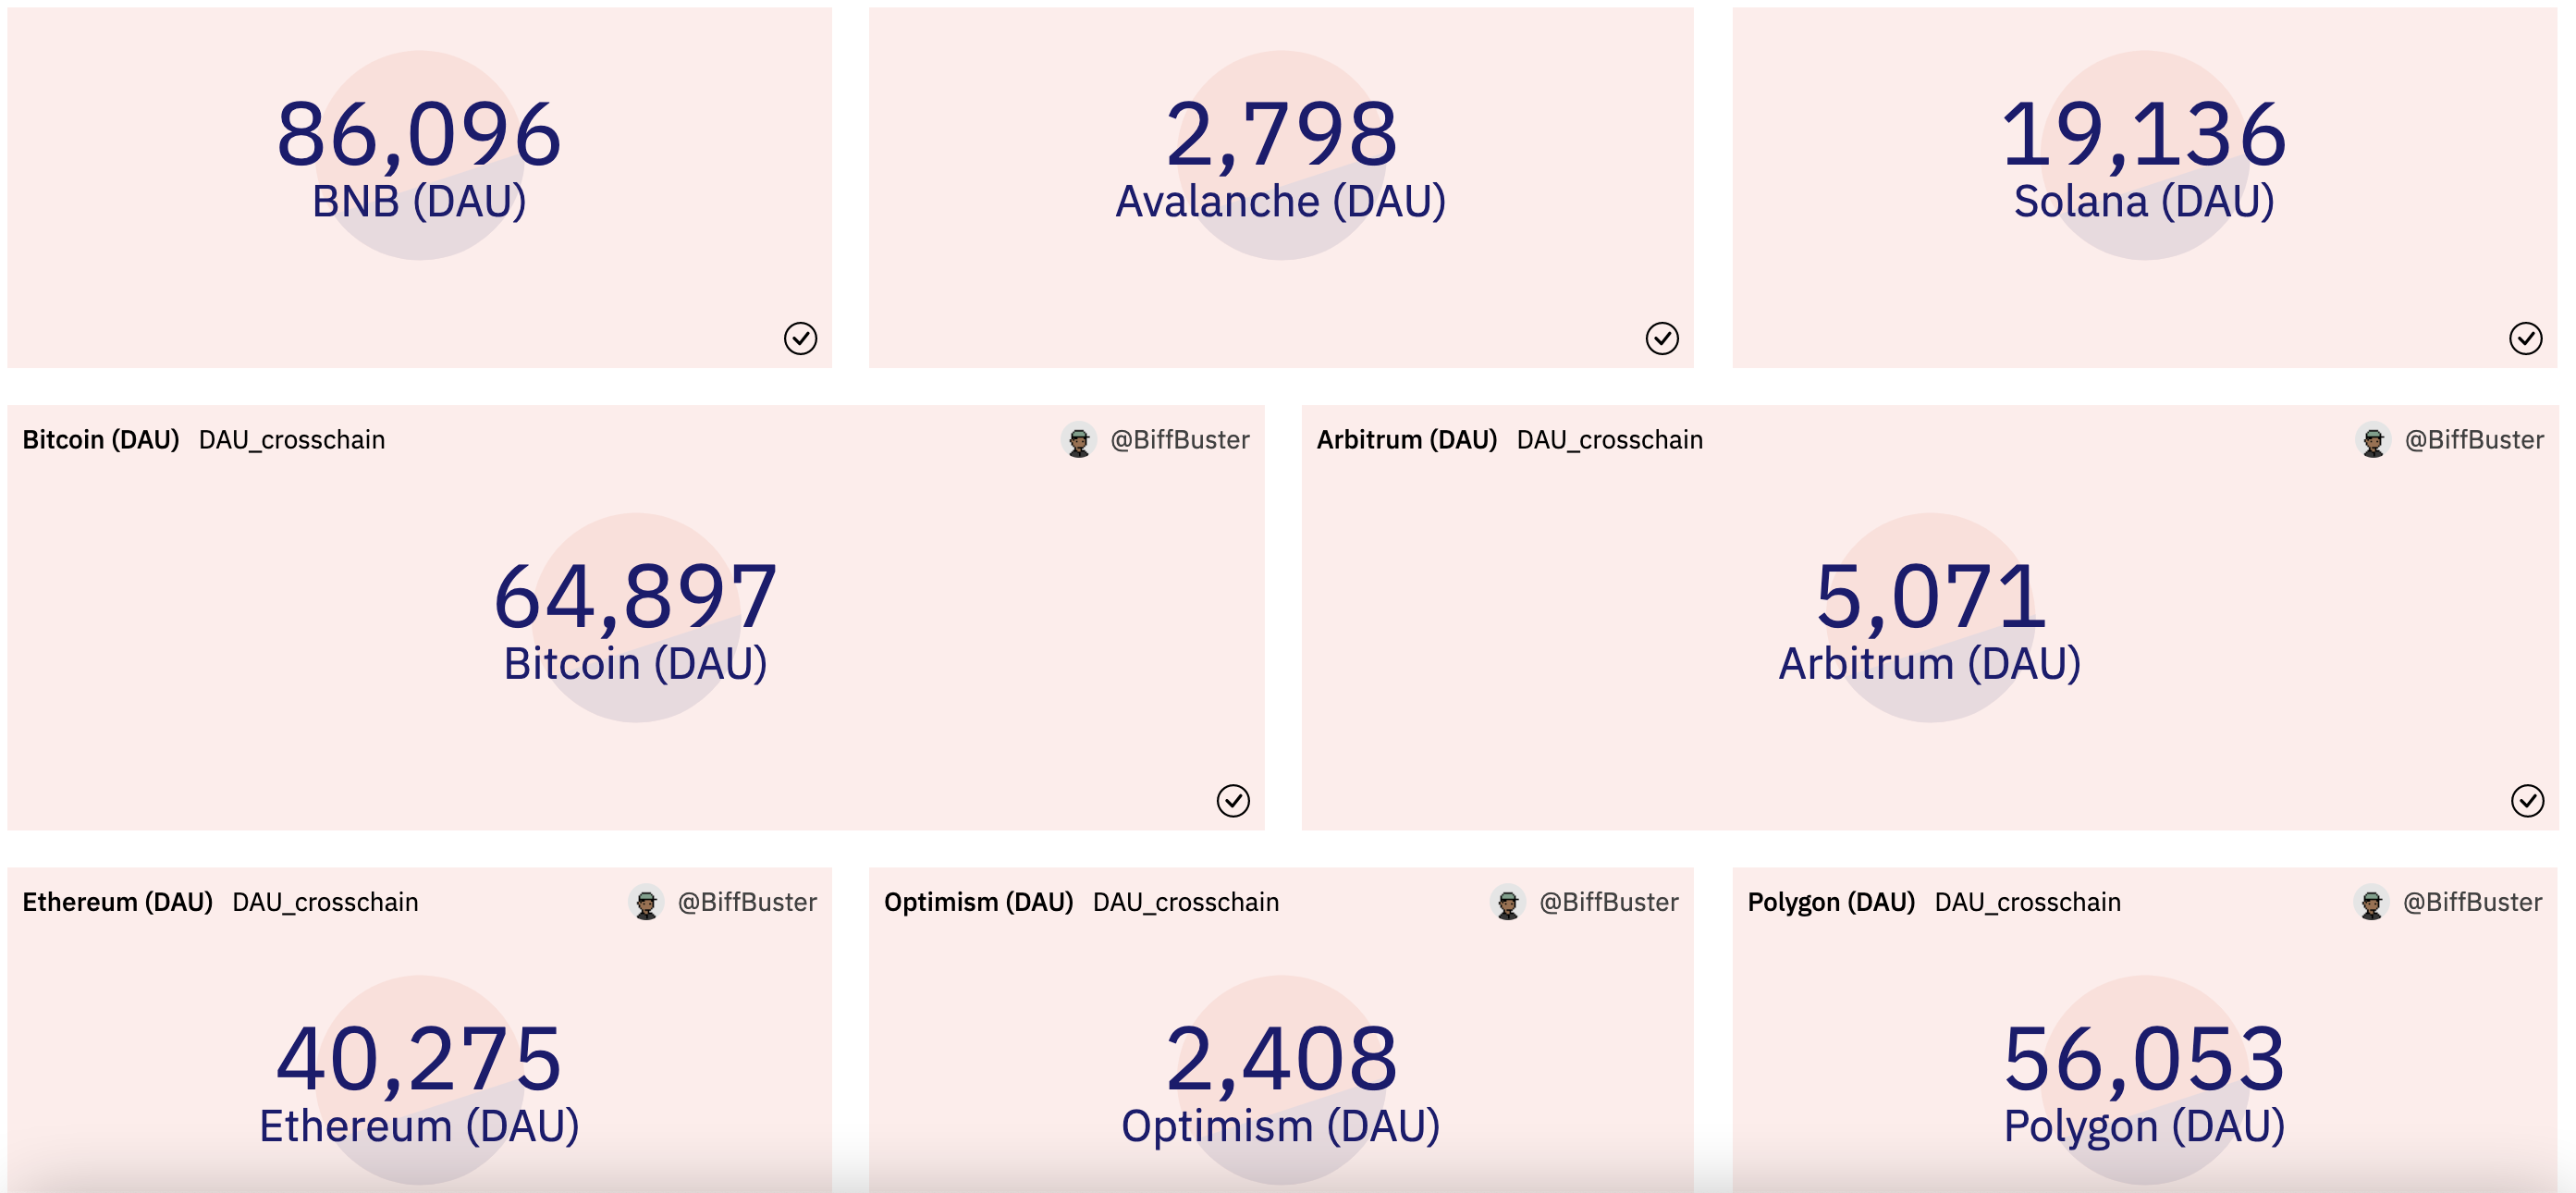
Our data shows that there is a small lag in activity towards the end of December, but immediately picks back up around the first of the year as the market began its next leg up. We can also make the assumption that there are over 250,000 active blockchain users in 2023.
Contracts Created
Another important metric we will be taking a look at is the number of smart contracts created by EVM chains (Yes, this will exclude Bitcoin and other non-EVM chains). Contract creation is an important metric because it shows that the blockchain is being used and that there is a strong developer community building decentralized applications on it. Lets take a look below:

It seems that Binance Chain, and Polygon have the most contract creations daily. This is a tremendous increase from September 2022, up nearly 400% and shows that buildoors will stay building no matter the environment. Keep in mind also that I am missing plenty of very active blockchains and L2 protocols..
Conclusion
Overall, there are lots of opportunities in all ecosystems. Some current trends that have been hot for a few months are Liquid Staking Derivatives, while other innovative technologies like Zero-Knowledge proof tech are yet to be released on mainnet. Even with uncertain macroeconomic conditions and regulations ensuing, the crypto community is still active and developers are continuing to contribute.
Key Takeaways:
-
CEX withdrawals have stabilized since the FTX contagion.
-
There is a significant decrease in on-chain trading activity since the collapse of FTX in November 2022 but lots of blockchain usage.
-
Users seem to keep there money on-chain entering the new year, as L2 chains begin to pick up momentum.
Disclaimer:
Of course I must mention that this content is for informational purposes only, you should not construe any such information or other material as legal, tax, investment, financial, or other advice.
Sources:
-
The following tables were used from Dune for this analysis:
-
ethereum.transaction -
bitcoin.transactions -
bitcoin.inputs -
bnb.transactions -
optimism.transactions -
arbitrum.transactions -
polygon.transactions -
solana.transactions -
avalanche.transactions
-
-
This is a submission for @MetricsDAO In the News - 12:
-
You can find the corresponding Dune dashboard with queries and all: Dune Dashboard
-
Thanks for viewing! Buy me a coffee at biffbuster.eth 🤝
