
1. Research Introduction
1.1 Research Background
This year, the market has been buzzing about VC-backed tokens with high Fully Diluted Valuations (FDV) but low circulating Market Caps (MC). With new tokens launched in 2024, the MC/FDV ratio has dropped to its lowest level in three years, signaling a massive wave of future token unlocks. While the initial low supply might pump prices short-term as demand spikes, this hype lacks staying power. Once unlocks flood the market, oversupply risks tanking prices, and investors are left wondering if these setups can sustain any real gains.
That’s why many are pivoting from VC tokens to meme coins. Meme coins drop most of their supply at TGE (Token Generation Event), rocking high circulation and no unlock FUD (Fear, Uncertainty, Doubt). This structure cuts supply pressure, giving investors more confidence. With MC/FDV ratios near 1, holders dodge dilution drama, creating a stable vibe. As fears of massive unlocks grow, degens are flocking to these high-liquidity, low-inflation plays — even if they’re light on “utility.”
In this meta, picking tokens is high-stakes. Solo DD (Due Diligence) is tough, so centralized exchanges (CEXs) step in as gatekeepers, vetting tokens for compliance and hype potential. Some say decentralized exchanges (DEXs) will eat CEXs’ lunch, but Klein Labs isn’t buying it. CEXs hold the line with slick UX (User Experience), custodial trust, deep liquidity, and regulatory flex — their market share ain’t budging.
So, how do CEXs pick winners? How did 2024’s listed tokens perform? Does the exchange matter? To tackle these questions, this research dives into listing trends, volume shifts, and price action to decode the real impact of CEXs on token performance post-launch.
1.2 Research Methods
1.2.1 Research Subjects
We categorize exchanges based on their founding location and target markets into three main types:
Founded by Chinese individuals or groups, targeting the global market: Binance, Bybit, OKX, Bitget, KuCoin, Gate, etc. These are well-known exchanges primarily founded and invested in by Chinese individuals, serving the global market. There are many Chinese-founded exchanges, and for the convenience of this study, we selected exchanges with different development characteristics. The unselected exchanges also have their own advantages.
Founded in Korea, targeting the local market: Bithumb, UPbit, etc. These primarily serve the Korean domestic market.
Founded in the United States, targeting European and American markets: Coinbase, Kraken, etc. These are American exchanges mainly serving the European and American markets, typically under strict regulation by agencies like the SEC and CFTC.
Exchanges from other regions such as Latin America, India, and Africa have a combined trading volume and liquidity of less than 5%, so they are not deeply analyzed in this report.
We selected a total of 10 representative exchanges from the above categories to analyze their listing performance, including the number of listing events and their subsequent market impact.
1.2.2 Time Range
The research primarily focuses on the price changes of tokens on the 1st day, the first 7 days, and the first 30 days after their Token Generation Event (TGE). We analyze the trends, volatility patterns, and market reactions during these periods for the following reasons:
-
On the first day of TGE: The new asset is issued, and trading volume is highly active, reflecting the market's immediate acceptance. This day is heavily influenced by the rush to buy and FOMO (Fear of Missing Out) emotions, making it a critical stage for the market's initial pricing.
-
In the first 7 days after TGE: The price changes capture the market's short-term sentiment towards the new token and provide an initial assessment of the project's fundamentals. This period helps measure the sustainability of market enthusiasm and allows the price to settle into a more reasonable initial valuation for the project.
-
In the first 30 days after TGE: This period observes the token's long-term support. As short-term speculation cools down and speculators gradually exit, whether the token's price and trading volume are maintained becomes an important indicator of market recognition.
1.2.3 Data Processing
This study employs a systematic data processing method to ensure the scientific rigor of the analysis. Compared to common research methods in the market, this study stands out for its intuitiveness, conciseness, and efficiency.
In this research report, data is primarily sourced from TradingView, encompassing price data for tokens newly listed on major exchanges in 2024. This includes initial listing prices, market prices at various time points, and trading volume data. With a large number of sample points, this extensive data analysis helps minimize the impact of individual anomalous data on overall trends, thereby enhancing the reliability of the statistical results.
(I) Multivariate Overview of Listing Activities
This study adopts a multivariate analysis approach, comprehensively considering factors such as market conditions, trading depth, and liquidity to ensure the results are both thorough and scientifically sound. We compared the average price changes of new tokens across different exchanges and conducted an in-depth analysis tied to the market positioning of these exchanges (e.g., user base, liquidity, and listing strategies).
(II) Using Averages to Judge Overall Performance
To assess the market performance of tokens, we calculated their percentage change relative to the initial listing price, using the following formula:

Recognizing that extreme market cases could skew the overall data trend, we excluded the top 10% and bottom 10% of extreme outliers. This step reduces the interference from sporadic market events (such as sudden positive news, market manipulation, or liquidity anomalies) on the statistical results. This processing method ensures the results are more representative, accurately reflecting the true market performance of new tokens across different exchanges. Subsequently, we calculated the mean of the price changes for new tokens on each exchange to evaluate the overall performance of the new token market on various platforms.
(III) Using Coefficient of Variation to Judge Stability
The Coefficient of Variation (CV) is an indicator used to measure the relative volatility of data, calculated as follows:

where σ is the standard deviation, and μ is the mean. As a dimensionless indicator, CV is unaffected by data units, making it ideal for comparing volatility across different datasets. In market analysis, CV is primarily used to gauge the relative volatility of prices or returns. In the context of exchange or token price analysis, CV reflects the relative stability of different markets, providing investors with a foundation for risk assessment. We opted for CV over standard deviation here due to its greater applicability in this scenario.
2. Listing Activities Overview
2.1 Exchange Comparison
2.1.1 Listing Volume and FDV Preferences

We found that, based on overall data, top-tier exchanges such as Binance, UPbit, and Coinbase generally have fewer listings compared to other exchanges. This reflects how an exchange's market position influences its listing style.
In terms of the number of listings, exchanges like Binance, OKX, UPbit, and Coinbase enforce stricter listing rules, resulting in fewer but larger-scale listings. In contrast, exchanges like Gate list new assets more frequently, offering more trading opportunities. The data indicates that the number of listings is generally negatively correlated with Fully Diluted Valuation (FDV), meaning exchanges that list more high-FDV projects tend to have fewer listings overall.
Centralized Exchanges (CEXs) adopt different strategies to prioritize listings, focusing on varying levels of Fully Diluted Valuation (FDV). Here, we categorize projects by their FDV to better understand the listing standards of exchanges. When valuing tokens, we often consider both Market Cap (MC) and FDV, as they together reflect a token’s valuation, market size, and liquidity.
-
MC only calculates the total value of currently circulating tokens and does not account for future unlocked tokens. This can underestimate a project’s true valuation, especially when most tokens are yet to be unlocked, potentially leading to misguidance.
-
FDV, on the other hand, is based on the total token supply and provides a more comprehensive view of a project’s potential valuation. It helps investors assess future selling pressure risks and long-term value. For projects with low MC/FDV ratios, FDV has limited short-term reference value and serves more as a long-term indicator.
Therefore, when analyzing newly listed tokens, FDV is more referential than Market Cap. Here, we choose FDV as the standard.
Additionally, regarding their approach to initial listings, most exchanges adopt a balanced strategy, considering both initial and non-initial listings. However, they typically impose higher requirements for non-initial listings because initial listings tend to attract more new users. Meanwhile, the two Korean exchanges, UPbit and Bithumb, primarily focus on non-initial listings. This is because, compared to initial listings, non-initial listings reduce screening risks and avoid the market volatility and initial liquidity issues associated with new launches. At the same time, for project teams, non-initial listings allow them to leverage existing market recognition to drive growth without the burden of excessive market promotion and liquidity management.
2.1.2 Track Preferences
Binance
In 2024, meme coins continue to dominate Binance’s listings in terms of quantity. Infrastructure (Infra) and decentralized finance (DeFi) projects also hold a significant share. Real-world asset (RWA) and decentralized physical infrastructure network (DePIN) tracks see fewer listings on Binance, but their overall performance stands out. Notably, USUAL’s spot price surged by a maximum of 7081%. Although Binance adopts a cautious approach to listing in these areas, the market typically reacts positively once projects go live. In the second half of the year, Binance’s listing preferences in the AI track leaned heavily toward AI Agent tokens, which accounted for the highest proportion among AI-related projects.
In 2024, Binance showed a clear preference for its BNB ecosystem. Listings like BANANA and CGPT highlight Binance’s increasing support for its own blockchain ecosystem.
OKX
From a listing volume perspective, OKX also has the highest number of meme coins, making up about 25% of its total. Compared to other exchanges, OKX focuses more on layer-1 blockchains (L1s) and infrastructure tracks, which together account for an impressive 34% of listings. This suggests that in 2024, OKX prioritizes underlying technological innovation, scalability improvements, and the sustainable development of blockchain ecosystems.
In emerging tracks, OKX takes a restrained approach: it listed only 4 AI tokens (including DMAIL and GPT), 3 RWA tokens, and 3 DePIN tokens. This reflects OKX’s cautious strategy toward newer, less-established categories.
Upbit
Upbit’s defining trait in 2024 is its broad coverage across tracks, with generally strong token performance. In 2024, it listed UNI and BNT in the decentralized exchange (DEX) track, indicating untapped potential and room for growth in popular asset categories. Many mainstream or high-market-cap tokens remain unlisted, suggesting future expansion opportunities. This also underscores Upbit’s rigorous vetting process, favoring assets with long-term potential over speculative picks.
Token performance on Upbit is notably strong across various tracks. Tokens like PEPE (Meme), AGLD (Gaming), DRIFT (DeFi), and SAFE (Infra) saw significant short-term gains, ranging from 100% to over 150%. UNI, for example, rose 93.5% by Day 30 compared to its first day. This reflects the high level of trust Korean users place in Upbit’s listing choices.
Ecosystem Insights: From a blockchain ecosystem perspective, Solana and TON remain highly favored. Additionally, centralized exchanges (CEXs) are increasingly bolstering their own blockchain ecosystems. For instance, Binance continues to strengthen support for its BSC and opBNB chains. Similarly, Coinbase’s Base has become a key focus, accounting for nearly 40% of all new token listings in 2024. OKX is steadily building out its X Layer ecosystem, while Kraken’s planned layer-2 network, Ink, signals that top exchanges are actively advancing on-chain infrastructure.
This trend reflects a broader shift as exchanges transition from off-chain to on-chain operations, expanding their scope and enhancing their competitiveness in DeFi. By supporting projects on their own chains, exchanges not only foster ecosystem growth but also boost user retention and capture greater profits from new asset issuance and trading. Looking ahead, this suggests that exchange listing strategies will increasingly favor projects within their own ecosystems, amplifying the activity and market influence of their blockchain networks.
2.2 Time Dimension Analysis

-
The trend in the number of listing events is highly consistent with BTC price fluctuations. During periods when BTC is rising (February to March and August to December), there are more listing events, whereas when BTC is stable or declining (April to July), the number of listing events drops significantly.
-
Top-tier exchanges (Binance, UPbit) experience less impact on their listing activities during bear markets, and their share of listings actually grows during these times, showcasing stronger market dominance and resilience against market cycles.
-
Bitget’s listing numbers remain relatively stable, with market volatility having minimal effect, while other exchanges see greater fluctuations in their listing pace. This could be tied to Bitget’s more balanced listing strategy.
-
Gate and KuCoin maintain higher listing frequencies, but their listing numbers vary widely with market conditions, indicating they may depend more on the elevated liquidity of new projects during bull markets to attract users.
3. Trading Volume Analysis
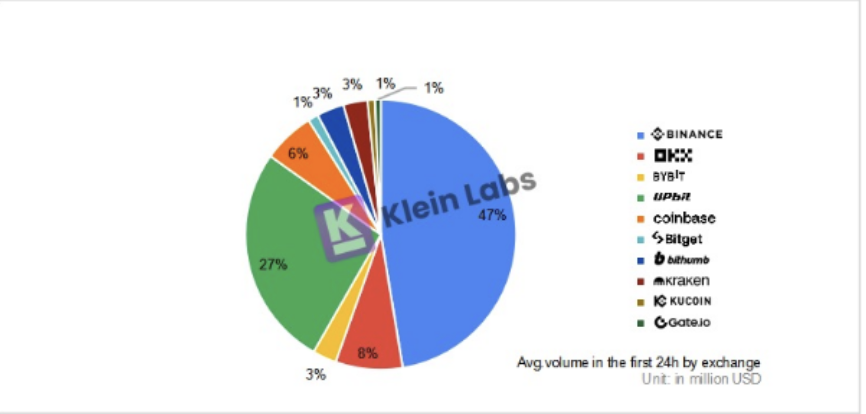
3.1 Overview of Trading Volumes Across Different Exchanges

-
UPbit: Within 24 hours of a token listing, UPbit captures an extremely high share of trading volume, even surpassing half of Binance’s volume. This demonstrates its strong short-term market appeal and significant liquidity inflow. Although its share slightly declines after 30 days, it still maintains a high market share, nearly equaling the combined shares of top exchanges like OKX, Coinbase, and Bybit. This highlights UPbit’s critical position in the listing market.
-
Binance and OKX: Both exchanges exhibit steady growth in trading volume, maintaining leading market shares over 30 days, which reflects strong market recognition and deep liquidity. Binance’s share rises from 47% within the first 24 hours to 53% after 30 days, reinforcing its long-term market dominance, while OKX also sustains a high share after 30 days.
-
Bybit and Bithumb: Bybit performs well in both short-term and long-term trading volumes, remaining stable. Bithumb’s market share slightly increases after 30 days, indicating its ability to retain early trading volume and attract more liquidity. This suggests Bithumb’s growing competitiveness in the listing market.
Despite Korean exchanges being known for favoring non-initial listings, the data shows these projects still generate robust trading volumes. The core reasons for this lie in Korea’s unique market environment:
Korean Trading Market’s Isolation and Liquidity Concentration
-
Market Isolation: Due to strict local KYC (Know Your Customer) policies, overseas users are largely unable to directly use Korean exchanges, creating a relatively closed trading ecosystem. As a result, a large number of local users trade on Korean platforms, leading to concentrated liquidity within the Korean market.
-
Exchange Monopoly: The Korean cryptocurrency market is highly monopolized, with UPbit currently holding 70%-80% of the market share, firmly establishing itself as the industry leader. After UPbit took the top position in 2021, Bithumb’s former leading share dropped to 15%-20%. This concentration of trading volume and liquidity toward top platforms showcases a strong capital aggregation effect.
Thus, even if a token is not newly listed on the global market, its trading on the Korean market can still produce a “first listing” effect, driving significant market attention and capital inflow.
High Crypto Holding Rate and Capital Advantage in Korea
-
High Crypto Penetration: Korean investors have an exceptionally high rate of cryptocurrency ownership, far exceeding other major markets. As of November 2024, over 15.59 million people hold cryptocurrencies on Korean exchanges, accounting for more than 30% of the total population. Many Koreans already hold substantial crypto assets and prefer digital assets as an investment option. With just 0.6% of the global population, Korea contributes 30% of global cryptocurrency trading volume.
-
Abundant Social Capital: As a developed country with a high GDP, Korea has ample social capital and large investable funds, providing the cryptocurrency market with sufficient liquidity.
-
Limited Opportunities for Youth in Traditional Sectors: Korea’s economy is dominated by conglomerates, and young people face significant employment and living pressures, with social mobility being restricted. This heightens the demand for wealth-building opportunities. Approximately 3.08 million people aged 20-39 participate in virtual currency trading, representing 23% of that age group.
As of November 2024, the total cryptocurrency holdings by the Korean public have increased to 102.6 trillion KRW (approximately $69.768 billion), with daily trading volume climbing to 14.9 trillion KRW (approximately $10.132 billion). UPbit became the fastest-growing centralized exchange (CEX) in trading volume in Q4 2024, rising from $135.5 billion to $561.9 billion, a quarter-over-quarter growth of 314.8%. This growth reflects the strong demand for crypto assets in the Korean market and further validates the high trading volume trend of non-initial listings on Korean exchanges.
4. Price Performance Analysis
4.1 Price Performance Comparison by Exchange
4.1.1 Overall Price Performance of Listed Tokens on Each Exchange

-
Binance performs the best, with both average and median values standing out prominently. The top three exchanges in terms of average value are Binance, OKX, and Bitget, in that order. For OKX, although the average is positive, the median is negative, indicating that the price fluctuations of rising tokens are significant, with intense short-term volatility and noticeable outliers. Bitget’s performance is particularly notable, as it is the closest to the two leading exchanges among the others. Additionally, its median increase ranks second among all exchanges, just behind Binance, and shows a high positive value. This suggests that token prices on Bitget generally exhibit a strong, positive upward trend.
-
Among mid-tier exchanges, Bithumb, Gate, and KuCoin perform relatively well. Of these, Bithumb demonstrates the most balanced price performance, with the smallest difference between the absolute value and the median, indicating smaller price fluctuations and stable performance. However, for KuCoin and Gate, the median is negative, and the absolute value is high. This suggests a lower win rate for tokens and the possible presence of numerous upward outliers interfering with the data.

-
By the 30th day, the median price of tokens generally trends downward. This shows that after 30 days, especially for tokens with poor liquidity, speculative funds start pulling out in droves. Sell pressure ramps up, buy-side support weakens, and prices take a dive. Gate might be struggling here—listing too many tokens has sparked wild market swings and liquidity shortages. This suggests the platform isn’t pulling in enough stable capital. With so many token options splitting the liquidity pool, the balance between buyers and sellers collapses, driving prices sharply lower.
-
Binance, on the other hand, shrugs off the damage. Its average price only dips slightly, signaling that tokens listed there still enjoy solid market support and steady trading volume after 30 days—some even have room to climb. As a top-tier exchange, Binance leans on its massive liquidity and huge user base to keep token prices elevated, even when the broader new token market is bleeding.
-
Among mid-sized exchanges, Bithumb is the lone standout, posting gains after 30 days with positive 7-day returns and median prices. This highlights Bithumb’s ability to draw in capital thanks to strong liquidity and stability, showcasing impressive resilience and market appeal. It’s likely that Bithumb’s smaller listing volume lets it concentrate liquidity, keeping the market buzzing and allowing newly listed tokens to shine on the price front.
4.1.2 Price Performance of Monthly Listings on Each Exchange


-
Binance and UPbit listings exhibit a significant price advantage but are heavily influenced by market sentiment. Their listings perform exceptionally well during favorable market conditions; for instance, in May and September, Binance saw 30-day gains of 87.8% and 94.9%, respectively, while UPbit recorded a 60.5% gain in September, demonstrating a strong price advantage. However, they also show considerable volatility, experiencing significant drops in April and July, indicating that market sentiment has a notable impact.
-
The overall market trend significantly affects token performance. Listings on top-tier exchanges see larger gains during bull markets, while mid-tier exchanges are more susceptible to substantial drops during market downturns. For example, Bybit and OKX experienced 30-day declines of -40.6% and -36.6% in July, respectively. Kraken and KuCoin also showed weaker performance after 7 days, with Kraken recording declines of -23.5% and -27.9% in January and March, respectively.
4.2 Volatility of Price Movements
In the previous section, we used the average to reflect the overall level of price changes. Now, we will use the coefficient of variation to illustrate how the sample data fluctuates around this average. If the coefficient of variation is small, it indicates that the data is concentrated, with most tokens' price changes close to the average, suggesting a stable market where price fluctuations after listing on the exchange are more predictable. Conversely, a larger coefficient of variation implies greater uncertainty in the price trends after listing.
Next, we will analyze the prices for the 1-day and 30-day periods separately.

-
Binance has the lowest Coefficient of Variation (CV), indicating that the price fluctuations of its newly listed tokens on the first day are relatively small, showcasing the most stable market performance. UPbit has the highest CV, with larger first-day fluctuations, but when combined with previous average value analysis, it is estimated that its market overall likely shows a general upward trend.
-
For mid-sized exchanges (from left to right along the coordinate axis), the CV shows a linear increasing trend, from Bitget with the lowest CV to Gate with the highest. This indicates that the market performance of these exchanges' listed tokens transitions from relatively stable to higher uncertainty, with short-term investment risk gradually increasing.
-
Bybit has a lower CV, closest to Binance, indicating that its market volatility is also relatively controlled. Despite listing a higher number of tokens, Bybit still maintains a low CV, suggesting that the overall quality of its listed projects is high, without large-scale highly volatile tokens. Additionally, this reflects that Bybit's listing strategy may lean towards more stable tokens, thereby reducing sharp short-term market fluctuations.

-
From the perspective of Day 30 coefficient of variation, UPbit still maintains a high coefficient of variation after 7 days and 30 days, indicating that its trading pair price fluctuates significantly and the market liquidity is high. Combined with the average value, the average value of UPbit trading pairs is positive, and the price drops slowly, which indicates that the market buying and selling orders are relatively active, the liquidity depth is strong enough, and the overall market is healthy. From the perspective of the coefficient of variation, UPbit has a greater advantage than other exchanges in this regard.
-
Binance and Coinbase are still relatively stable exchanges. Binance has a relatively stable increase throughout the cycle, while Coinbases fluctuations between 7 and 30 days tend to be stable, indicating that its token market is more inclined to long-term stable development rather than short-term drastic fluctuations.
-
The coefficient of variation of medium-sized exchanges (such as Bitget, Bithumb, Gate, and KuCoin) increased significantly on the 30th day, indicating that after the withdrawal of short-term arbitrage funds, liquidity decreased, resulting in increased price fluctuations. The market is still dominated by short-term funds, with a low proportion of long-term funds and weak overall stability. Bitget, in particular, has high activity but high volatility risk.
5. Summary of highlights
5.1 Data Conclusion
After the above research and data, we draw the following conclusions:
-
The choice of exchanges to list coins has a significant impact on the performance of listed coins
Generally speaking, exchanges with fewer listed coins and stricter standards usually have better price performance after removing extreme outliers. However, the overall Bitcoin trend, regional market environment and user characteristics will also affect the performance of listed coins.
Exchanges with a large number of listed coins will indeed stand out in the short-term average performance, but in the long run, a large number of listed coins will cause liquidity to be more dispersed, and may usher in a larger decline after 30 days, and the price stability will be lower.
-
When the market is good, top exchanges often have a greater growth advantage than medium-sized exchanges
However, from another indicator, the average increase, the top exchanges have different increases in 7 days and 30 days, but the overall increase is positive. Binance has the best feedback in various price indicators. OKX has large fluctuations in the medium and long term. Among the top exchanges, UPbit has the most moderate performance, which may be due to the large liquidity depth. At the same time, UPbit can actually achieve extremely high increases and decreases on the first day of the token launch. However, since this study counts the final closing price on the first day, these outstanding performances may not be recorded. Among the medium-sized exchanges, Bitget and Bithumb performed relatively well. Among them, Bitget performed stably, and Bithumb performed well in some price indicators.
-
Advantages of the Korean market and the effect of listing
The Korean market has a unique market environment, with high trading volume and good liquidity. Tokens can quickly attract funds after listing. Although the price fluctuated greatly in the early stage, it showed an overall upward trend. And the price fluctuations were still violent after 7 days and 30 days. This shows that in the Korean market, tokens listed online will have a longer development cycle and higher attention.
-
The impact of exchange screening processes on token performance and market stability
During the data processing, we found that some exchanges had significantly more outliers, indicating that the token screening and review process is critical to post-listing performance. Outliers usually reflect that the token price deviates from expectations and may be affected by factors such as market manipulation or project risk. Exchanges that frequently have outliers may be more lax in the screening process, resulting in unstable tokens entering the market and increasing the risk of price fluctuations. Therefore, the token screening process of the exchange directly affects the market performance of the token and the overall market stability.
5.2 Exchange Performance
-
Binance OKX
Both perform well in various indicators, but in the long run, Binance has an advantage in stability. Binances market performance is relatively stable, able to maintain continuous growth, and has low volatility. In contrast, although OKX has greater market volatility than Binance, it is almost equivalent to Binance in multiple indicators.
-
UPbit Bithumb
UPbit and Bithumb are the two leading cryptocurrency exchanges in South Korea, and their performance is generally outstanding. UPbit has always maintained a high ranking among global exchanges. As one of the earliest exchanges established in South Korea, Bithumb has performed very well on some tokens. The extremely high enthusiasm for cryptocurrency speculation in the Korean market has led to a large amount of capital pouring into local exchanges, bringing higher liquidity and trading volume. Due to the high liquidity depth and the large number of funds dispersed among Korean retail investors, price changes will not be too obvious on a medium- to long-term scale. However, focusing on shorter-term intra-hour transactions, the trading volume and price fluctuations of Korean exchanges are both higher than those of other exchanges at the same level. Since this study mainly studies the price changes of tokens 1 day, 7 days, and 30 days after listing, it may not fully reflect the outstanding performance of Korean exchanges.
It is worth noting that UPbit and Bithumb have obvious regional advantages of Kimchi Premium. After certain tokens are listed on Korean exchanges, their prices are usually higher than other exchanges in the world by a certain percentage in the short term, which brings UPbit and Bithumb unmatched advantages over other exchanges in the world.
-
Bybit
As one of the top exchanges, it has strong liquidity depth and rich experience in listing coins, and can provide a stable trading environment. Although Bybit experienced a large-scale theft of coins in early 2025, it demonstrated its ability to cope with it as a large exchange with its timely and effective public relations and security measures. In contrast, many small exchanges often lack the ability to cope with such challenges. Bybits response strategies in risk control and public relations are also very appropriate, especially in terms of sufficient financial funds, which quickly restored the trust of users and continued to maintain its competitiveness in the market.
-
Bitget
It performs particularly well among medium-sized exchanges and develops at a faster pace. Bitget is in the transition stage towards first-tier exchanges and tends to implement a more stringent listing mechanism. The platform has launched a large number of new coins, providing investors with a wider range of choices. At the same time, according to the average data, the overall performance of the listed tokens is good, and the positive price fluctuations of the currencies far exceed those of the same level platforms. The preference of high-quality projects for Bitget is gradually emerging. The platform remains prudent in project screening and achieves a more accurate selection of the best through a two-way incentive mechanism. Overall, Bitgets market performance is between the average levels of top exchanges and medium-sized exchanges. It shows good price performance and market recognition. Compared with exchanges of the same level, the price fluctuations of tokens on Bitget are relatively stable, and they show a high degree of resilience when the market fluctuates, thus maintaining strong market competitiveness and user trust.
-
Gate
It is rising rapidly. With its high proportion of listed coins and its innovative listing strategy, Gates data performance in 2024 is relatively outstanding. Not only has the trading volume gradually increased, but the token price has also increased significantly. Gate has successfully attracted a large number of emerging projects, significantly improved its market competitiveness, and continuously expanded its influence in the crypto market. Gate has performed outstandingly in the Meme track, and has also set up an innovation zone to provide exclusive sections for newly launched tokens. With keen market insight, it has successfully launched a number of popular tokens, attracting a large number of investors. Its innovative listing strategy and precise project screening have helped the platform quickly expand its ecology, improved user stickiness, and promoted the growth of trading volume and liquidity.
-
KuCoin
In addition to the listing of coins that are the focus of this report, KuCoin has made significant progress in compliance. KuCoin has reached a settlement with the U.S. Department of Justice (DOJ), which paves the way for the future development of KuCoin and its new leadership team. KuCoin is also actively acquiring relevant licenses, especially in Australia and India, and is also actively deploying in Europe, Turkey and other places. KuCoin applied for a license in Austria that complies with the Markets in Crypto Assets Regulation (MiCAR) through KuCoin EU Exchange GmbH. At the same time, KuCoin is also the first global cryptocurrency trading platform in India that complies with the regulations of the Financial Intelligence Unit (FIU). By promoting compliance and regional expansion, KuCoin is expected to attract more potential users, promote trading volume and price growth, and create favorable conditions for its continued growth in the future.
-
Coinbase Kraken
As the largest exchange in the United States, it has strong liquidity and a deep market. Coinbases cautious listing strategy coupled with the United States strict cryptocurrency regulatory policy has resulted in a relatively small number of listings on the platform, but it also has high security and stability. This shows that Coinbase has adopted a conservative listing strategy for new projects, especially high-risk assets such as Meme coins. However, from the perspective of price performance, while choosing to pursue stable and long-term development, it has also missed many opportunities for growth. Kraken is well-known for its security and is subject to strict regulation, resulting in fewer products and services than other exchanges.
References
Animoca Brands Research on 2024 Listing Report
Low Float High FDV: How Did We Get Here?
CoinGecko 2024 Annual Crypto Industry Report
국내코인거래소총투자자1 천 500 만명첫돌파… 11 월60 만명↑
https://www.yna.co.kr/view/ AKR 20241224079900002