

This article will take you through a handful of basic technical analysis tools and how NFT traders use them to make a profit.
Article Outline
-
Technical Analysis in the World of NFTs
-
Momentum Trading
-
Scalping
-
Closing Remarks
Technical Analysis in the World of NFTs
NFTs are notoriously known for being an illiquid asset, meaning the risk of being unable to sell back an NFT is high, as is the risk of its floor price not being directly indicative of its value.
However, not all collections are equally as risky, with some collections seeing big surges in volume and strong demand. And where there is money spent, there is a profit to be made.
Technical Analysis (“TA”) can help traders determine the direction in which a collection is trending (i.e. upwards or downwards). It can also help identify regions of value, such as support and resistance levels. Thus, TA can be a great tool for traders to decide on entry and exit points for their trades.
Sales vs. Listings (Momentum Trading)
Momentum trading is a strategy traders use to (1) spot collections in which upwards momentum in price is commencing and picking up steam, (2) entering the trade, and finally (3) exiting at its peak before prices begin retracing downwards. Briefly put, “buying low, and selling high.”
Origins will soon be releasing its own trading platform that will allow for both basic and sophisticated TA, but in the meantime, one of the currently available tools for spotting momentum trading is NFTNerds, used below as an example into the various charts to look at and variables to consider.
1/ Spotting Momentum

The best way to spot momentum picking up is by comparing the number of NFTs being listed to the ones being sold. The above image shows just that, with listed NFTs colored in red (old listings that have relisted at a lower price) and green (new listings), and sold NFTs in purple.
If the number of NFTs selling per minute is higher than the number of NFTs being listed, then momentum is picking up and trending upwards. As sales per minute begin to slow down and listings pick up, however, we know that momentum has begun shifting downwards. It is important to consider selling here.
2/ What Prices are NFTs Being Listed at?
It is also important to consider other factors when momentum trading. For example, what price are NFTs being listed at? If NFT listings begin to pick up and surpass sales, but most listings are much higher than the current floor price, then it is not something to worry about as they will not form resistance lines/walls on the current price action.
Listing Walls
Another factor that can halt momentum are listing walls. As walls around a certain price point begin to build, breaking through them begins to prove difficult. When entering a trade, it is important to locate where walls have already formed and where they might currently be forming, as listing walls often lead to retracement in floor prices.
The opposite can also be true. If a project has begun seeing an uptick in volume and has a very “thin floor” - i.e., not many listings in the way - to a meaningfully profitable exit point, then it can often be easy to flip that NFT and exit at that price.

The picture above shows a wall being built around the 2 ETH price point (on the left), along with listings increasing over time around the mentioned price (on the right). This indicates that the listing wall is getting stronger, and thus retracement around 2 ETH is likely.
Support vs. Resistance
Finding support and resistance areas can also be helpful in gauging where an NFT’s price might bounce back up or retrace from.

In the example above, the project kept bouncing off of the 0.1 ETH price point and then reached a 0.2 ETH price a couple of times before retracing back down. The same happened again an hour later, a great opportunity to 2x a trade just by using support and resistance areas.
Pairing this with the volume going into the collection (on the bottom of the chart) we can see the volume began rising before the initial climb, then started falling down slowly before the prices began to retrace, and then a sudden small uptick in volume as support was found around 0.1 ETH and prices bounced back up.
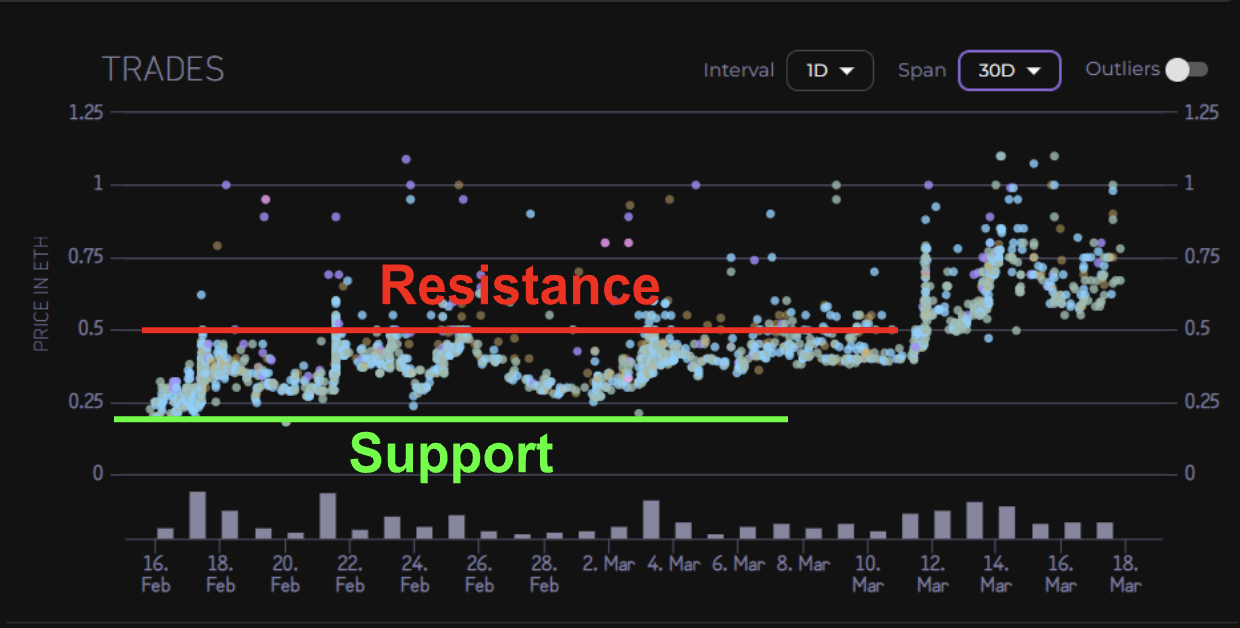
The same can be done with the chart above as a strong support area can be spotted at 0.25 ETH and a strong resistance area at 0.5 ETH. Recognizing this would have allowed traders several profitable entries and exits.
Finally, an important rule of thumb to keep in mind, as stated earlier: NFTs are an illiquid asset and just as volume can suddenly come in and prices can begin to surge upwards, it can also suddenly disappear (sometimes forever), leaving you holding illiquid bags. For this reason, it is important not to get caught up in greed — sell when you sense a top approaching. Holding onto an NFT for too long can be a very fast (and permanent) drop downwards.
Closing Remarks
TL;DR
Here are the summarized points made throughout this article:
-
Given the illiquid nature of NFTs, trading is difficult. However, it is still possible to recognize trends in the market and make profit where there is money to be made
-
Looking at the direction of momentum when entering a trade is important
-
If sales per minute are outpacing the number of listings, momentum is picking up, and prices can be expected to follow and trend upwards
-
If sales per minute are slowing down while listings are picking up, momentum is slowing down, and a trend reversal in prices can be expected If new listings are well above the current floor price, then they likely will not impact momentum
-
If an upcoming listing wall is bigger than current buying pressure, momentum is likely to slow down, providing a good exit point
-
If an NFT’s price point approaches a historical support area and volume begins to pick up, it is probably a sign of a good entry
-
If an NFT’s price nears a historical area of resistance and is met with decreasing volume, the price will likely retrace
At OriginsNFT we leverage data-driven decision making, educational resources, and proprietary analytics to remain ahead of the curve with respect to blockchain tech and specifically NFTs. To find out more, please visit our website or Twitter.
To purchase a pass, please visit our Opensea page.
