
Hero Image by Panos Matsinopoulos on Zora
The Table
I have a table named daily_stats, which keeps track of some daily metrics. Here it is:

The structure of the table:
-- CREATE TABLE "daily_stats" ----------------------------------
CREATE TABLE "public"."daily_stats" (
  "id" BigInt DEFAULT nextval('daily_stats_id_seq'::regclass) NOT NULL,
  "metric" Character Varying NOT NULL,
  "date" Date NOT NULL,
  "count" BigInt DEFAULT 0 NOT NULL,
  "lock_version" BigInt DEFAULT 0 NOT NULL,
  "created_at" Timestamp( 6 ) Without Time Zone NOT NULL,
  "updated_at" Timestamp( 6 ) Without Time Zone NOT NULL,
  PRIMARY KEY ( "id" ) );
 ;
-- -------------------------------------------------------------

-- CREATE INDEX "daily_stats_metric_date_uidx" -----------------
CREATE UNIQUE INDEX "daily_stats_metric_date_uidx" ON "public"."daily_stats" USING btree( "metric" Asc NULLS Last, "date" Asc NULLS Last );
-- -------------------------------------------------------------
I have 3 columns, mainly:
-
metricwhich identifies the metric I keep counts for -
datewhich identifies the date I keep counts for -
countwhich is the actual count for the givenmetricanddate
And, as you can see from the CREATE INDEX… above, the (metric,date) pair has a unique index, which means that I can’t have the same metric for the same date more than once.
I will not tell you how I populate this table. It is out of scope of this blog post. But I will tell you how I built some useful queries on top of it.
Querying by a Date Range
I want to get a result set for a given date range, date_from .. date_to.
I can just simply do:
(assuming that date_from = ‘2025-04-29’ and date_to = ‘2025-05-03’)
select * from "daily_stats"
where date between '2025-04-29' and '2025-05-03'
order by date desc
That is good and easy!
But what if a metric doesn’t have a count entry for a given date within the range?
Is this a problem? Generally not, but if you want to send the results to the front-end to draw a line chart with the date series from the first date to the last, there will be gaps.
Querying by a Date Range - Filling in the Missing Dates With Count 0
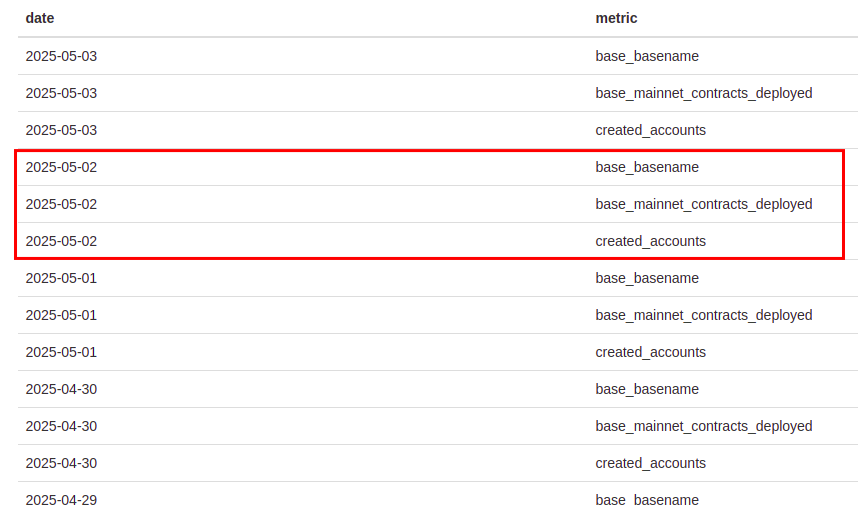
Look at the result set which the previous, simple query, might return:

How can I return 0 for that date for that metric?
Step 1 - Build a Result Set with All Dates Within Date Range
First, I need to build a set will all the dates within date range.
I want something like this:

This is quite easy in Postgres. The select I need is this:
 select generate_series(
    date '2025-04-25',
    date '2025-05-03',
    interval '1 day'
)::date as date
One could say: Let’s just do left join with the daily_stats on the date column. So, for each date that does not exist in daily_stats it will just give NULL which can be coalesce to 0. But this is not correct. Because we want a 0 entry for each metric that does not have counter for the particular date.
Step 2 - All Metrics
Lets first get all the metrics.
select distinct metric from daily_stats;
This returns something like this:

Step 3 - Dates and Metrics Combinations
Now, I want all the dates with all the metrics combinations.
The key here is cross join:
I will use the following select which also incorporates with i.e. the CTE in Postgres:
Want to read more about CTEs? Read this.
with all_dates as (
  select generate_series(
     date '2025-04-25',
     date '2025-05-03',
     interval '1 day'
   )::date as date
),

all_metrics as (
  select distinct metric from daily_stats
)

select * from all_dates
cross join all_metrics
order by all_dates.date desc, all_metrics.metric asc
;
When I run this, it gives me a result set like this:
Step 4 - Final: Left Join With Daily Stats
Now that I have all the combinations of dates and metrics, I can left join with the daily_stats and for the cases which I don’t have a count for, I will just display a 0.
with all_dates as (
  select generate_series(
     date '2025-04-25',
     date '2025-05-03',
     interval '1 day'
   )::date as date
),

all_metrics as (
  select distinct metric from daily_stats
),

all_dates_and_metrics as (
  select * from all_dates
  cross join all_metrics
)

select
  adm.date,
  adm.metric,
  coalesce(ds.count, 0) as count
from all_dates_and_metrics adm
left join daily_stats ds on ds.date = adm.date and ds.metric = adm.metric
order by adm.date desc, adm.metric asc
;
This returns the results with the missing dates filled with 0s:

Which allows me to draw nice line charts for all the metrics:

Getting Cumulative Counts
daily_stats#count gives me the count for a given metric for a given date.
What if I want to get the cumulative count. I.e. the accumulated count up until a date, still with a date range?
Step 1 - Cumulative Counts on Daily Stats
Getting the cumulative counts from the daily stats is easy:
select
  date,
  metric,
  sum(count) over (
    partition by metric
    order by date asc
    rows between unbounded preceding and current row
) as cumulative_count
from daily_stats
order by date desc, metric asc
We use the window function sum(count) over (…) The partition by metric would have been enough if I wanted sums by metric only. But here we want to partition our data by metric, but for each partition, to order them by date and sum all the counts up to the current row. This is what the window function does.
The above will return data like this:

Although accumulation works, the dates for which a metric does not have a count are missing.
Important: This result set, on the first date of the date range, i.e. on
2025-04-25, it has the correct accumulated values up until that date:

Can we just generate the date series and left join as we did with the previous case?
Not exactly, because we don’t want to fill in the missing rows with 0. For example, the base_basename case for 2025-05-02 should be 660,101 which is the value the metric had on the 2025-04-30, the latest date before the 2025-05-02 that it had its value accumulated.
Step 2 - Date Series + Dates Metrics Combinations + Cumulative + Left Join+ lateral
The solution is to use left join and lateral sub-query.
But, before we see the actual solution, let’s see what is NOT the solution:
Don’t do this. This is not the solution:
One might say: let’s use the window function on the result set of the previous case:
with all_dates as (
  select generate_series(
     date '2025-04-25',
     date '2025-05-03',
     interval '1 day'
   )::date as date
),

all_metrics as (
  select distinct metric from daily_stats
),

all_dates_and_metrics as (
  select * from all_dates
  cross join all_metrics
),

with_all_counts as (
  select
    adm.date,
    adm.metric,
    coalesce(ds.count, 0) as count
  from all_dates_and_metrics adm
  left join daily_stats ds on ds.date = adm.date and ds.metric = adm.metric
)

select
  date,
  metric,
  sum(count) over (
    partition by metric
    order by date asc
    rows between unbounded preceding and current row
  ) as cumulative_count
from with_all_counts
order by date desc, metric asc
;

This is not correct, because it accumulates from the first date of the range specified, i.e. the 2025-04-25 and not from the first date of the whole set in the daily_stats whichever this might be. In other words, the count of a metric for the 2025-04-25 is NOT accumulated value.
If you run this, you will see that the value for base_basename on 2025-04-25 is 460 which is not the accumulated value for this metric up to that date. This, of course, makes the whole result set being wrong, as it accumulates values on top of the value counted on 2025-04-25.

Hence, the accumulated values need to be calculated on the whole daily_stats and not limited to the date range I want the graph/chart for.
In other words, I first need to accumulate and then limit by date range.
The correct SQL is the following:
with all_dates as (
  select generate_series(
     date '2025-04-25',
     date '2025-05-03',
     interval '1 day'
   )::date as date
),

all_metrics as (
  select distinct metric from daily_stats
),

all_dates_and_metrics as (
  select * from all_dates
  cross join all_metrics
),

cumulative_counts as (
  select
    date,
    metric,
    sum(count) over (
      partition by metric
      order by date asc
      rows between unbounded preceding and current row
    ) as cumulative_count
  from daily_stats
)

select
  adm.date,
  adm.metric,
  coalesce(cc_top.cumulative_count::int, 0) as count
  from
    all_dates_and_metrics adm
  left join lateral (
    select
      cumulative_count
    from cumulative_counts cc
    where cc.metric = adm.metric and cc.date <= adm.date
    order by
      cc.date desc limit 1
  ) cc_top on true

order by date desc, metric asc
;

As you can see above, the accumulation takes place on the whole daily_stats set, and then we join.
But we don’t just do left join because this would have given us 0 instead of accumulated values. We use left join and lateral subquery. Read about the lateral here.
The sub-query:
select
  cumulative_count
from cumulative_counts cc
where cc.metric = adm.metric and cc.date <= adm.date
order by cc.date desc limit 1
is using a reference to the date and metric columns of the preceding from item, i.e. of the from all_dates_and_metrics adm. This is possible thanks to lateral.
So, we left join the all_dates_and_metrics with the result of the sub-query. The result of the sub-query is always a single row (thanks to limit 1) and it is the latest row we have accumulation value for the metric and date at hand. Note that the join is unconditional thanks to the on true.
Here is the result set (first and last parts shown only) returned by this query:


It looks that it works! 🎉
gm! I am Panos Matsinopoulos, humble software reader, writer, classical music and V8 engine lover. I work for Talent Protocol, where we make builders get the recognition they deserve.