Where’s Bitcoin Going after Yesterday’s pump? The On-Chain Stories #1
The bloody January (are we calling it that now?) had reduced our bitcoin portfolios by over 45% in just a month. However, the market bounced back yesterday, and bitcoin went back up by over 12% in a single day. These are the most significant gains in bitcoin we’ve seen in the new year or maybe since the last all-time high (don’t tell me that was it! Wait, was it?).
Actually, the point of this article is something else. Will bitcoin be able to go higher, or is this just a rebound of the crash we saw the entire month? Let’s try and find out:
Check out my Twitter for frequent updates!

Technical Indicators
Bitcoin sure did bounce off after closing three months in red (goddammit, zoom out, guys). But the funniest part here is people don’t tend to zoom out to see the obvious; everyone was justifying something or the other, nobody even tried noticing the double top on the monthly chart that has been forming for months. Anyways, that did lead to a crash, but I think this might not just be it.
The left half is weekly, and the one on the right is a monthly chart, and the bottom is the MACD indicator ***(I know a classic). ***Now, the weekly MACD is forming a bottom, but on the other hand, the MACD indicator on the monthly timeframe is just getting started (bear market?).

From TradingView
In/Out of Money
As bitcoin went up and hit the $41,900 mark, things about the volume of addresses bought during this price range. It’ll be crucial to see if the market can maintain these price levels as there’s fragile support around the current market prices; however, the longer bitcoin stays here, the more vital support it’ll be creating for the future pull-backs. Bitcoin needs to get around the $46,500 range and maintain strong support to maintain its journey forward.
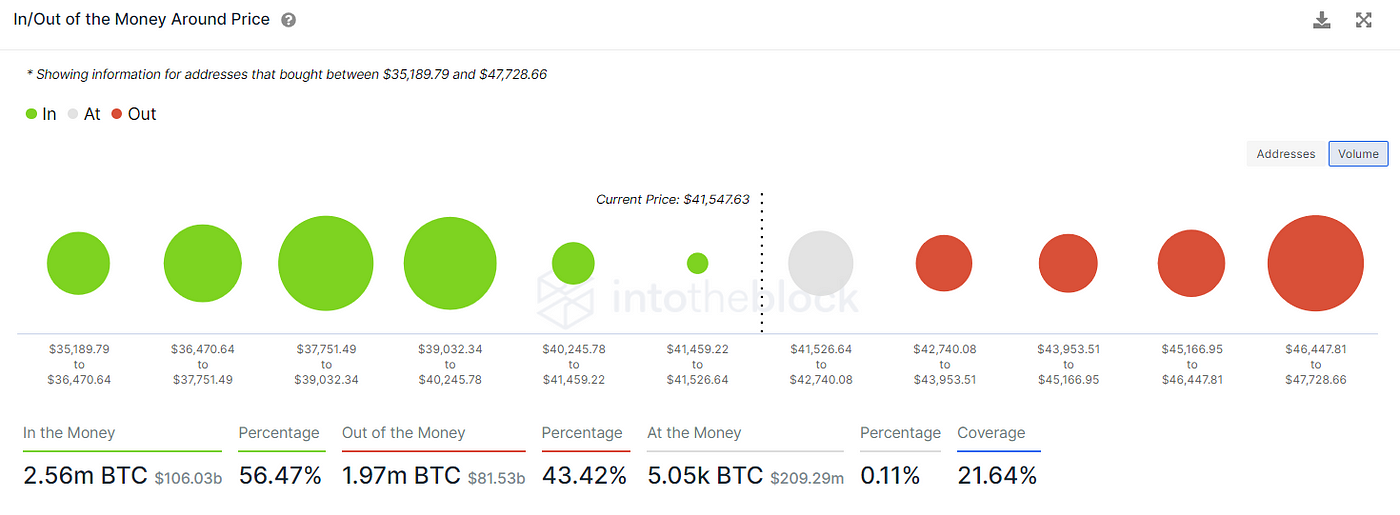
In/Out of Money by IntoTheBlock
The Bitcoin Hashrate
Back in May 2021, when China started the mining FUD and banned all crypto mining activities, Mainland China constituted over 50% of the total mining activities (don’t trust me, eh? have a look at the chart below by the University of Cambridge.) So this shift of the mining power from other countries felt like the best thing back then.
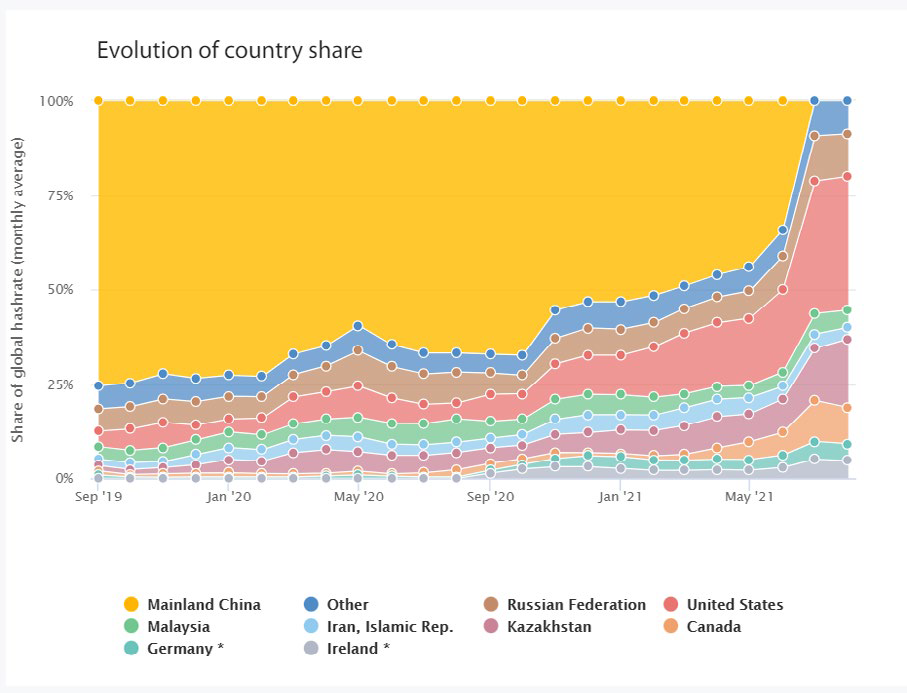
(Not Most Accurate) Data from the University of Cambridge
Anyways, the important part here is that the bitcoin mining hashrate is back to making new all-time highs, meaning miners are bringing in more machine power and making the bitcoin network stronger. However, many analysts argue that there’s no correlation between hash rate and bitcoin’s price; things look slightly different in a shorter timeframe.
If we zoom into the chart, then we can observe that price and hash rate can correlate, since on a shorter timeframe, if the hash-rate dips, the price dips as well. Though this is not always true, we can verify it through our most recent jump in price, where the bitcoin mining hash rate dipped significantly. (or can it mean that we’re soon going down further, and this was just a pull-back of good bloody months?)
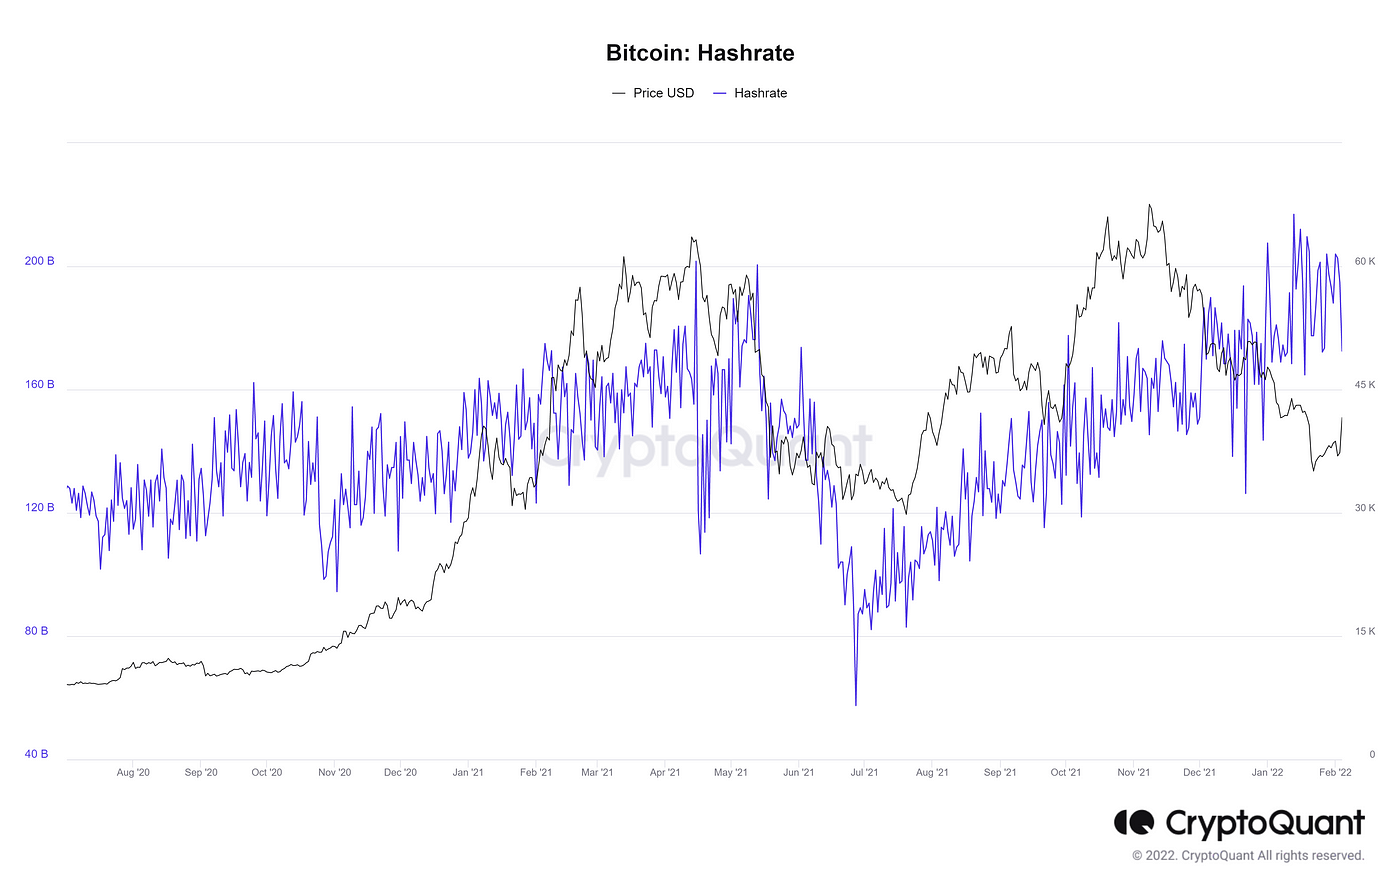
The Bitcoin Hashrate by CryptoQuant
Shorts Getting Liquidated
The number of shorts getting liquidated has been on the rise as well. Of course, people who go short bitcoin are retards, never wanting to see the entire picture (or if you’re one of them). Anyways, the highest number of short liquidations usually happen after a good crash; more usually, when the market starts to rebound. And personally, these levels might’ve been the worst place to go short, as bitcoin was on more robust support and had weak resistance on its way up. Plus, adding to that was the part that we hadn’t seen a single month closing green after the ATH or the double top.
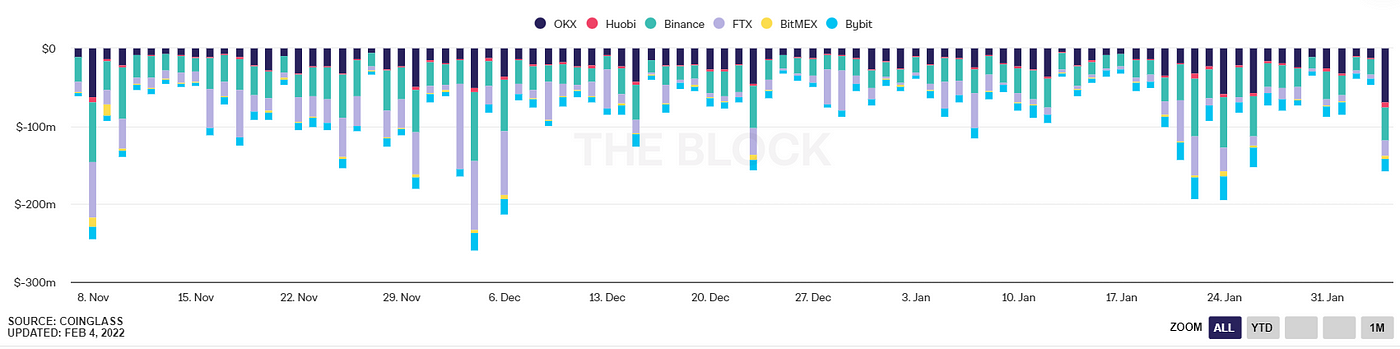
Shorts Getting Liquidated by The Block
Number of Active Addresses
The number of active addresses on the bitcoin network gives us an idea of the number of investors buying, selling, or simply moving their bitcoins (who knows why?). If we zoom into the chart, things look a bit interesting.
The local top on 12th December 2021 in the Number of Active addresses (#NAA) hit a local top. Not just this, the same thing happened on 1st January this year, and again around 24th. The exciting part here is all these little bumps came right after a crash. This might’ve most probably occurred when hodlers might’ve bought the dip during the crash and started moving their sats to private wallets.
However, the present NAA started moving up again, and this time, things might’ve been different. With bitcoin breaking out, investors might’ve started increasing their positions and going long, hoping they’d ride the new emerging rally.

Number of Active Addresses by The Block
What do I think is happening right now?
Well, I don’t think it matters, but anyways. The market presumably has a bounce-back after dipping for three months straight. So, it is highly possible that we can stay at these levels or even go higher to around the $45,000 levels by the end of the month. Moreover, going back up to $60K levels this fast kind of seems unlikely, especially after forming out the double top. So, trade with caution, as this can be one of the bitcoin bubbles we usually come across.
Again, Follow me on Twitter!
PS: Do your own research; I just write whatever sh*t I see. So this is not a piece of financial advice (and if you buy/ sell with any of this info, don’t sue me. Can you, though?). Also, never take a bit of financial advice from an idiot bleh bleh bleh…