
This is a post I quickly wrote with my thoughts. It is not structured and should be treated as a draft of a longer piece I have planned of putting out, but I just wanted to share some stuff now.
Disclaimer: The following statement does not represent Spartan's views. It is a personal thesis and post. I welcome discussions on any thoughts and greatly appreciate any feedback received.
I firmly believe Across will be the biggest winner (in terms of growth and share gains) of the bridge landscape in the 1-year horizon (predicting further than one year almost never works, so I´ll leave that to traders, gurus, and threadooors).
STRUCTURE:
-
Bridges are a growing vertical.
-
Bridge aggregators play and will continue to play a big role in the bridge landscape.
-
Across is the most advantageous bridge if aggregators grow and keep taking share from the market.
-
Quantitative analysis.
-
Multiples – Valuing cryptoassets on a relative basis.
-
Absolute valuation based on TAM growth and share gains.
If anyone wants to access the spreadsheet (where I´ll be putting more graphs and stuff) DM me on twitter. I have a paywall of $10 on it, but really think it´s worth it. The data updates daily thanks to Artemis and aggregates KPIs from all of the bridge landscape.
1. BRIDGES ARE A GROWING VERTICAL
Bridges are a growing vertical, which has grown volumes 4x since January 2023 (although primarily driven by Stargate´s L0 airdrop expectations),
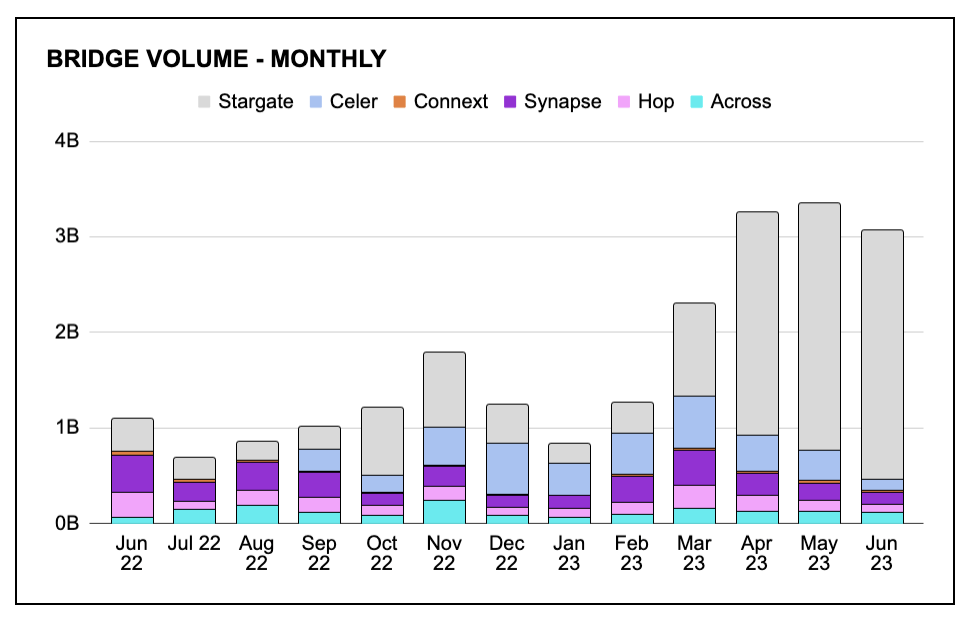
and there are many TAM expansions on the short-term horizon:
-
EIP-4844 (reduce L2 gas fees and may drive cost-sensitive users to L2s, for which they will need to bridge to existing L2s (Arbi and Op).
-
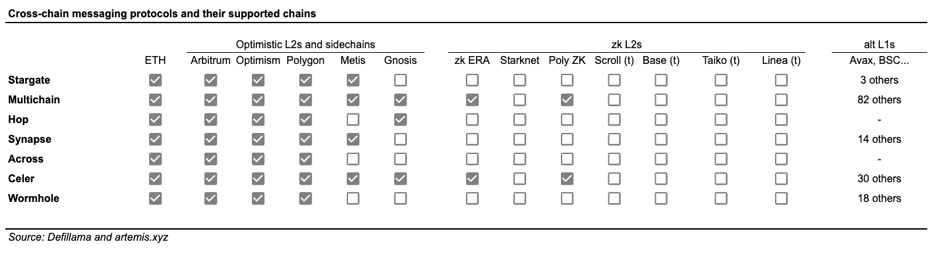
Many important L2s are expected to come in the following months: BASE, Taiko, Linea, Scroll, Mantle. All of which need bridge support.
I expect bridge volumes to grow 50% y/y since the L365D. Again, growth comes from 1) existing chain bridge transfers, 2) new ecosystems.
2. BRIDGE AGGREGATORS PLAY AND WILL CONTINUE TO PLAY A BIG ROLE IN THE BRIDGE LANDSCAPE
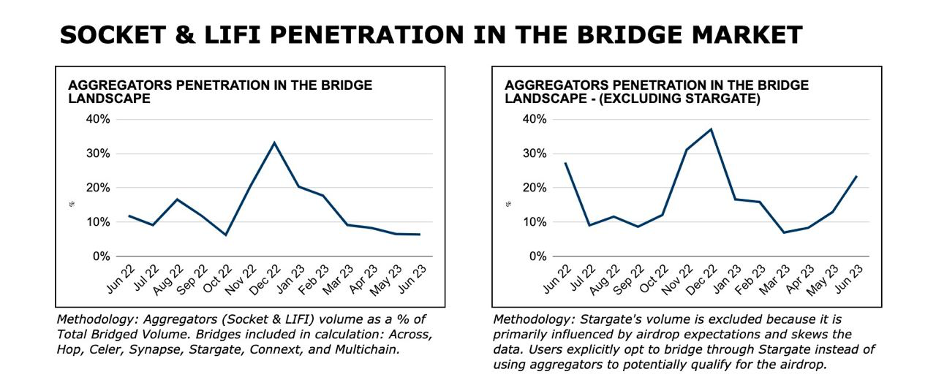
The most important metric in the bridge landscape that is not being tracked is aggregator penetration: what % of the total bridge volume gets rooted through aggregators.
The market is dormant, and aggregators change the dynamics. Users who were “loyal” or accustomed to using incumbent bridges that weren´t fast and charged high fees, have now discovered a new bridging experience, which is more cost-effective and “democratic”.
For more info on why bridge aggregation makes sense, check this out:
Anyway, this ratio serves as a metric to gauge the “penetration” of aggregators, made with data from Across, Hop, Synapse, Stargate, Celer, Connext, and Multichain.
Two important things to say about these graphs:
-
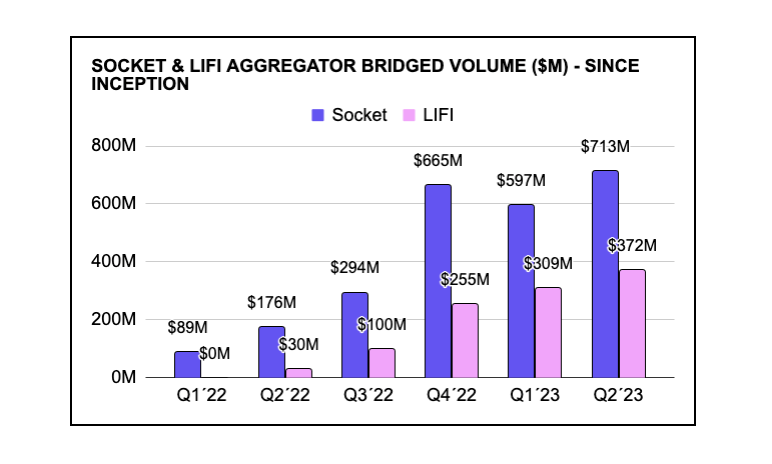
In December 2022, there was a notable spike in volume due to the launch of Jumper's V2 and a surge in Bungee's volumes. These protocols attracted significant bridging activity as users started to speculate about a retroactive airdrop of $LIFI and $SOCKET tokens. Currently, the remaining volume consists of organic transactions, which initially appears to have slowed down.
-
In order to provide clearer data, I have excluded Stargate's overall volume from the second graph. Stargate, being a widely used frontend and smart-contract platform, attracted most users for L0 airdrop activities after it achieved a $3B valuation in April 2023. In this graph, we can observe that market penetration has not slowed down; instead, it has increased from 7% to 24% over the past three months.
Having said that, I expect this penetration ratio to grow in the following year (to 40%). As aggregators improve their service offerings and bridge integrations, and as they develop their own network effects, it becomes logical for users to rely on aggregators for their bridging activities. This way, users can abstract the need to know which bridge supports specific chains or if it has sufficient liquidity, among other factors.
3. ACROSS IS THE MOST ADVANTAGEOUS BRIDGE IF AGGREGATORS GROW AND KEEP TAKING SHARE FROM THE MARKET
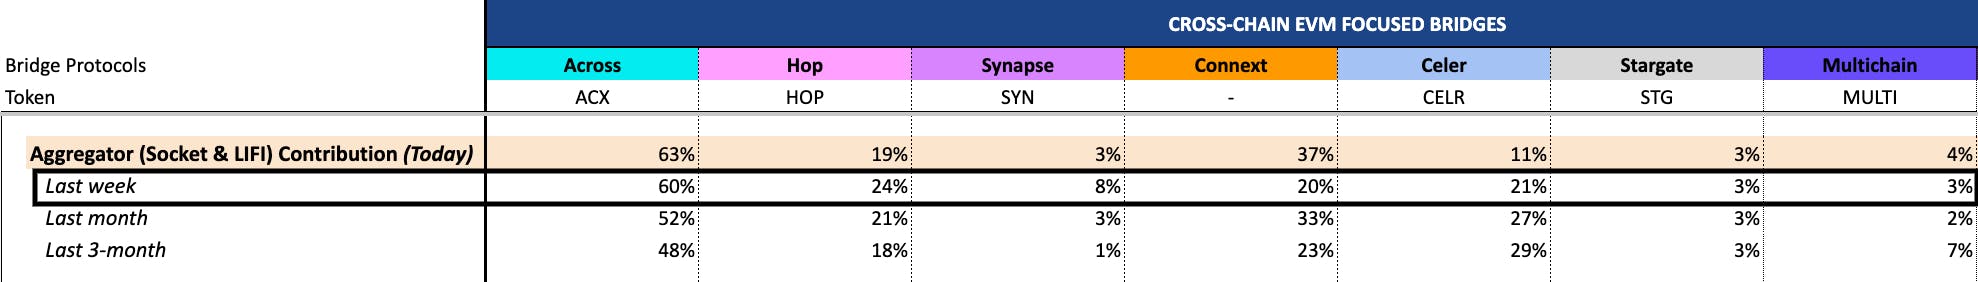
Across is the fastest and/or cheapest bridge, and as such, gets selected by users and aggregators as the preferred route for most of their transfers. If aggregators penetrate the market, Across wins, and I see that happening.
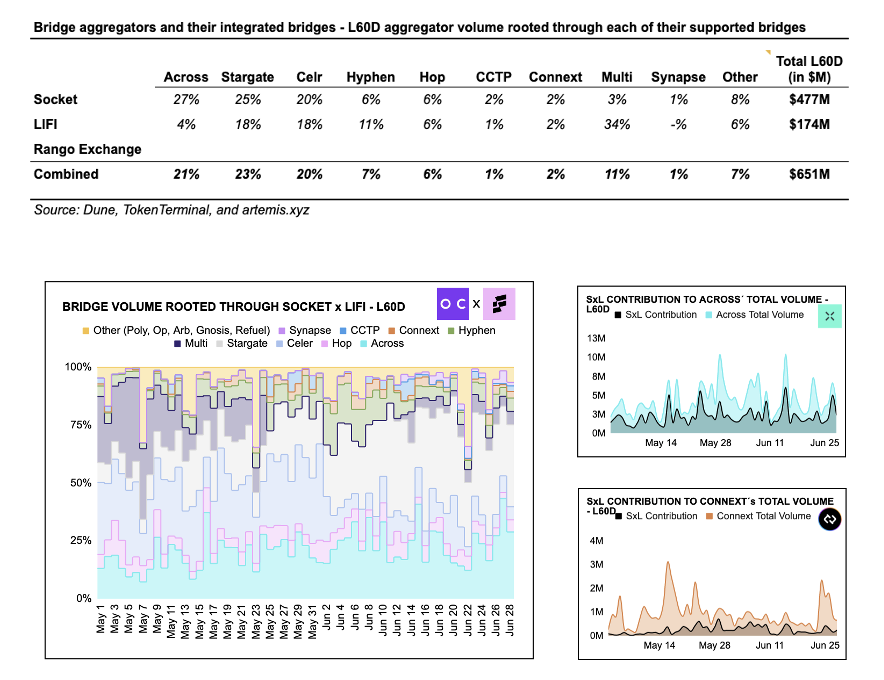
Based on the last week, 58% of Across´ volume comes from LIFI and Socket.
So, how can someone get exposure to this expected growth in Across? They have a governance token - $ACX, let’s check how has the token performed historically with the evolution of the underlying protocol KPIs.
4. QUANTITATIVE ANALYSIS
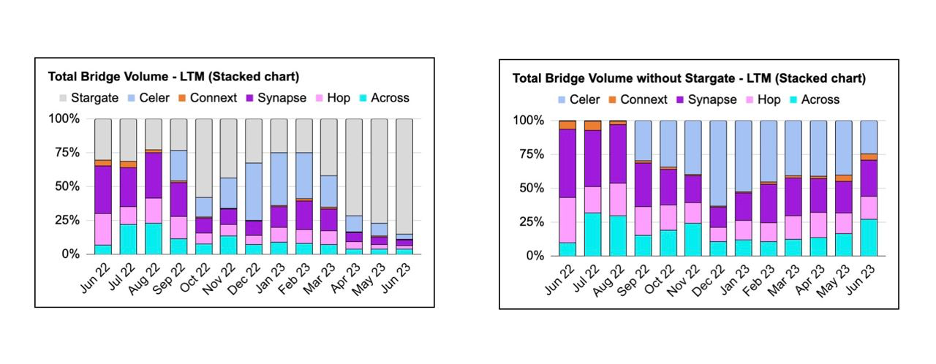
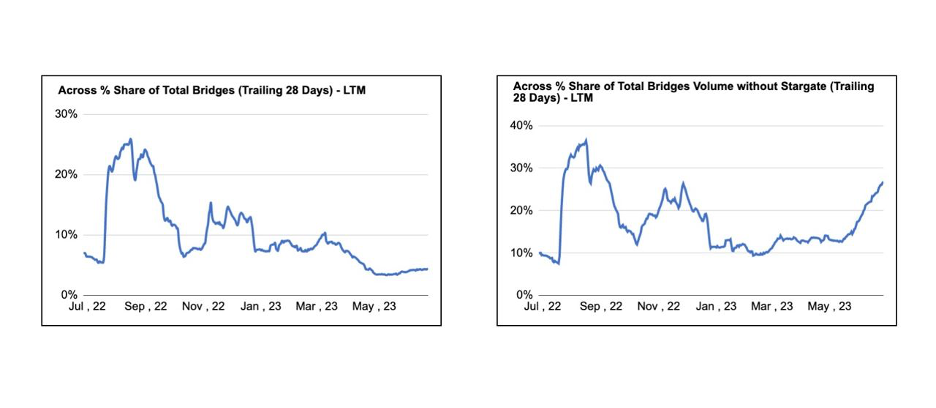
Before we delve into the details, let's examine a couple of graphs that highlight an interesting trend. Specifically, focusing on the pair of Across-Hop-Synapse-Connext-Celer, we can observe that Across has been the sole gainer since the beginning of the year.
5. MULTIPLES – VALUING CRYPTOASSETS ON A RELATIVE BASIS
When it comes to valuing cryptoassets, a relative valuation method can be employed. This approach involves determining the price of a target asset in relation to another crypto asset or a basket of assets that belong to the same vertical and exhibit similar characteristics.
Let's focus on bridge multiples as an example. Multiples can be applied to various key performance indicators (KPIs), but it is particularly meaningful to utilize them for sector-specific KPIs in the context of bridges. These include metrics such as total value locked (TVL), bridge volume, and revenue. For more detailed information, I recommend referring to another post I created on my Bridge Token Dashboard:
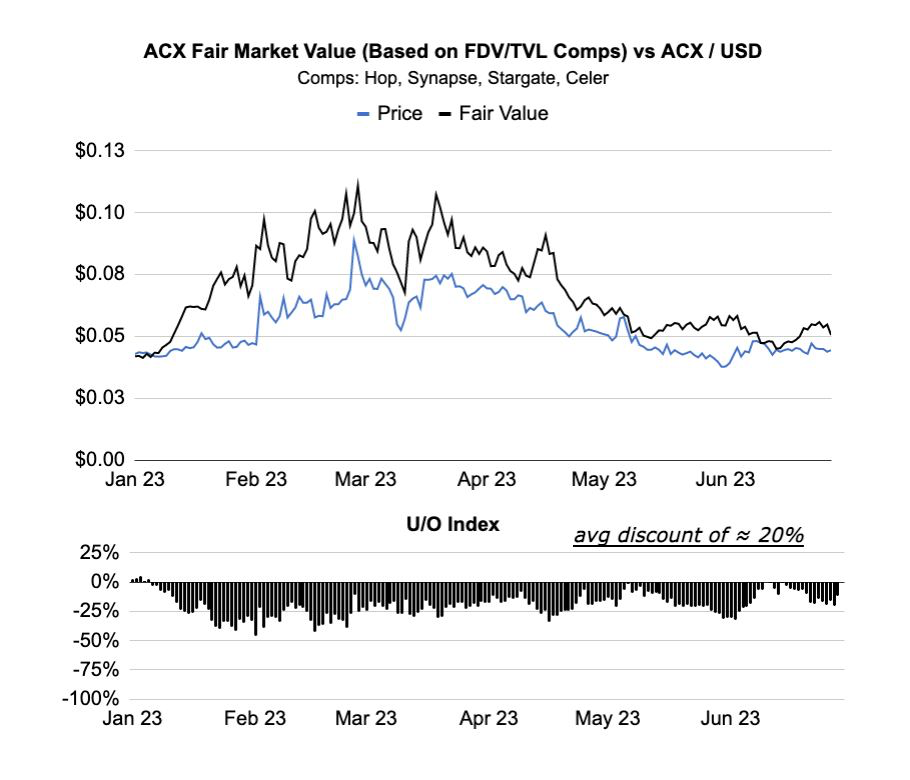
The price of ACX (in USD terms) has been tracking relatively close the evolution of the implied price from TVL comps multiple. The correlation is not perfect, but closely correlated, and it has had an average discount to fair value since January 1st, 2023, of 20%.
In my opinion, total value locked (TVL) serves as a lagging indicator for LP-based bridges, as well as for decentralized exchanges (DEXs). TVL tends to grow after the volume and fees have increased, as LPs primarily seek for yield.
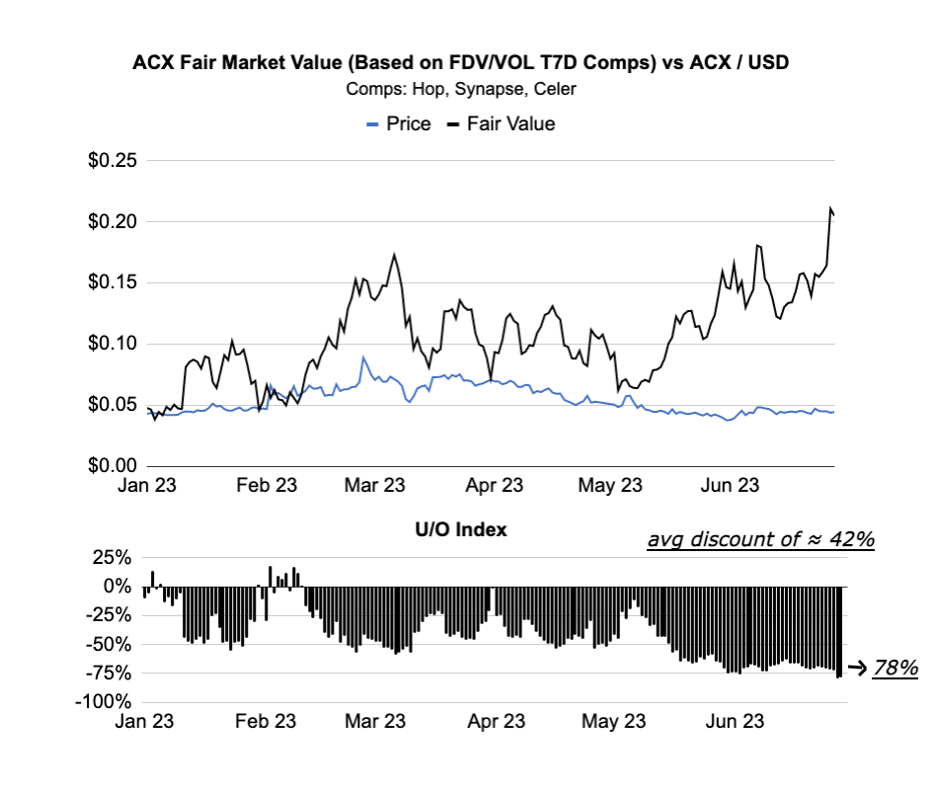
Let's now analyze the performance of the implied price derived from Volume and Fees comps relative to the market price of ACX.
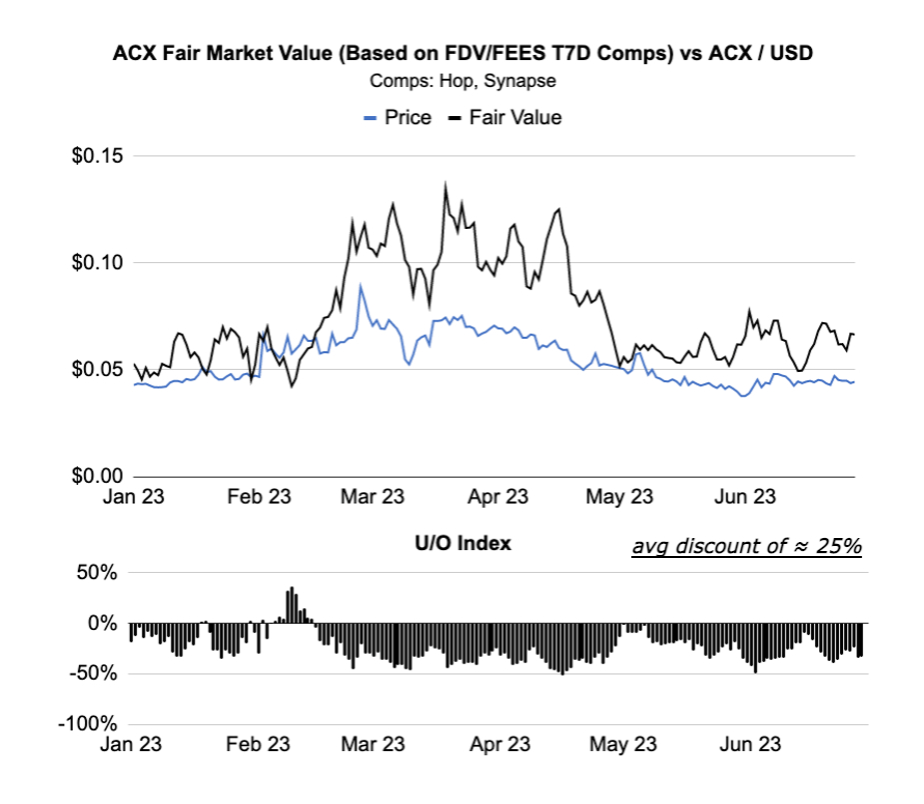
Although the results are not particularly revealing, the key insight here is that, despite my opinion that TVL shouldn't be the primary KPI metric for bridges, the market continues to price bridge tokens based on TVL. This is evident from the historical average discount to "fair value" based on comps, which stands at 20%.
The disparity between the implied prices derived from FDV/VOL and FDV/FEES multiples stems from the varying fee structures of each bridge. While Across has witnessed growth in volumes, leading to a higher "fair value" based on this metric, its fee growth has not been as significant.
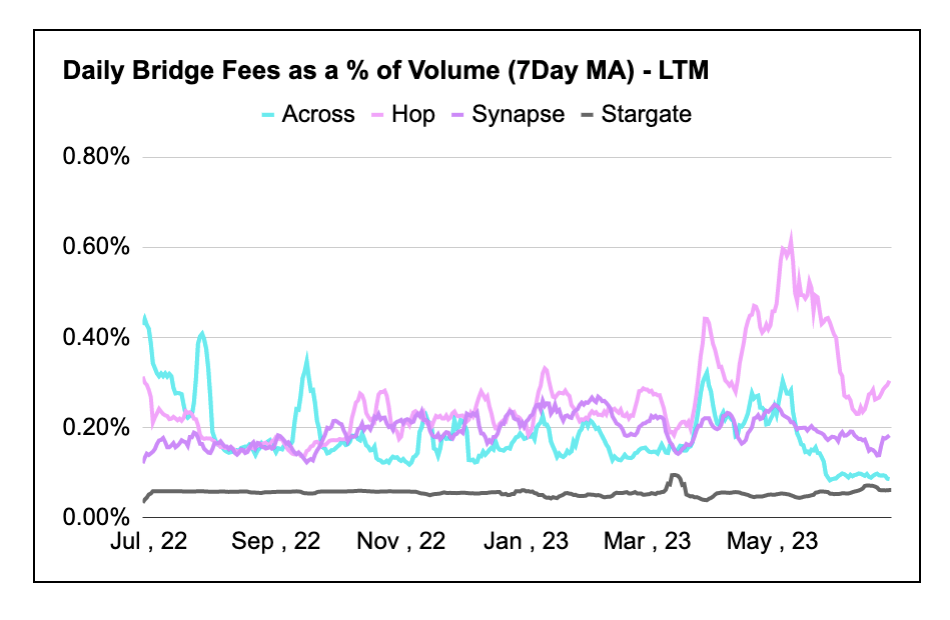
The reason for this can be found in the daily bridge fees as a percentage of volume, where Across ranks second lowest. Across's users pay relatively lower fees for each dollar bridged, and this trend is continuing, approaching the fee levels of Stargate (fee compression).
6. ABSOLUTE VALUATION BASED ON TAM GROWTH AND SHARE GAINS
This approach allows us to evaluate the prospects of ACX within the bridge landscape and assess its potential as a winner in terms of growth and share gains.
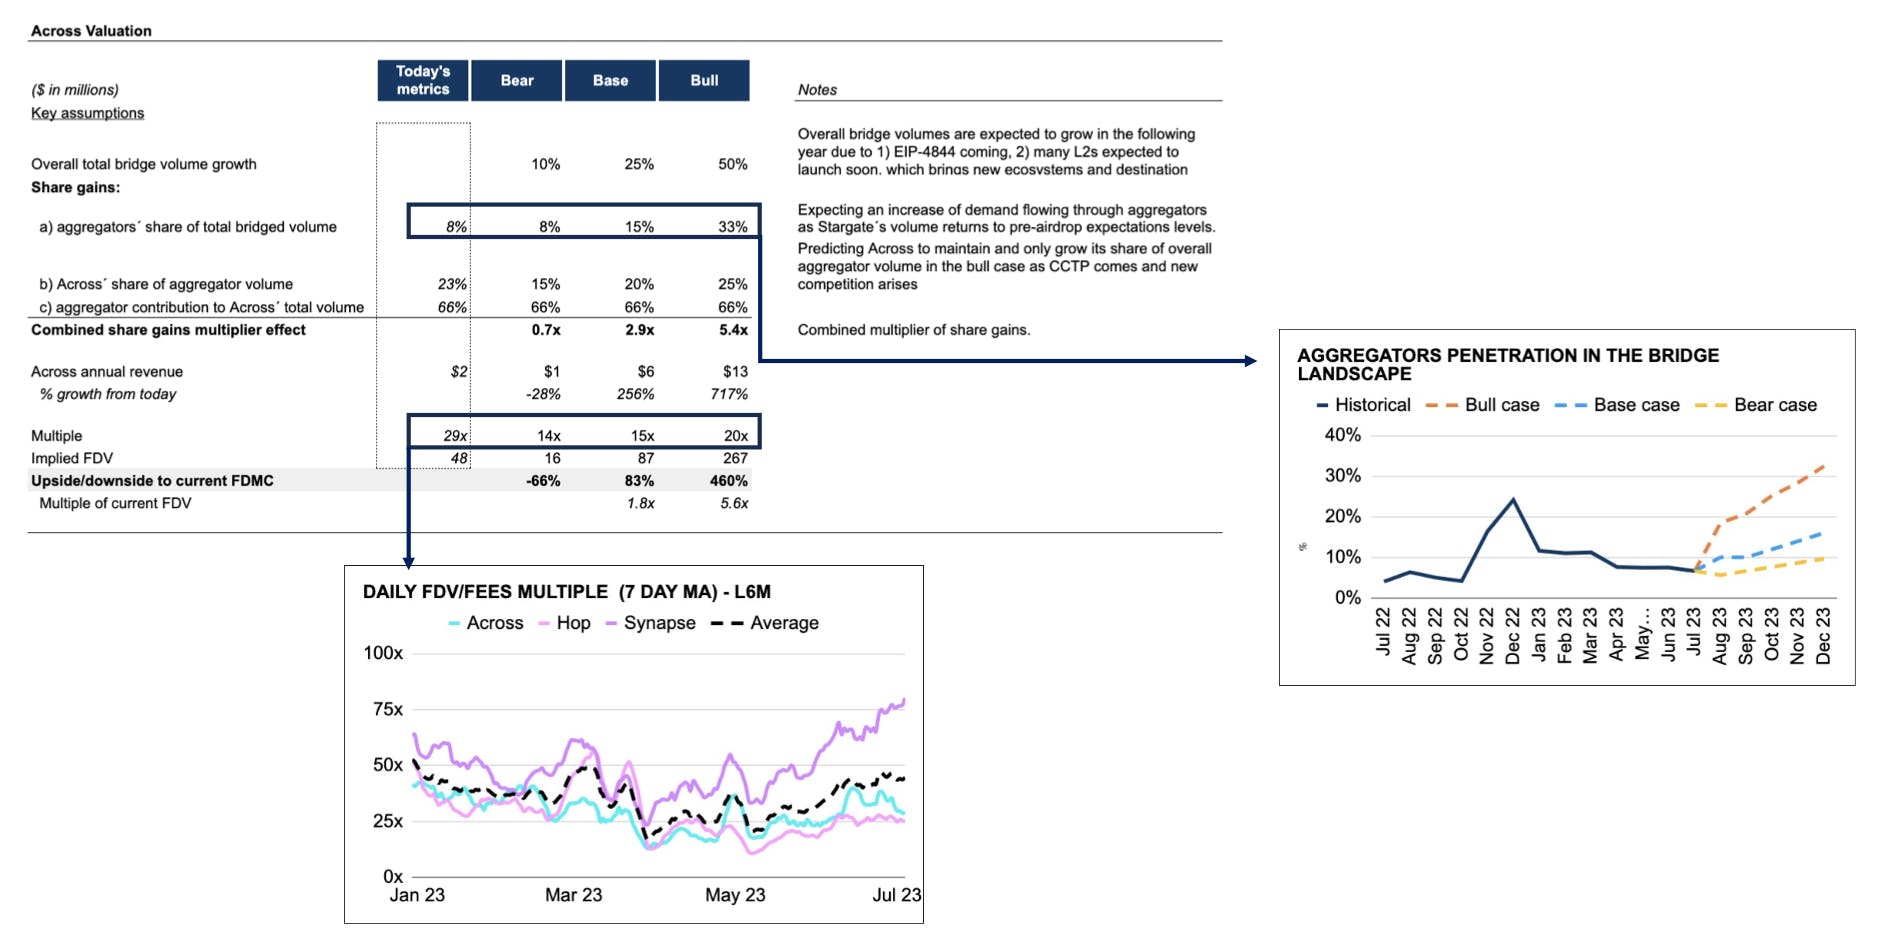
Based on @TheiaResearch and @samuelmandrew GMX valuation framework.