INTRODUCTION
This report presents an analysis and estimate of Coinbase's financial performance during Q1 2023. While most publicly traded companies report their financials quarterly, Coinbase's operations in blockchain-based activities provide a unique opportunity to estimate its revenue in real-time using an automated financial model. By combining on-chain transparent data with some reasonable assumptions, we can predict the company's quarterly results with a high degree of accuracy.
This report was inspired by @kunalgoel's “Spoiler Alert - Coinbase Q4 Revenue Estimates” Messari post. I adapted the SS while adding some additional assumptions to ensure that it updates automatically on a daily basis. Having said that, this report provides a walkthrough of the Coinbase Dashboard 🔵 and highlights the methodology and assumptions used to estimate its different revenue sources to arrive at the top-line revenue.
The historical financial information used in the model was mainly obtained from Coinbase's official website, and annual and quarterly reports, which also provided detailed insights into the company's sources of revenue. For blockchain-related information, I used the Artemis_xyz Google Sheet plugin (links at the end).
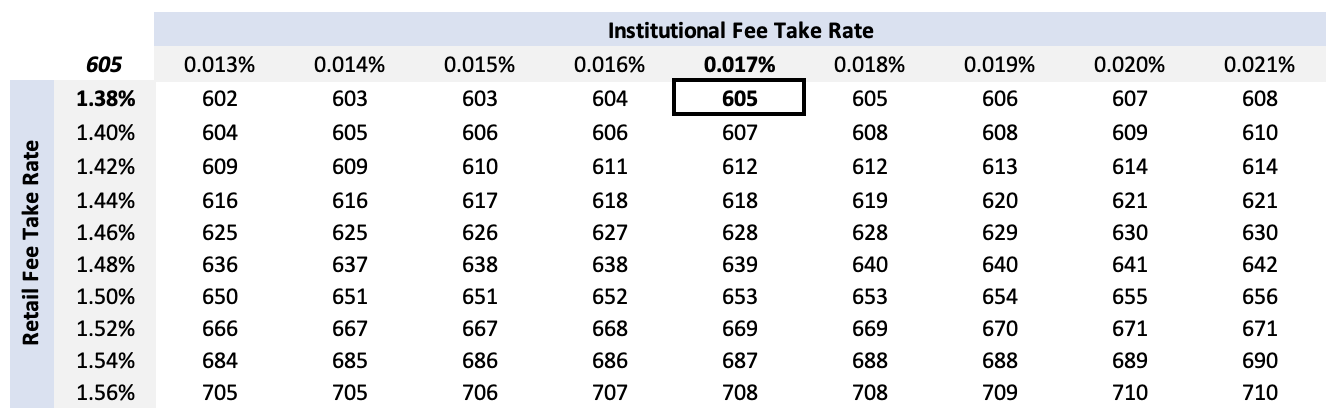
The model estimates Coinbase's Q1'23 top-line revenue to be $606 million, with the Fee Take Rate on Trading Volumes remaining the primary driver of overall revenue. A sensitivity table at the end of this report is included, which provides a range of estimates from $602 million to $710 million, reflecting the potential impact of different Fee Take Rates.
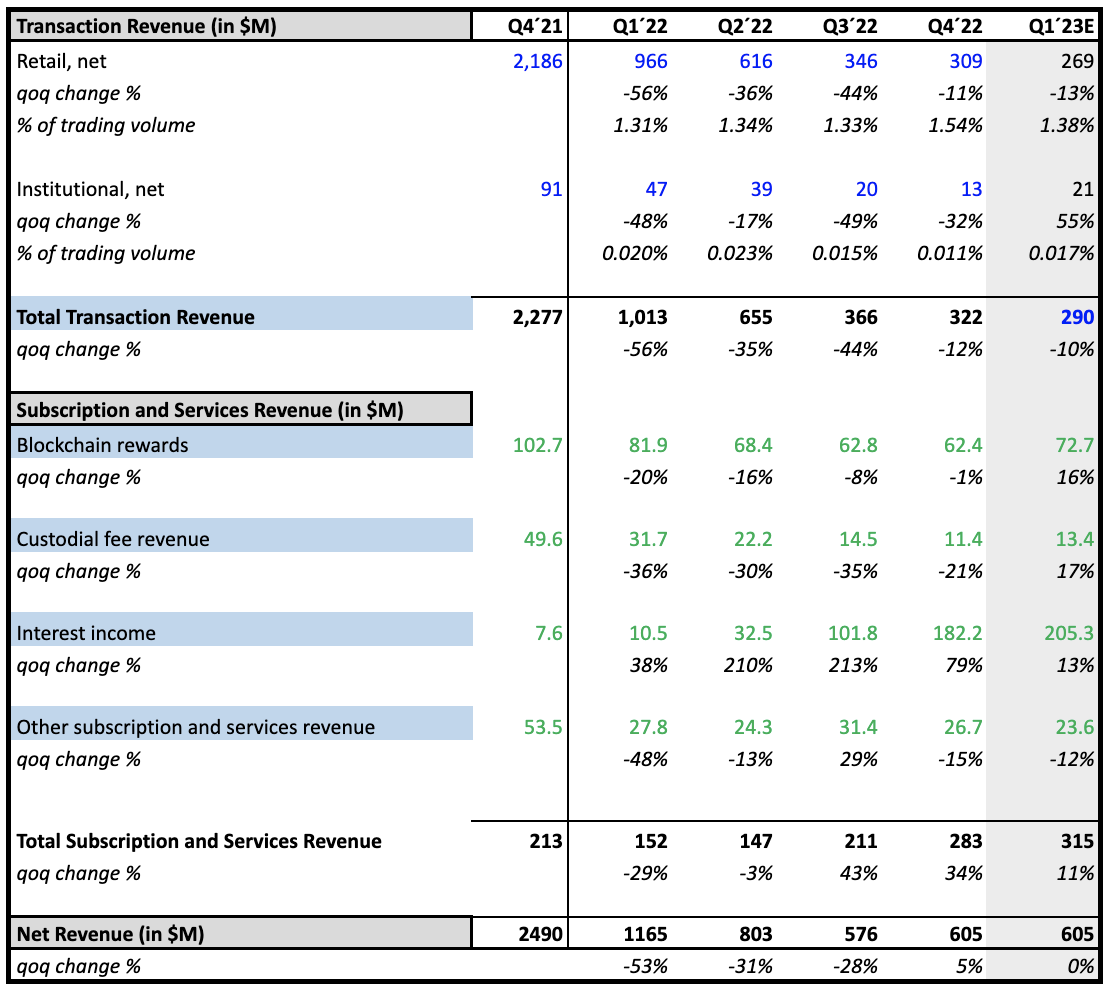
TRANSACTION REVENUE
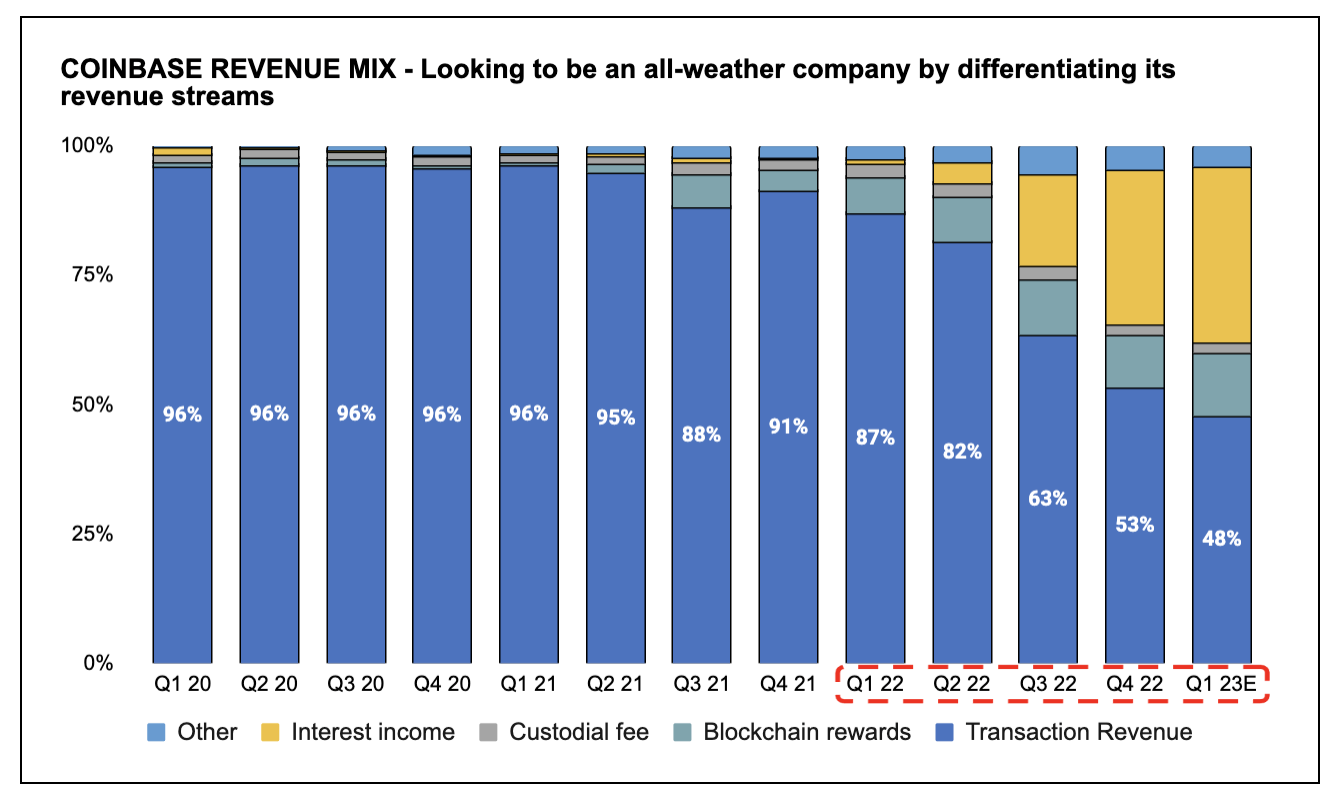
Over the past year, Coinbase's transaction revenues have declined proportionally to the increase in revenues from its subscriptions and services segment. The volatility of the cryptocurrency market and Coinbase's effort to become an all-weather company and diversify its revenue streams are the main reasons behind this decline. As you can observe in the graph below, Coinbase is currently navigating through a transition period as it shifts towards a more stable P&L, providing opportunities to generate strong top-line revenue and EBITDA, even in an ever-changing market.
1. Trading volume and transaction fees
Transaction Revenue remains Coinbase's primary revenue source. To estimate it two drivers have been considered: a) Trading Volume, and b) Fee Take Rate. The methodology used considers the distinction between the volume transacted by retail and institutional investors, given that the company has historically charged different fees to each of these segments.
a) In terms of Trading Volume, the company regularly publishes the total transactional volume on a daily basis. However, it does not distinguish the proportion that comes from retail investors from the proportion that comes from institutional investors. The first assumption we have to make in this case is what % of the total transaction volume comes from retail and what percentage comes from institutional investors since it charges different fees to each of them.
As seen in the chart below, since 2018, the proportion of volume transacted by retail investors has been steadily declining, suggesting this increasing entry of institutional investors into the crypto trading market.
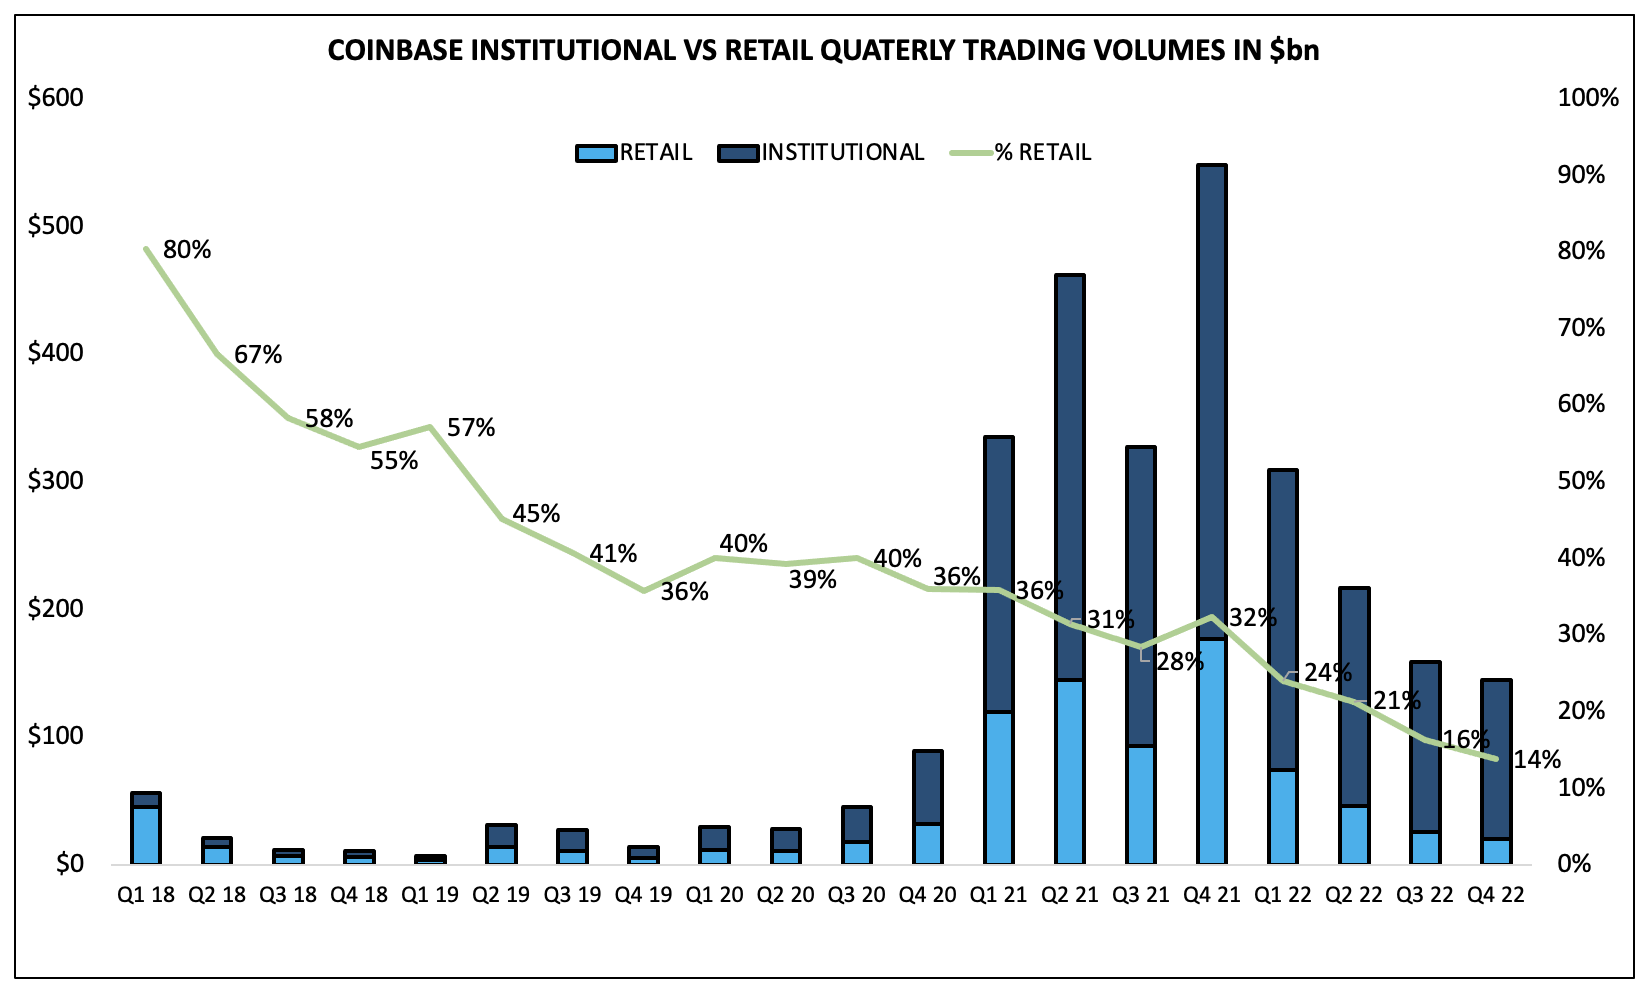
Based on this historical data, I expect the negative trend in retail transacted volume to persist during Q1´23E. Therefore, I predict that the percentage of retail transacted volume will slightly decrease from the previous quarter's figure of 14% to 13%. The remaining 87% of the transacted volume is anticipated to come from institutional investors. Therefore, out of the reported total trading volume of $145B, I estimate that $18B will come from retail investors and $126B will come from institutional investors.
b) In terms of the Fee Take Rate, I assumed Coinbase will continue to charge a transaction fee similar to the historical average for retail, while the fee for institutional investors will either decline or remain similar to the historical average. Thus:
-
Retail transaction fees for Q1´23: 1.38% (avg of the last 4Q).
-
Institutional transaction fees for Q1´23: 0.017% (avg of the last 4Q).
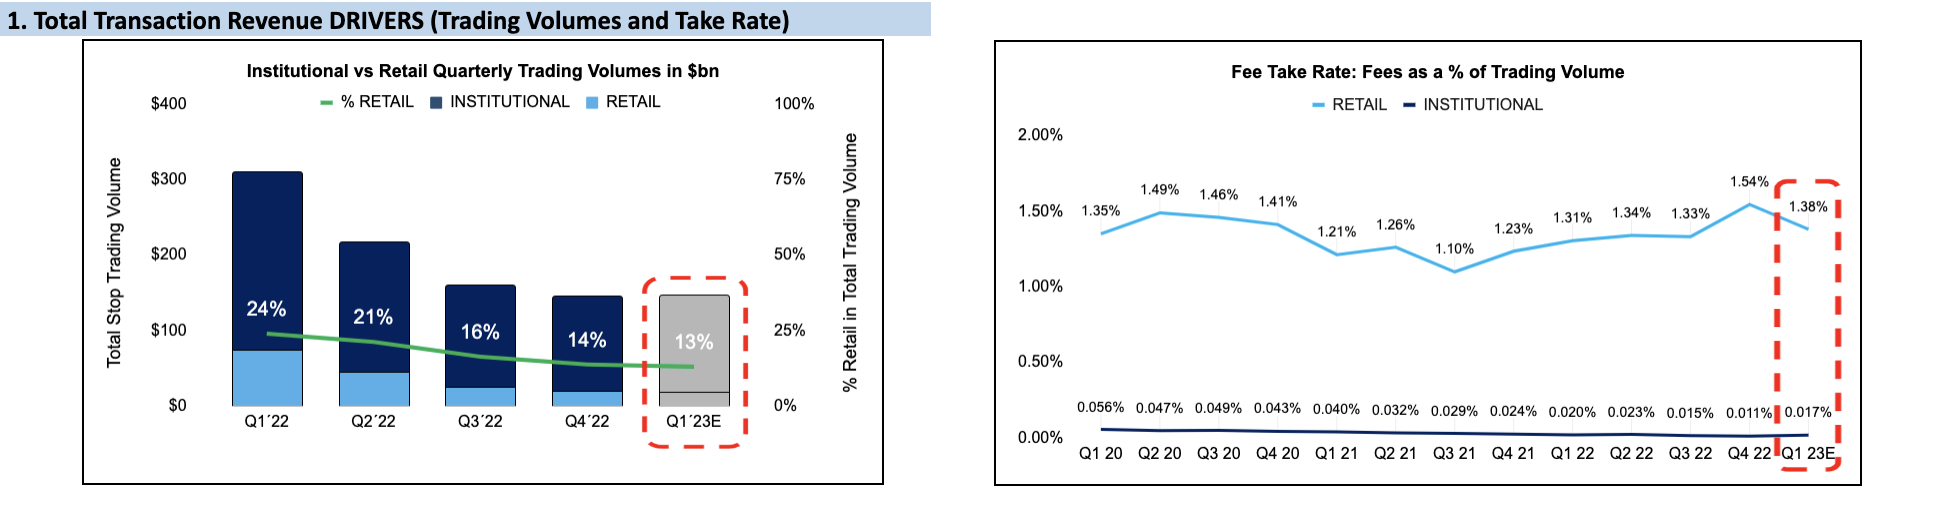
In summary, Transaction Revenue is estimated to be $290M, with a QoQ decrease of 10%.
Disclaimer: It´s important to consider that during Coinbase's Q4'22 Analyst Call on February 21st, 2023, the company disclosed a Transaction Revenue of $120M for the month of January. As such, the total revenue estimate of $290M takes into account both, the disclosed January revenue and estimated revenues for the months of February and March using the methodology outlined above.
SUBSCRIPTION AND SERVICES REVENUE
2. Blockchain rewards
To estimate 2. Blockchain Rewards, I have calculated the rewards earned separately for ETH staking and other cryptoassets (e.g., Tezos, Cardano, Algorand, Cosmos, Solana, and Aptos). Since Coinbase does not provide detailed information on the revenues of each asset, first, I estimated ETH's reward contribution by considering three key metrics:
-
The amount of ETH deposited and staked through the Coinbase platform. Source: Cumulative Eth Staked (forked from @hildobby dune query).
-
The daily APR offered by the Eth POS blockchain to validators. Source: Protocol vs Lido APR from @LidoAnalytical dune query.
-
The daily USD price of ETH. Source: Artemis Google Sheet plugin.
Combining these metrics enables a precise estimate of ETH's contribution to Coinbase's Blockchain rewards revenue.
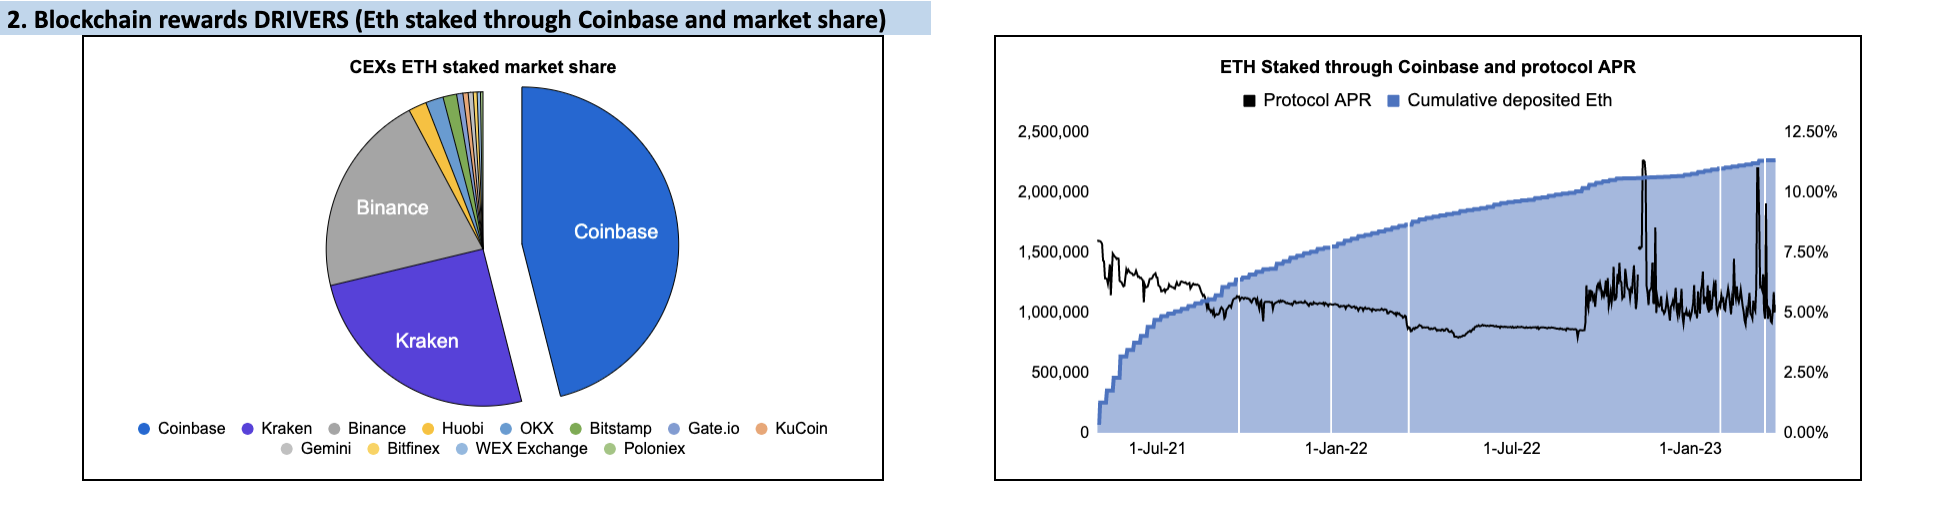
To estimate the contribution of other blockchain rewards, including Tezos, Cardano, Algorand, Cosmos, Solana, and Aptos, I assumed that their revenue would grow in line with their average market cap during the analyzed quarter. I obtained this data from sources such as Coingecko, utilizing the Artemis Google Sheet plugin for automatic retrieval. During Q4´22, the sum of the average market capitalization of these cryptoassets was $23.21M, increasing to $25.37M at the end of Q1´23, representing a growth of 9.3%. I used this percentage as a simple proxy to estimate the % increase in staking revenue coming from these other cryptoassets. Find below the table used to make the estimate:
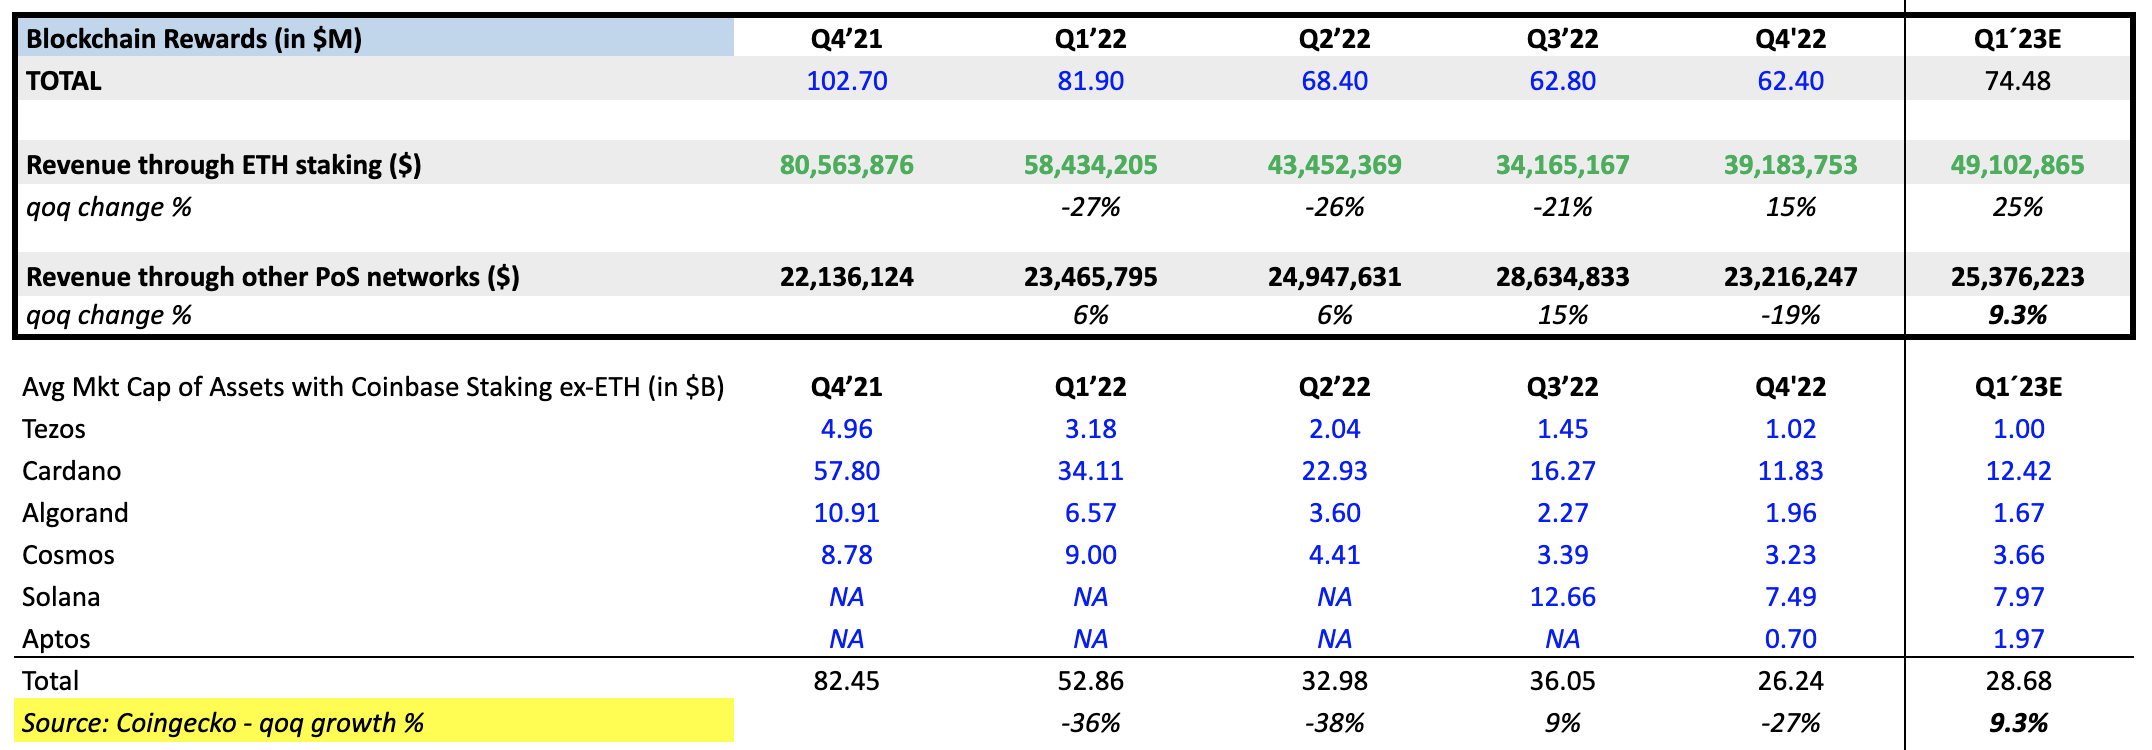
Disclaimer: It is important to consider the accounting of Blockchain rewards that Coinbase uses. Staking is reported as 100% revenue but 75% of this revenue is passed through to users and accounted for in the transaction expense item. Coinbase's real or net revenue from staking is derived from the margin between the rewards it receives and what it pays its users for providing funds, but it reports it on its top-line revenue on a 100% basis.
In summary, Blockchain rewards revenue is estimated to be $74.48M, with a QoQ increase of 19%.
3. Custodial fees
To estimate 3. Custodial fees, two drivers were considered: a) Assets on Platform classified as Institutional vs Retail, and b) Custodial fee as a % of avg institutional assets. Coinbase reports its Assets on Platform quarterly, classified according to the type of client (retail or institutional) and type of assets under custody (BTC, ETH, Fiat, or other cryptoassets). My overall methodology involved estimating first Assets on Platform by the cryptoasset classification (BTC, ETH, Fiat, and others) to arrive at the total estimate. Then, I applied the estimated percentage that historically belongs to institutional investors (based on previous quarterly reported percentages), as institutional investors are charged a fee.
a) To estimate Assets on Platform, based on the cryptoasset classification, the main assumption involved a 10% estimated increase compared to Q4´22 due to the loss of confidence in traditional banks in the last weeks of March, according to SVB and First Republic news. This 10% increase was estimated in terms of the increase in units of assets under custody, regardless of price. Next, each asset was multiplied separately by its trading price at the end of the quarter to arrive at the total dollar estimate of $133B assets under custody following the classification into BTC, ETH, Fiat, and others, as shown in the table below:
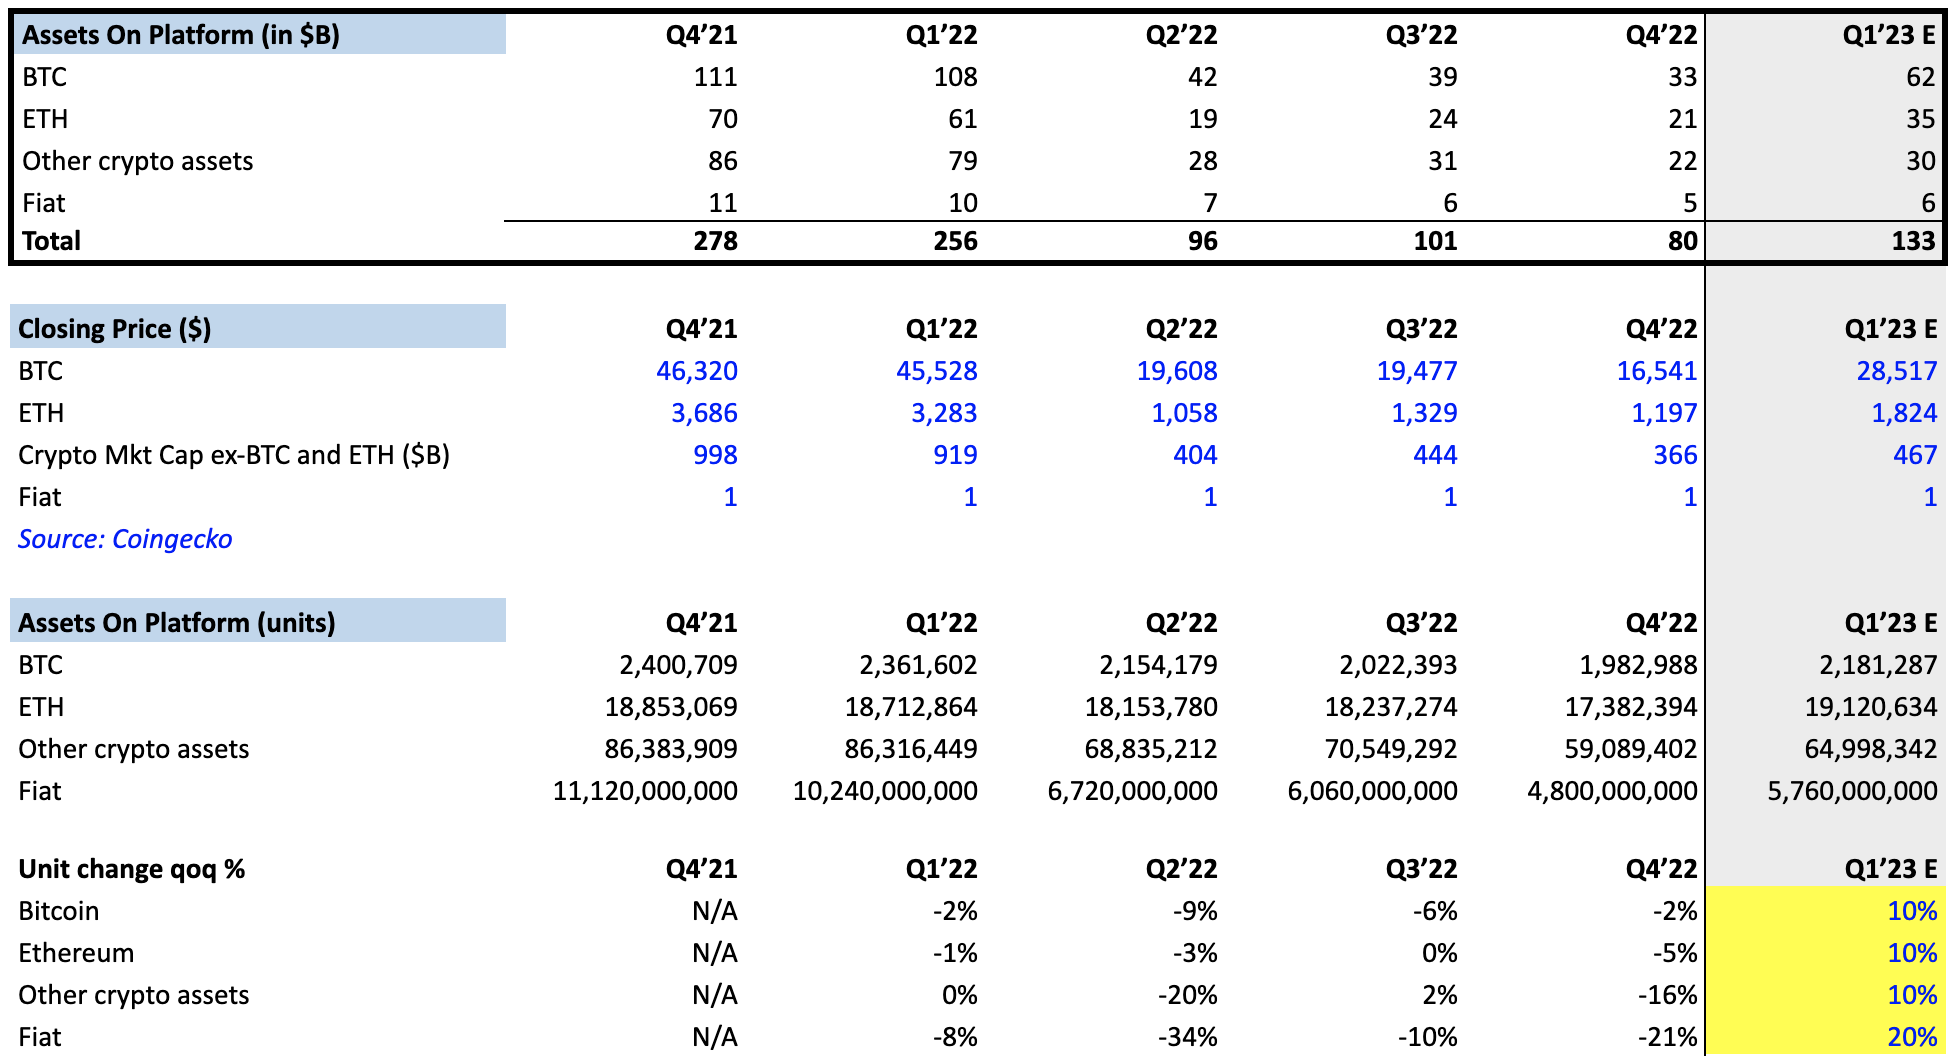
The last step would involve dividing the arrived estimate of $133B total custodial assets into the % estimated to belong to institutional investors. In this case, I used the same ratio as Q4´22, which is 50%.
b) In terms of Custodial fees, once the assets under custody from institutional investors have been estimated, I assumed Coinbase will continue to charge a % fee similar to the historical average, which has been proportional to the institutional assets under custody. As observed in the table below, on average, they are charged 0.025%, which is the percentage used for this quarter.
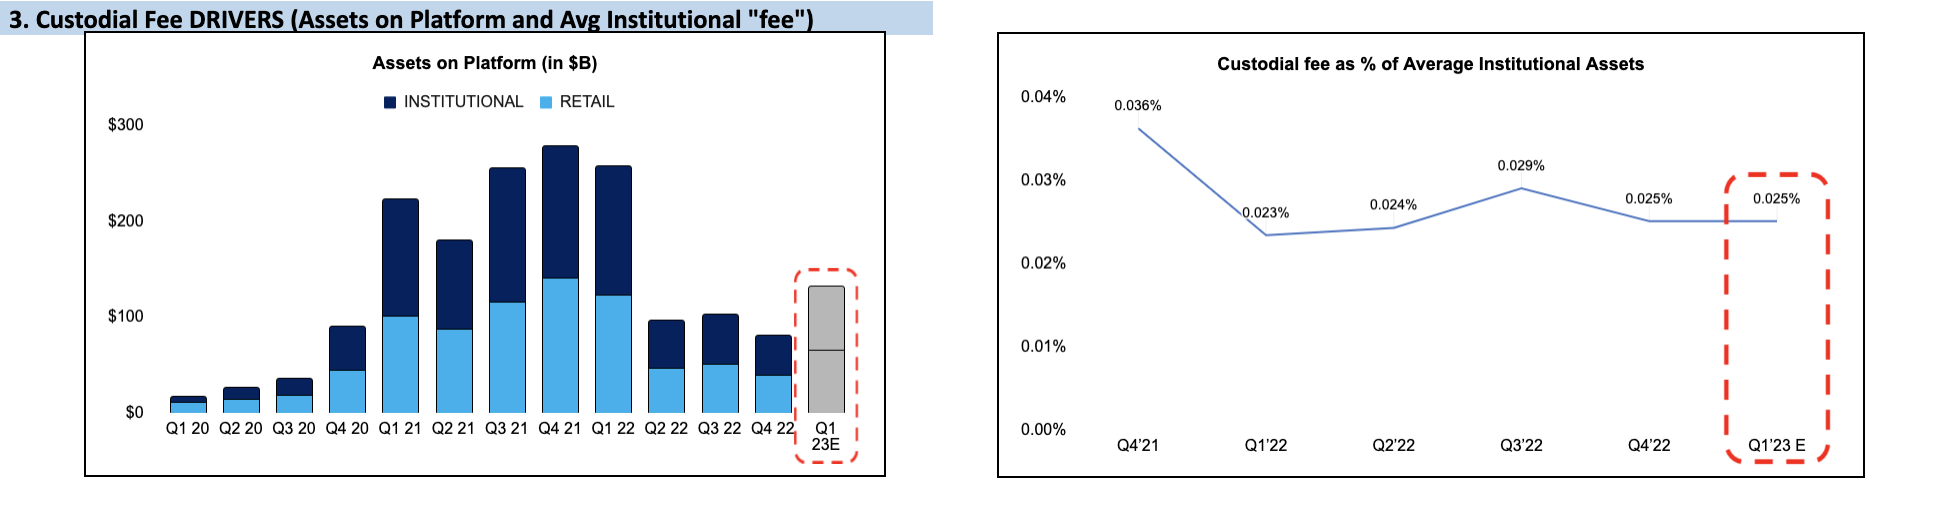
In summary, Custodial fee revenue is estimated to be $13.3M, with a QoQ increase of 16%.
4. Interest on USDC reserves
To understand the USDC interest revenue, we have to introduce the business model of Circle, the company behind USDC. They invest a proportion of the dollar reserves backing the stablecoin through an SEC-registered public money market fund called the Circle Reserve Fund, which holds a portfolio of U.S. Treasury bonds with an average maturity period of one month, custodied at Bank of New York Mellon and managed by BlackRock.
In simplified terms, Circle, Coinbase's partner, is responsible for issuing and redeeming USDC, while Coinbase is one of the few remaining companies capable of holding USDC at scale. This partnership between Circle and Coinbase took place in October 2018 by forming CENTRE, a consortium with the mission to securely and transparently digitize on-chain dollars. Customers can tokenize their dollars and convert them into USDC and redeem USDC for dollars through both platforms, Circle and Coinbase, making USDC the industry's first open, fungible, interoperable fiat-backed stablecoin.
Based on this, to estimate 4. Interest on USDC reserves, two drivers were considered: a) the USDC market cap, and b) 1 Month T-bill annualized yield. The methodology involves estimating the daily interest earned on the average 80% investment on US T-bills which Circle typically holds against its USDC circulating supply.
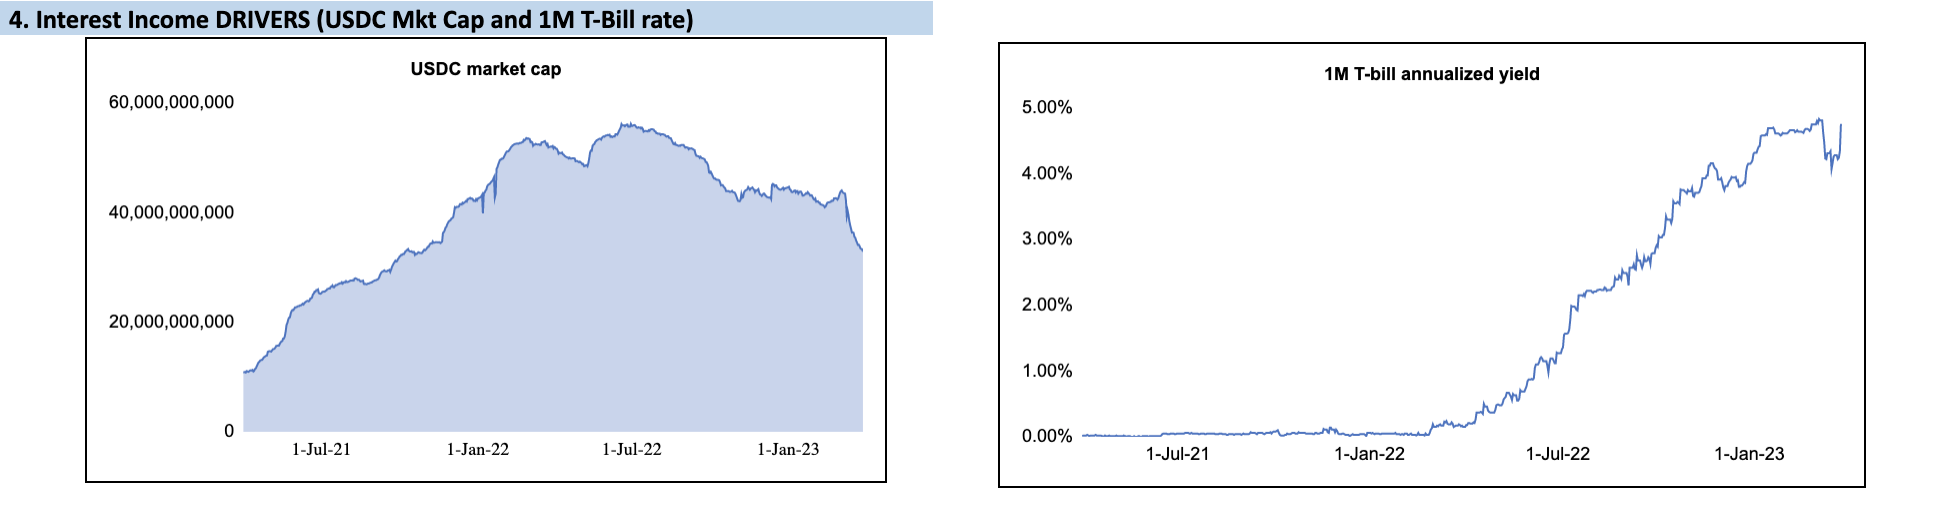
Below is a summary table for the month of January 2023 showing the daily interest rates that have been estimated using the methodology described above.
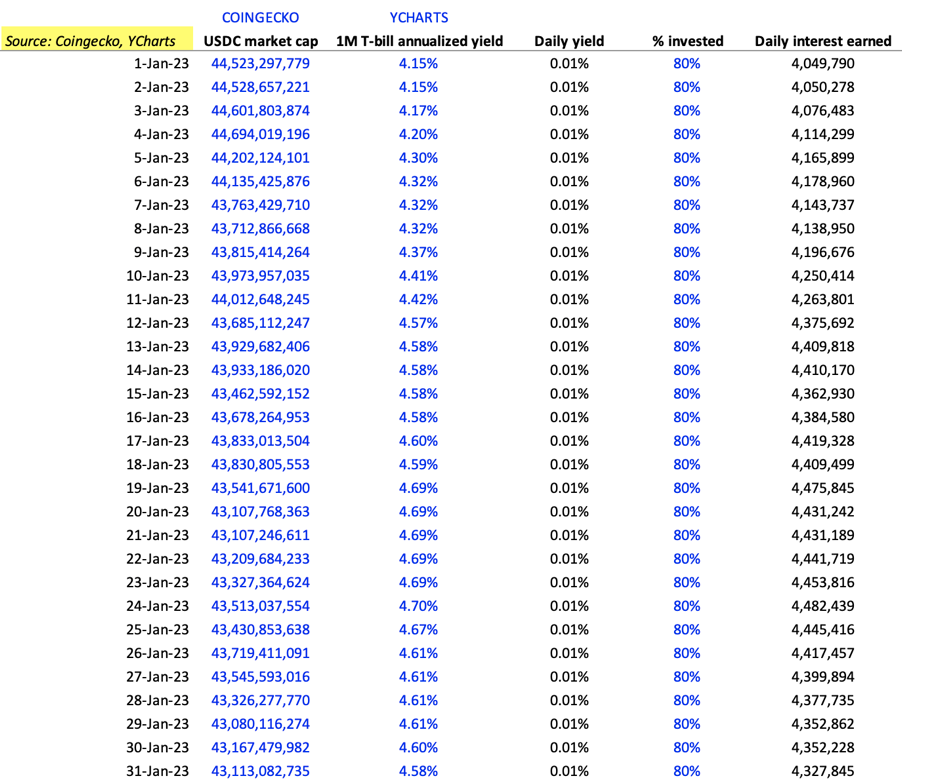
Finally, for the estimation of total quarterly revenues, it is assumed that they increase with respect to the previous quarter by a % equal to the estimated increase following the methodology described in the previous calculation, as shown in the following table:
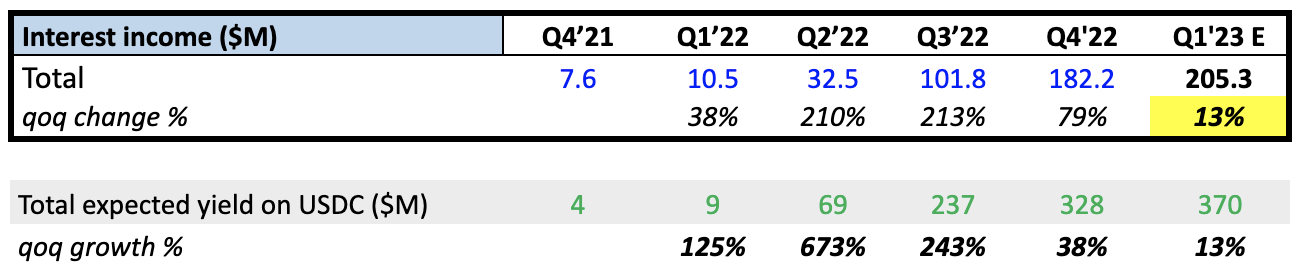
In summary, Interest on USDC reserves revenue is estimated to be $205.3M, with a QoQ increase of 13%.
5. Other subscriptions and services
Most of the services that are included inside this category are not material enough for Coinbase to call out significant operational metrics, or revenue, which is why it’s bucketed in the other revenue category. They include:
-
Coinbase One: subscription that gives access to $0 trading fees on the Coinbase Platform, $1M account protection, and 24/7 phone support.
-
Learning Rewards / Earn Campaign: incentivizes users to learn about crypto with quizzes and tasks to earn cryptocurrency.
-
Coinbase Cloud: offers tools for web3 developers to create applications using Coinbase's infrastructure. WAAS, APIs, and SDKs are some examples.
-
Other subscription licenses: additional subscription-based services like advanced trading tools, market analysis, research, and tailored features to enhance user experience on the platform.
Based on this, to estimate 5. Other subscriptions and services, due to not having much information, I have followed an approach based on the average of the quarterly variations recorded during the last year. According to historically reported data, a negative trend is observed with an average decrease of -11.59%, which has been used to estimate this line of revenues for the next quarter, as can be seen in the corresponding graph.
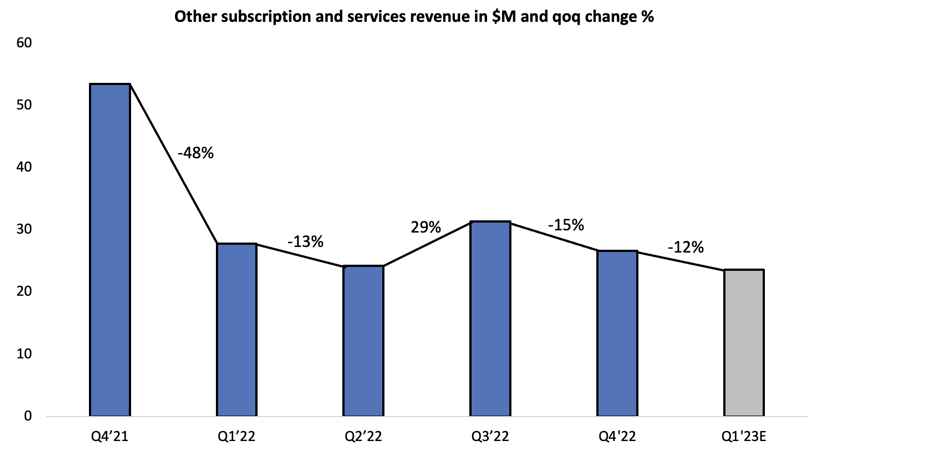
In summary, Other subscription and services revenue is estimated to be $23.6M, with a QoQ decrease of 12%.
*BASE L2 🔵
On February 23, 2023, Coinbase announced on its blog the launch of "BASE," a L2 blockchain intended to serve as the bridge that will allow users of its platform to move to and interact with the “cryptoeconomy”.
As the development of the Layer 2 (L2) solution is not expected to have a significant material impact on Coinbase's operational metrics or revenue in the near term, I have included it as a subsection of the Other subscription and services bucket. Despite this, I believe that BASE will have a positive influence on Coinbase's revenue sources as it is expected to be a transversal solution.
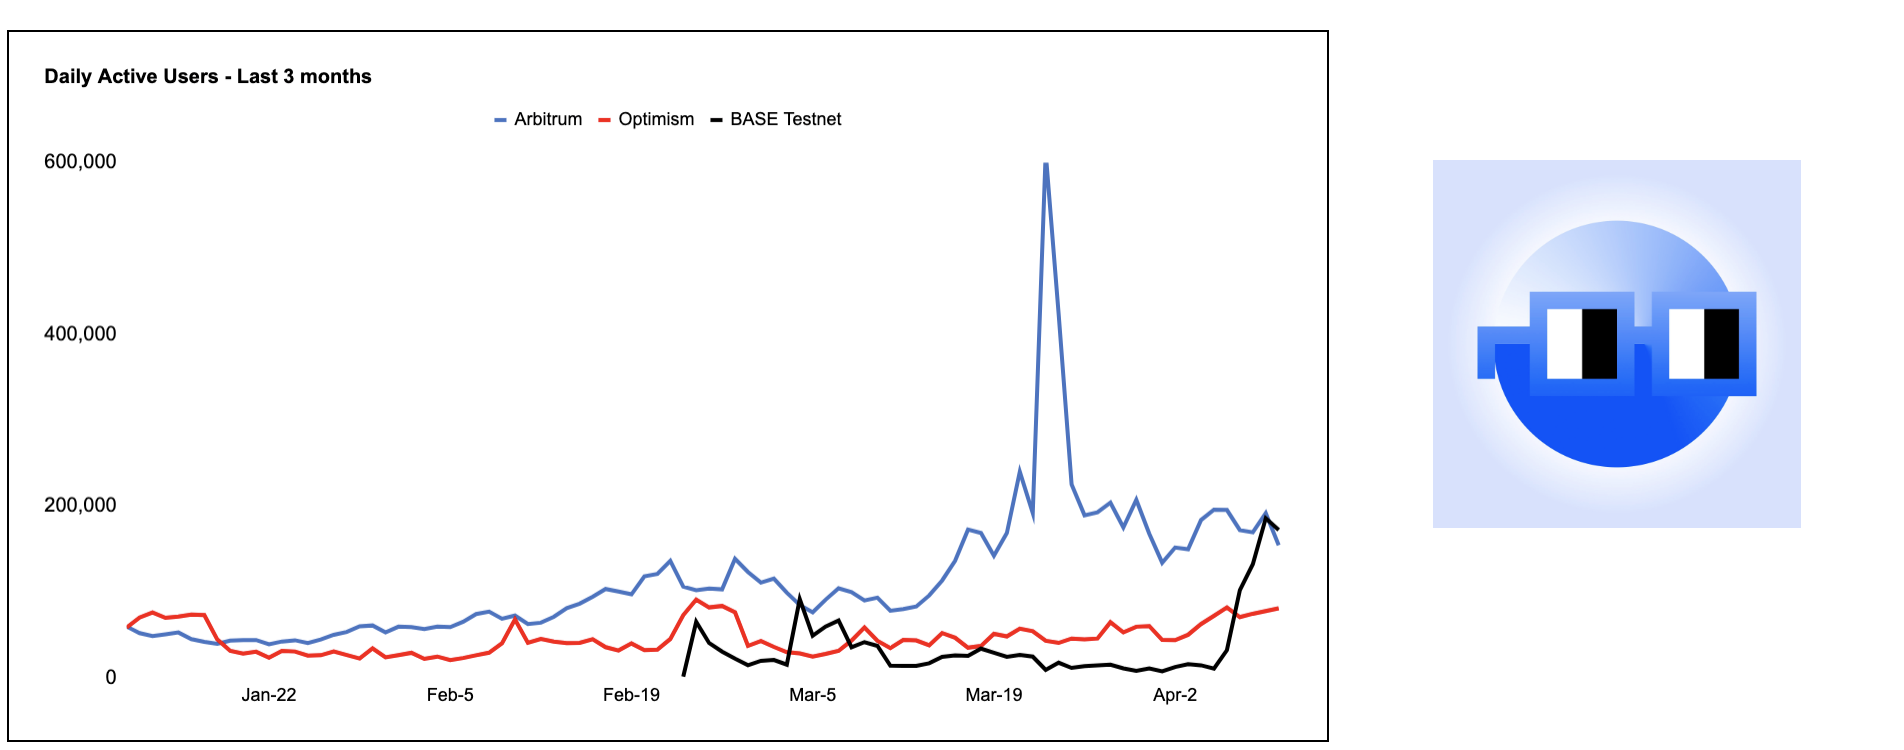
Although operational metrics and revenue information cannot be disclosed at present, we can obtain a gauge of the L2 solution's economics by analyzing the revenues and daily active users of other L2 sequencers.
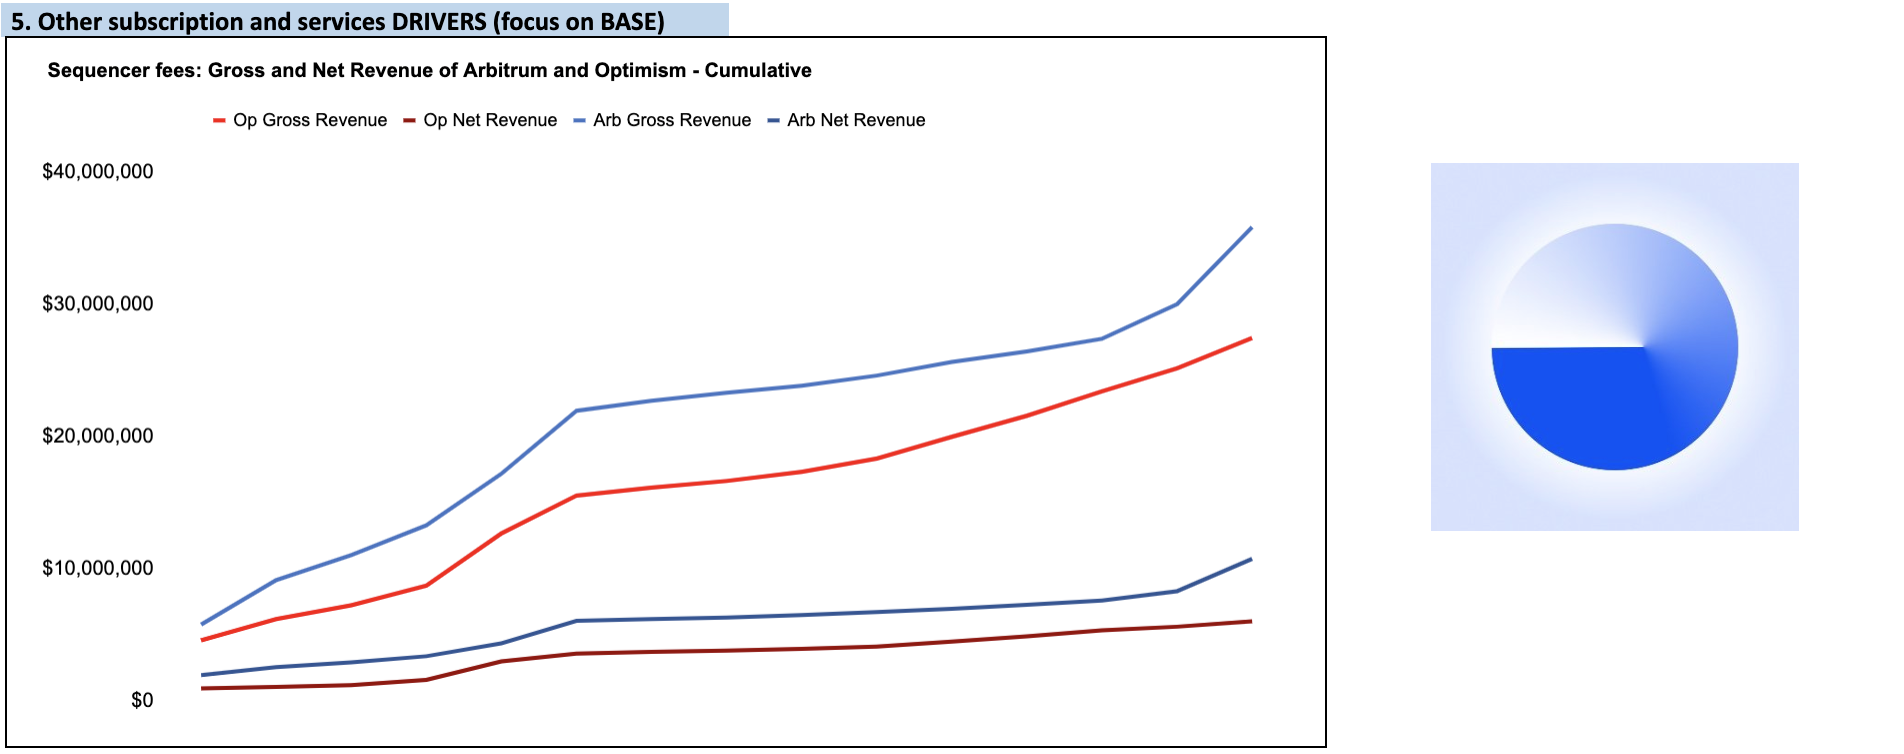
Optimism and Arbitrum, earned gross revenues of $18M and $22M, respectively, in 2022, generating net revenues of $4M and $6M. It is important to note that the difference between gross and net revenue is due to the process these L2s follow and how they interact with their main L1.
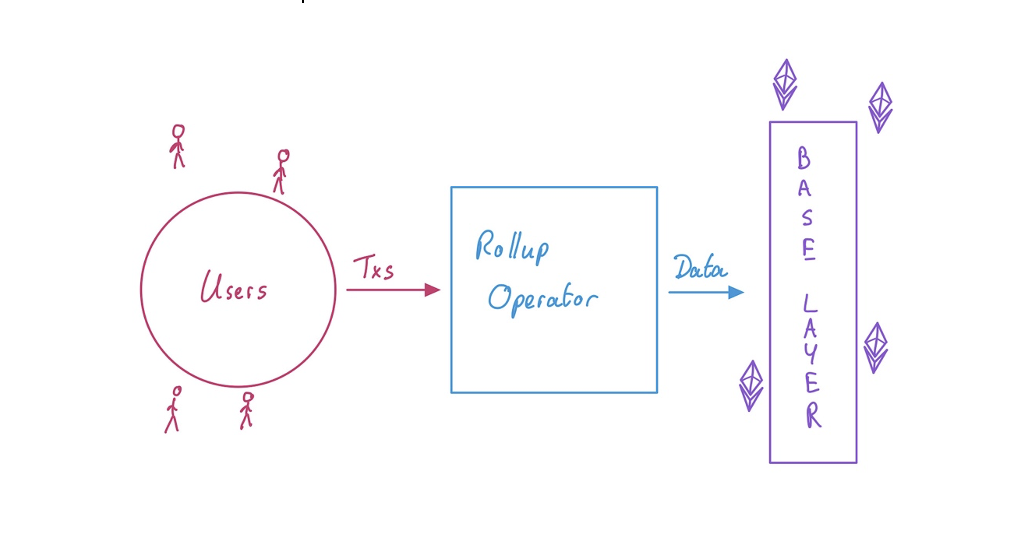
L2-L1 interaction*: Users pay a gas fee every time they interact with a dApp or smart contract or conduct a transaction, which is considered the gross revenue of the sequencers who validate these transactions. The validators then collect all these transactions from time to time and record them in the main L1, during which they also pay gas fees. The difference between what the sequencers pay to record these transactions in the main L1 and what they receive from the users in their L2 is what is considered the net revenue.*
This provides a useful framework for estimating the potential revenue and economic impact of Coinbase's L2 solution. Moreover, leveraging the interoperability of its new blockchain platform with its existing products and broad user base, Coinbase's Layer 2 solution presents an exponential potential increase in revenue. For instance:
-
By promoting the use of USDC as BASE's native currency for transaction fees and dApps, Coinbase can increase demand for USDC, generating higher interest income and consolidating its position in the stablecoin market.
-
Incentivizing the use of cbETH can increase ETH deposits through Coinbase's staking platform, resulting in higher revenue through the 25% fee charged for offering this service
CONCLUSION
In conclusion, Coinbase's Q1 2023 financial performance is expected to be strong, with an estimated base case revenue of $606M. The Fee Take Rate on Trading Volumes is expected to remain the primary driver of overall revenue. Additionally, Coinbase's diversification of revenue streams through its subscriptions and services segment, such as Blockchain rewards, Custodial fees, Interest on USDC reserves, and Other subscriptions and services, will contribute to its overall revenue growth.
Moreover, the launch of BASE, Coinbase's Layer 2 blockchain solution, presents a promising opportunity for exponential revenue growth. By leveraging its new blockchain platform and existing user base, Coinbase can generate economic value by promoting the use of USDC as BASE's native currency, incentivizing the use of cbETH, and providing a transversal solution to move and interact with the cryptoeconomy. As the cryptocurrency market continues to evolve, Coinbase's commitment to diversifying its revenue streams and providing innovative solutions for its users ensures its position as a major player in the industry.
Finally, I would like to express my gratitude to everyone who has taken the time to read and appreciate this report. Thank you!
Appendix:
-
Currently, Ethereum's staking ratio, which is the proportion of staked ETH versus its circulating supply, is around 15.6%. In contrast, other proof-of-stake (PoS) blockchains such as Cardano and Solana have staking ratios of around 70%. With the upcoming "Shanghai" upgrade and withdrawal enablement, the staking ratio for Ethereum is expected to increase (to 40-50%). If Coinbase is able to maintain its LSD market share and capitalize on this growth, it would result in a significant increase in gross revenues for this segment. This assumes that Coinbase's market share will remain constant as the overall market expands, leading to proportional growth.
If we were to estimate this into the future we could expect a considerable increase in Blockchain rewards revenues. If Ethereum's staking ratio were to increase to 50% (accounting for a reduction in APRs), Coinbase´s blockchain rewards revenue coming from ETH could increase by 25-40%.
-
Data sources used:
a) Artemis Google Sheets and Excel Plugin
b) Dune Dashboards: Eth Staked - Cumulative by @hildobby; Lido staking APR by @LidoAnalytical; Rollup economics by @niftytable / @0xKofi on tw.
d) Fourth Quarter and Full Year 2022 Analyst Call (Q4´22 Shareholder Letter).
-
Sensitivity table for Institutional and Retail Fee Take Rates.