
Author Daniel, Co-author Carrie |Chain Hill Capital
Abstract
This paper consists of two parts. The first part explores the relative valuation models for DYDX token utilizing traditional financial ratios such as PE, PS and PEG. Some adjustments are made to each of these metrics to improve the model. Overall, in terms of mean and standard deviation of valuation errors, PEG with monthly growth estimation and PS filtering values greater than 100 show the most potential. However, the ultimate choice of adjustments lies with the purpose investor wishes to achieve. The second part investigates some potential contributors to the fluctuation of DYDX token prices. Protocol revenue and VIX are found to be correlated with DYDX token prices with a two-day lag. Furthermore, ETH prices, and growth rates calculated at monthly frequencies seem to also have significant impact on the token prices. Although, we do need to ware the limitation that growth rates calculation based on monthly data only yields two values since we have only less than 3 months of data. There is also possible multicollinearity among VIX, ETH price and protocol revenue.
Introduction
DYDX launched its governance token on the 9th of September, 2021. Since then, its token prices and market cap has gone through some significant ups and downs, reaching up to $26.8 on Sept 30th.
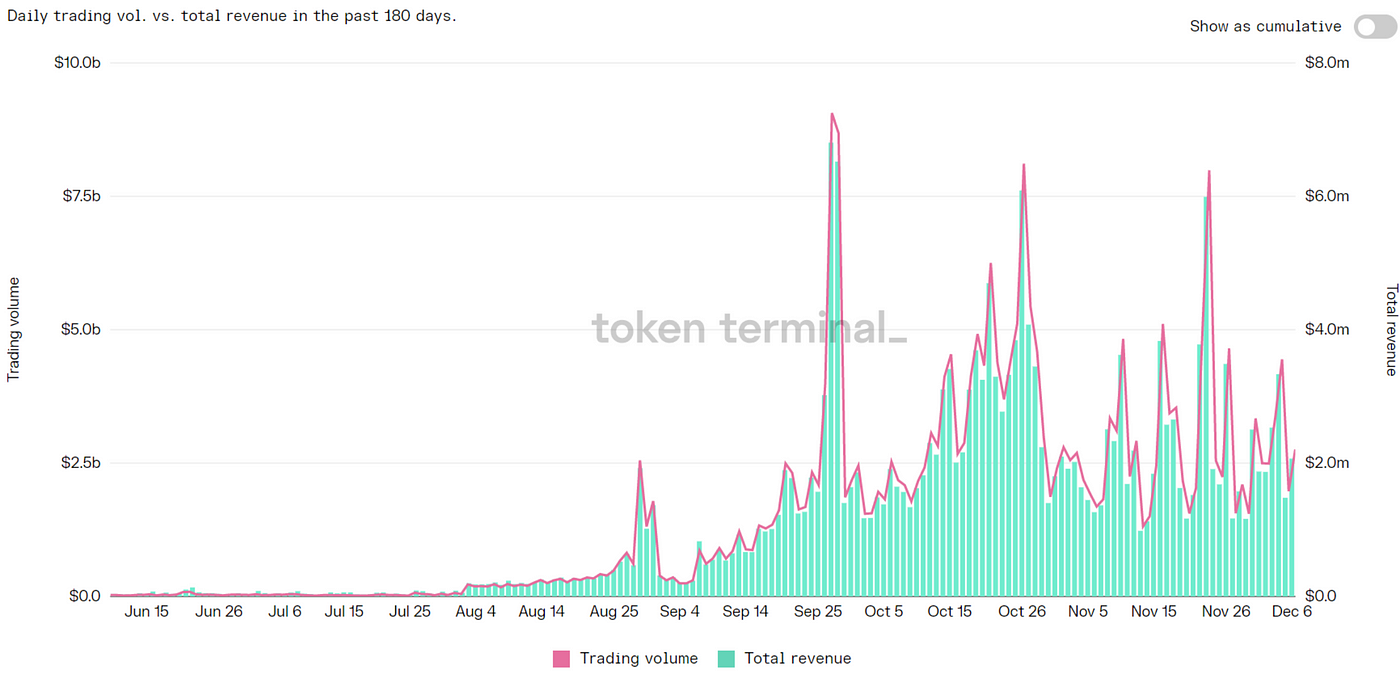
The token experienced a sharp increase in its price during the last few days of September. The sudden price rise coincided with a spike in trading volume, which can be partly attributed to the fact that trading rewards are distributed around the end of each month. Other reasons for the spike has been proposed, such as China banning crypto related transactions, which boots demand for exchanges that do not practice Know-Your-Customer procedures.
It is apparent from the graph below, trading volume is strongly correlated with total revenue.
By examining the graphs for VIX prices and DYDX trading volume, some similar peaks and troughs can be found on both graphs. Overlapping the graphs for token prices and revenue, one may be able to identify similar trends.
These relationships are less evident from the graph and will be examined through regression analysis in later sections along with some other factors.
In this paper, we would like to quantify the impact of those factors on the price of the project’s protocol token.The first part of this paper attempts to valuate DYDX token using metrics of comparable projects. The second part attempts to identify possible contributors to DYDX token’s fluctuating prices and market cap through regression analysis.
Relative valuation
This section explores possible methods to valuate DYDX using comparable projects.
Data
All data in this section are acquired from Token Terminal as daily observations with a time span of one year before Nov 11th, 2021 (if applicable). For DYDX, observations start from 2021–09–08 and end on 2021–11–21. Projects are categorized based on Token Terminal’s sector label and the ones used for DYDX’s relative valuation will be those in the ‘exchange’ sector. A full list of projects can be found in the appendix.
For each of the projects, observations include (if applicable): token prices, total revenue, protocol revenue, TVL, gross merchandise volume, circulating market cap, fully diluted market cap, PE and PS ratios.
In the case of DYDX, protocol revenue and total revenue are exactly the same. Since its token was only launched in early September, less than 3 months of data are available for our analysis, giving a total of 75 rows of observations.
PE ratio valuation
Firstly, we explored the use of PE ratios to valuate DYDX.
The most straightforward method is to take the average PE ratio of comparable projects and multiply it by DYDX’s annualized earnings. Corresponding to Token Terminal’s calculation of PE ratio, we use the most recent 30-day revenue annualized as the earning to calculate its fully diluted market cap. Doing so gives the following result.
Valuation by comparatives indicates that DYDX’s fully diluted market cap should be around $115.7b as opposed to its current market cap of $14.1b. The difference of $100b makes the valuation seem quite unrealistic.
Repeating the procedure overtime yields the following graph. The graph indicates that this method continuously overvalues by a large margin (reaching $900b at one point) comparing to market value.
PE with projects excluded
By examining each project’s data individually, we identified some ‘anomaly’ among a few of them. These projects have extremely volatile PE ratio recorded, sometimes reaching values in thousands or even tens of thousands. (The reasons for these abnormal values are not discussed in this paper.) Hence excluding these projects may produce better estimations (full list of excluded projects in appendix).
As seen on the graph, excluding these projects brings our valuation much closer to the marker’s valuation. However, persistent difference still exists.
Latest valuation of this model: $26.84b
Statistics for valuation differences (Comparative Valuation — Market valuation):
Mean: 13b Standard deviation: 4.5b
PE with filter
Instead of manually excluding projects with abnormal PE ratios, we can automatically exclude observations with PE ratio greater than some threshold.
Excluding PE higher than 100 yields the following results:
Latest valuation: $26.84b
Valuation differences:
Mean:13.2b Standard deviation:4.9b
Overall, the results seemed pretty similar to the previous method.
We can push it further by filtering out PE ratios greater than 50.
Latest valuation: $21.18b
Valuation differences:
Mean: 7b Standard deviation: 4.1b
Out of the three methods, it would seem that filtering out observations with PE>50 is the closest to market valuations. It has the smallest mean and standard deviation for valuation differences. Furthermore, combining the PE<50 filter with project exclusion yields the same result as using the filter alone.
PE ratio valuation
Although protocol revenue and total revenue are the same for DYDX, total revenue was recorded for almost every project whereas protocol revenue was only applicable to some. Hence using PS ratio introduces more comparable projects. More importantly, protocol revenue and total revenue has different economic meanings for token holders. While the former only includes revenue paid to protocol and/or its token holders, the latter also includes revenue taken by supply-side participants such as makers or liquidity providers. In case of DYDX, currently the DYDX Trading Inc is collecting the fees instead of protocol treasury or DYDX token holders. Hence, total revenue is a more comparable ratio than protocol revenue.
Utilizing all available observations of PS ratio we are able to conduct the valuation. The resulting difference is around $50b, although this is much smaller than that of baseline PE model as expected, it’s still a significant large difference. Hence, further adjustment measures need to be taken as well.
PS with filter
Adapting the same approaches as PE, we can achieve better results.
Filtering out PS>100 yields:
Latest Valuation: $22.72b
Valuation differences:
Mean:1.81b Standard deviation: 5.8b
This method initially undervalues the project comparing to market valuation, then overvalues the project after mid-October. Hence the mean of valuation differences is relatively smaller compared to other valuations. It does, however, has a larger standard deviation for valuation differences.
Again, pushing the filter further to filter out PS>50:
Latest valuation: $10.89b
Valuation differences:
Mean: -5.2b Standard deviation: 3.5b
This model consistently undervalues the project comparing to market valuations. It has a negative mean valuation difference and the smallest standard deviation out of all precious models.
PEG ratio valuation
Another metric we can use is the PEG ratio, which takes into account a project’s growth potential. But the choice of growth estimation can lead to different conclusions as we shall see later. The following models infer future growth rates from past performances. Due to its limited history, one may be able to estimate a better growth rate based not only on historical data, but also fundamental analysis.
PEG with Compound Annual Growth rate (CAGR):
The CAGR formula is as follows:
Where EV stands for ending value, BV — beginning value, n-number of years.
It may be worth noting that this method only takes into account the starting and ending value, but daily revenue tends to be very volatile in decentralized exchanges. Therefore, we average daily revenue over month to smooth it for the growth calculations. The filter of PE<50 is carried over from the PE valuation section.
Latest valuation is around $5b
Valuation differences:
Mean: -11.7b Standard deviation: 2.7b
It seems this model consistently undervalue the project by quite a margin, with a very small std. of 2.7b.
PEG with Average Week-on-Week daily revenue growth rate
Making use of all available data may provide better insights than using just the starting and ending values. For the week-on-week growth rate, we average daily protocol revenue over a week, then calculate its growth rate over time. Finally, we take the average of these weekly growth rates as an estimate of future growth rate.
For DYDX, the average growth rate is about 24.2%.
Again, combining with the PE<50 filter, we obtained the following results:
Latest valuation: $89.3b
Valuation differences:
Mean: 68.8b Standard deviation: 13.5b
PEG with Average Month-on-Month daily revenue growth rate
We can repeat the previous procedure but averaging revenue at monthly frequencies instead of weekly. The reason for changing frequencies is to smooth the growth rates. For DYDX itself, its daily revenue experience some form of calendar effect. Due to trading rewards being distributed near the end of each month, trading volume was significantly higher in the second half of each month and so does its protocol revenue. Therefore, for projects like DYDX, week-on-week growth rates can be very volatile and become easily influenced by extreme observations. The growth rate of DYDX under this method is about 15.2%.
Combining with the PE<50 filter, the following results were obtained:
Latest valuation: $9.3b
Valuation differences:
Mean: -7.3b Standard deviation: 2.9b
Overall, this model seems to be tracking market valuation much better than the one using weekly growths which produces a much smaller mean and standard deviation.
Section conclusion
· Comparison of models:
Smallest Valuation differences mean: PS<100 model — 1.8
Smallest valuation differences std.:PEG_ CAGR model — 2.7
Key points.
·PS<100 model has the lowest differences mean because it went from under to over valuing the project, hence its valuation difference has a relatively higher volatility. :PEG_CAGR model seems to be the best at tracking market valuation trend with the smallest valuation difference standard deviation of 2.7b, but it has a pretty large gap from market valuation. Models that lie somewhere between the two extremes may be more preferable, such as PS<50 and PEG_month.
·The choice of models is essentially a tradeoff between mean and volatility. If one wants a valuation generally closer to the market’s valuation, a smaller mean would be important. However, if one cares mostly about consistently tracking market trend rather than absolute values for market cap, a less volatile model would be better.
· Choice of methods can greatly impact valuation results, sometimes even giving opposing signals. In our analysis, there are over thirty projects categorized as ‘exchange’ and used in relative valuations. However, not all them are suitable for our use. Possible further improvements could be made by hand-selecting appropriate projects with similar product designs and token economics, well-behaved data and properly estimated growth rates. Even with fewer comparable projects, it is possible to obtain more reliable and consistent result,
·For majority of the models, they predict an upward sloping trend from 10th of October to 25th of October regardless of the valuation being higher or lower than market valuations. The market, however, exhibits a downward sloping trend. The increase in valuation can be largely contributed to the spike in revenue near the end of September. The market’s reaction seems to indicate that investors do not believe these revenue spikes will persist.
Regression Analysis
This section explores possible correlation between DYDX token prices and other factors.
Data
Same data was used here for DYDX as the previous section, with the introduction of VIX daily closing prices .
Price & Protocol revenue
We first try to test if there exists any significant relationship between token prices and protocol revenue.
Running an OLS regression of toke price on protocol revenue controlling for TVL yields the following results:
The coefficient for protocol revenue is positive and significant at 5% confidence level, whereas the coefficient for TVL is much smaller in magnitude and only significant at 10%.
Furthermore, having tried lagging and leading protocol revenue by some periods, it seems lagging protocol revenue by 2 days produced the most significant beta for protocol revenue. In other words, regress price observations each day on protocol revenue two days ago.
P-value was improved by 2 percentage point and TVL becomes less significant. The result indicates that an increase in protocol revenue by 1$ today is associated with an increase in token price two days later by $9*10–7. One possible interpretation is that the market takes time to reflect changes in project fundamentals (in this case its protocol revenue).
Under the lagged version for protocol revenue, in-sample prediction looks like the following:
Prediction errors (predicted values — observed values):
Mean: -2.115e-13 Std: 3.889
Price & External factors
As mentioned in the introduction section, VIX shares similar peaks and troughs with trading volume and hence revenue. To formally test VIX’s contribution, data from Investing.com for VIX daily closing price was used in the following regressions.
Coefficient for adjusted close price of VIX shows strong statistical significance.
With the introduction of VIX prices, the constant is no longer significant and the overall R-squared has almost doubled.
The significance level for protocol revenue has dropped to 10%, which could be the result of some co-movement between VIX and protocol revenue as proposed previously. In other words, protocol revenue can be one of the channels of how VIX causes token price to change.
Again, lagging protocol revenue by 2 improves its significance and the same can be done to VIX price, with p-values of 1.4% and 0.1% respectively after lagging both.
Under the lagged version, in-sample prediction looks like the following:
Prediction errors (predicted values — observed values):
Mean: 3.062e-13 Std: 3.527
Price & Growth rate
Lastly, we would like to explore if growth rate affects how investors valuate the project.
The acquisition of growth rate data is, once again, crucial to our analysis. Taking daily protocol revenue growth produces the greatest number of varying observations. However, regression results do not show any significance for the coefficient of growth rate regardless of whether if any other variables are controlled. One possible explanation could be the extremely large fluctuation of daily revenue and hence the growth rate, jumping between large positive and negative values. Compared to variation of prices, growth rate could almost be said to be random.
One could smooth the growth rate observations by taking average over a period of time. If we use the growth rate of the weekly average daily revenue, all observations within a given week would have the same value for growth rate. Regression results were slightly improved, but still not enough to conclude significance. Protocol revenue is excluded as it is correlated strongly with protocol revenue growth.
Finally, the same process can be done on monthly frequency.
Under this method, all factors show significant coefficients and yields the highest r-squared of all regression models. However, it is worth noting that since only less than 3 months of data is available, average revenue over month meaning growth rate only varies twice and only 54 observations were used in the regression. Hence, we prefer to drop this factor until we have enough historical data in the future.
Under the monthly change version, in-sample prediction looks like the following:
Prediction errors (predicted values — observed values):
Mean: -2.801e-07 Std: 3.198
ETH
Other researchers have used ETH or BTC prices as an approximation to market conditions. Drawing from their insights, we introduce ETH prices into our Price & External factor regression.
Without changing anything else, the introduction of ETH prices makes the coefficient of protocol revenue and VIX close price insignificant whether or not we lag these two. The coefficient for ETH itself is strongly significant.
Under the lagged version, in-sample prediction looks like the following:
Prediction errors (predicted values — observed values):
Mean: -1.261e-13 Std: 3.058
By examining correlations between explanatory variables, one can argue there is potentially strong multicollinearity among the predictors.
We notice that VIX price and ETH price have a significant correlation coefficient of -0.7. Hence having both ETH prices and VIX prices is not necessarily a meaningful improvement.
If we drop VIX prices as a factor due to possible multicollinearity, in-sample prediction becomes:
Prediction errors (predicted values — observed values):
Mean: -1.261e-13 Std: 3.058
Dropping protocol revenue as predictor:
Prediction errors (predicted values — observed values):
Mean: 2.782e-14 Std: 3.077
In terms of mean and std. of valuation errors only, using the complete version or dropping VIX prices would give better results.
Concluding remarks
· A main concern is the lack of data since DYDX only launched its token in September, hence just over 70 observations are available. Different valuation methods yield very different result and even indicate opposing directions. Overall, it seems the PEG model with monthly growth and PS model with filter <50 have the greatest potential in terms of mean and std. for valuation differences. If one wish to obtain more accurate valuations, continued observation is needed to obtain reliable growth estimation.
·Most of our valuation models suggest that the market is overvaluing DYDX, only three models indicate otherwise (PS<50, PEG_MONTH, CAGR). But both PS<50 and PEG_Month models have relatively low mean and std for valuation differences. The CAGR model also has the lowest std. out of all. Therefore, these models should be taken into consideration with higher weights than other models.
· Revenue is almost perfectly correlated with trading volume; both are very volatile and show some correlation with VIX index. From our regression results, one may use the VIX prices and observed protocol revenue to predict token price movement 2 days later.
Appendix
List of ‘Exchange’ sector projects:
[0x, 1inch, BabySwap, Balancer, Bancor, Clipper, Curve, DODO, EllipsisFinance, Futureswap, GMX, HurricaneSwap, IntegralProtocol, Kyber, Loopring, MCDEX, MetaMask, NotionalFinance, Osmosis, PancakeSwap, Pangolin, PerpectualProtocol, Quickswap, SaddleFinance, SIRENMarkets, SpookySwap, SushiSwap, Synthetix, TokenIon, TraderJoe, Uniswap, WakaSwap, YetiSwap]
List of projects excluded in the PE_Exclusion model:
[‘1inch’,’0x’,’Kyber’,’Curve’,’Loopring’,’Pangolin’,’Synthetix’]
References
Christanto, M., 2021. Crypto Research, Data, and Tools. [online] Messari.io. Available at: https://messari.io/article/defi-metrics-that-matter-for-a-price-recovery-fundamental-analysis?referrer=category:defi [Accessed 11 December 2021].
Cointelegraph. 2021. DYDX gains 80% in a week — What’s driving the DEX token rally?. [online] Available at: https://cointelegraph.com/news/dydx-gains-80-in-a-week-what-s-driving-the-dex-token-rally [Accessed 11 December 2021].
Investing.com. 2021. CBOE Volatility Index Historical Rates (VIX) — Investing.com. [online] Available at: https://www.investing.com/indices/volatility-s-p-500-historical-data [Accessed 11 December 2021].
Kauflin, J., 2021. How A 19-Person Cryptocurrency Startup Surpassed Coinbase In Daily Trading Volume. [online] Forbes. Available at: https://www.forbes.com/sites/jeffkauflin/2021/10/15/how-a-19-person-cryptocurrency-exchange-surpassed-coinbase-in-daily-trading-volume/?sh=1da407743066 [Accessed 11 December 2021].
Kharif, O., 2021. DeFi Upstart dYdX Briefly Overtook Coinbase in Crypto Trading. [online] Bloomberg.com. Available at: https://www.bloomberg.com/news/articles/2021-10-15/defi-upstart-dydx-briefly-overtakes-coinbase-in-crypto-trading [Accessed 11 December 2021].
Token Terminal. 2021. dYdX metrics. [online] Available at: https://www.tokenterminal.com/terminal/projects/dydx [Accessed 11 December 2021].
About Chain Hill Capital
Focusing on value investment in crypto and blockchain space since 2017, our investment philosophy is building a decentralized financial infrastructure and a user value oriented Internet. Based in Hong Kong, our venture capital focuses on areas including web 3.0 applications, DAO tooling, Defi 2.0, and Gamefi, investing in venture equity and early-stage tokens.Our profound blockchain expertise and broad connections in the space allow us to assist projects at different stages from different aspects such as tokenomic design, community development, legal and audit.
Combining the rigorous fundamental research with quantitative models, we also run funds focusing on liquid tokens investment strategies via an actively managed index fund, as well as a discretionary long only alpha fund.
Disclaimer
This document has been furnished to you for informational purposes only. This document is not a solicitation for an investment, is not comprehensive, and should not form the basis for any investment decision. This document is not an offer to sell or a solicitation of an offer to buy any securities, commodities, or financial instruments, and may not be relied upon in connection with the purchase or sale of any instruments or interests in investment vehicles.