Disclaimer: This content is for informational purposes only, you should not construe any such information or other material as legal, tax, investment, financial, or other advice. Nothing contained in this report constitutes a solicitation, recommendation, endorsement, or offer by MetaStreet or any third-party service provider to buy or sell any securities or tokens or financial instruments in this or in in any other jurisdiction in which such solicitation or offer would be unlawful under the securities laws of such jurisdiction.
🡺 Discord: https://discord.gg/metastreet
🡺 Website: www.metastreet.xyz
🡺 Twitter: https://twitter.com/metastreetxyz
Valuation Refresher
As a reminder, the first MetaStreet Journal article, released in November 2021, focused on valuation methodologies specifically from a lender’s point-of-view, looking at CryptoPunks and BAYC as case studies. This article formed the basis of how MetaStreet thinks about value (TL;DR - single price across a collection determined by a 30-day VWAP, which is then discounted to account for historical volatility and potential liquidation costs) and exposure (TL;DR - laddered maturity schedule to keep exposure below 50% of average weekly transaction volume). This methodology has proven to be both sufficiently conservative so as to not have experienced any defaults across 30M in lending volume since November, while still being aggressive enough to entice borrowers to come to the market.
However, since taking this initial, simplified valuation approach, there have been a number of new attempts to predict real-time values, at the individual token level, using machine learning models (NFTBank appears to be the leader in this space). While MetaStreet continues to focus on the downside (in a liquidation, nuances between traits and rarity are overshadowed by general market liquidity), the continued innovation in predictive valuation models for NFTs is hugely beneficial to all NFT infrastructure providers as well as general market participants attempting to wade through opaque data and thin trading volumes to determine what an NFT is worth. As such, we have begun to test ML models to attempt to refine our thinking on valuation. The balance of this article outlines this process.
“Floor” Price vs Individual Token Values
One of the primary differences between MetaStreet’s view on value vs an NFT investor’s view on value revolves around aggregate vs individual valuation. The MetaStreet protocol holds portfolios of NFT-backed promissory notes, so when considering value, liquidity is paramount. If values have declined below the amount of capital posted in exchange for the promissory note, this is indicative of a down market. In a down market, liquidity dries up. And if there is little / no liquidity from buyers, the only way to entice buying is through lowering price. MetaStreet must focus on the worst case scenario when considering value, which would be the market clearing price at which there is full liquidity to exit the size of the position maturing at that point in time.
Predictive Modeling: CryptoPunks
Determining the Dataset
As the oldest and most liquid NFT project, CryptoPunks are a good starting point for testing new valuation approaches. There were a total of 18,540 transactions since 2017, totaling volume of over 888,000 ETH. Below, we have a scatter plot of all the transactions since 2017. The prices are denominated in ETH with no cleaning or preprocessing applied.

There were transactions on 1,203 days (~70% of total period reviewed), indicating consistent market liquidity. On August 23, 2021 there were 349 transactions, the highest single day transaction volume to-date. Prices were relatively stable from 2017-2020, with rapid growth occurring in 2021 as the broader NFT market demand levels exploded. To illustrate this dramatic shift: the mean price per CryptoPunk was 0.4 ETH from 2017-2020, and has skyrocketed to 56 ETH since 2021. As of writing, the current daily mean price is 68 ETH (data pull is as of April 3, 2022).
Interestingly, after massive growth in transaction volume in 2021, volume has cooled off through 2022, which should inform position sizing.

Floor pricing (defined as the lowest price transacted per day) also saw massive growth in 2021, with current pricing appearing to have stabilized somewhat (albeit on lower volume) through 2022 to-date.

After a first cut of the data, we go back through to remove outliers, filtering to only show transactions falling in the 5th-95th quantile price range on a weekly basis, removing both extremely low values and exceptionally high ones.

Determining the Methodology
To-date, MetaStreet has evaluated NFT collections using a “Collateral Value” formula (defined below) and then discounting that collateral value to account for historical price volatility of the asset.

This methodology has generally resulted in values that are discounted by 50-60%. Any improvement in the underlying modeling that could allow for more accuracy driving higher values (lower discounts) would generally prove beneficial to all parties involved in the NFT collateralization & lending business (both borrowers and lenders).
In our testing, we reviewed a number of possible machine learning models that could be trained to more accurately estimate forward pricing of a collection, in order to see a menu of possible solutions and outcomes. These included:
- Classical Methods: Gradient Boosting (GBM), XGBoost, Random Forest, SVR
- Deep Learning: LSTM, GRU net, NBeats, NHiTs, DeepAR
- Neural Network: ANN
Out of the Classical Methods, we found XGBoost most robust (if you’re curious, more details on the mechanics can be found here). Generally, prediction problems involving unstructured data tend to be best solved by artificial neural networks for large datasets, but for small to medium sized structured data, decision tree-based algorithms tend to be a bit better. We did evaluate the deep learning models, but found there were generally too few datapoints for these models to be particularly useful (with further data degradation when moving from CryptoPunks towards less commonly traded NFTs).
We also experimented with a custom-made neural network (ANN). It has a very simple architecture and few parameters for tuning, so it can be suitable for our problem. The architecture of the ANN is presented on Figure 6, and it consists of a couple of mixed layers of linear and nonlinear functions. Ultimately, however, XGBoost proved to be most accurate and usable for this analysis.

Experimental Setup
Goal
The goal of our experimentation was to find whether we could predict the floor price of the collection. As a starting point, we simply focused on predicting the next day’s floor price based on data from previous days. However, the overarching goal is to make long term predictions and try to predict the floor price over a longer time frame, which can then allow for longer duration loans to be supported by the MetaStreet protocol (ie, 30, 60, 90 day predictions).
Data Organization
Given the collection didn’t have much transaction volume from 2017-2020, we decided to use the data from 2021 onwards in our experiments. We split the data into train, validation and test sets - 90% train & validation set, 10% test set. Given the tremendous volatility and limited datapoints for CryptoPunks, a compressed training set (ie, less than 90%) results in a less accurate outcome for the test set, however as trading volume continues over time, we expect these models to be able to support more compressed training sets and still deliver accurate test sets. We The split is shown below.

Usually, machine learning models work best when input data is normalized, so we applied a min-max normalization, reducing all the data in the range of 0 to 1 (ie, every data point is represented as a % of the total sample set). Additionally, we treat the data as a univariate time series set (i.e. we only look at the floor price at a given time). In future iterations, we will seek to expand on more elaborate feature engineering.
The input for the model is the floor price for the last n days. In the case of next day predictions, n = 7. In other words, given the last 7 days of prices, the model will predict tomorrow’s floor price.
For 30 day predictions, it is the same, only the model will predict the floor price for 30 days from given input i.e. 30 days from the last day of those 7 days entered. Generally we found a 7 day input range to yield the best results without tremendous overfitting clouding the actual accuracy of the analysis.
Model Tuning
When modeling Random Forest, GBM and XGBoost, we don’t do any specific tuning. Rather, we simply tried to optimize splits for the best performance on the validation set, then ran the experiment on the test set. We did a grid search for optimal parameters on SVR with the validation set. There’s always risk of overfitting when using small datasets, which we took into account by balancing the results on the validation set, but need to continue to refine efforts to ensure good generalization.
The same goes for the ANN model, with the exception that here we tried to optimize the learning rate with a simple search with a few magnitudes of values (e.g. 0.1, 0.01, 0.001, 0.001).
Results - Next Day Prediction
Table 1 shows the Mean Average Percentage Error (MAPE) metrics for the models we used in our evaluation for next day forecasts. The below tables show the percentage of error from these predictive models relative to the actual price outcomes (so as an example, XGBoost has a 5.8% margin of error for the validation set).

For a more visual representation, the below figure shows the performance of the XGBoost model vs the original floor price since 2021.
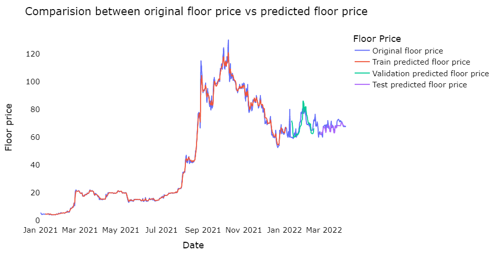
Figure 9 zooms in on the validation and test prediction part of the chart. We can see that the numbers are generally close to what was the actual value. We expect this to get closer as we acquire more data.

Results - Next 30 Days Prediction
Our results for the 30 days projections are shown in Table 2. The classical methods generally perform similarly here as well (i.e. close to each other in terms of performance).

Conclusion
We developed and evaluated machine learning models for floor price prediction on a collection level for CryptoPunks. The initial results are promising and show potential for deeper machine learning approaches into evaluating NFTs. At this point in time, these models are still too nascent to be blindly relied upon in order to increase LTVs from a lender’s perspective, but are indicative of a future with more accurate pricing for NFTs improving a lender’s understanding of value and thereby increasing leverage levels across the industry.
We have tried the same setup on other collections, such as Bored Ape Yacht Club and CyberKongz. We’ve generally found that with less datapoints readily available (as with CyberKongz, for example), machine learning models become less relevant. Fortunately, given the modular nature of MetaStreet secondary market vaults, alternative valuation approaches can and will be relied upon when data is less abundant.
As we dive further into predictive modeling within the NFT industry, we believe that further work into feature engineering will be our next step, fine tuning estimations on price, while also factoring in considerations around liquidity.
Authors: Ivan Kitanovski, Conor Moore