
TL;DR
-
Car depreciation data holds a golden opportunity to generate revenue
-
Rentals (car sharing, for typical owners) are one way to capitalize
-
Additional new ideas, and management of rentals, requires data analytics
-
New products need risk management, but the financial tools are nascent
We all know cars depreciate (lose value) as they age and that new cars have a serious drop in value as soon as we drive off the dealership lot. True, but incomplete. How they depreciate matters, and there could be more money at stake than you think.
Hiding in Plain Sight
The actual value of a car does not fall in a straight line over time, but looks more like this. Miles driven are what really matter and, in terms of depreciation, there are cheap miles and there are expensive miles.
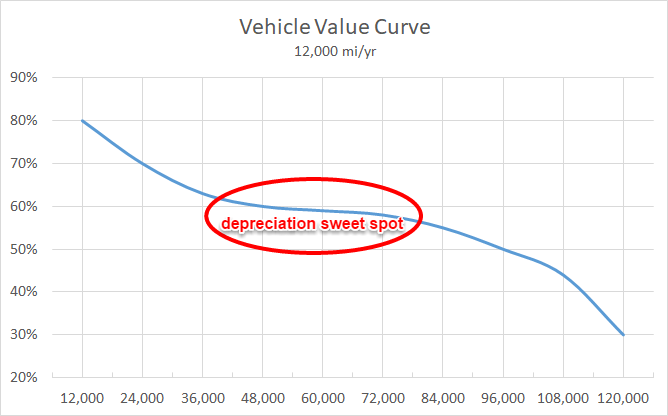
The "depreciation sweet spot" in the chart shows where depreciation per mile slows significantly. An everyday owner wouldn't notice this but from a utility perspective, car value in this phase of its life far exceeds what the owner perceives. The market data tells us that miles added to cars in this range are not as costly to the lifetime value of the car. These are cheap miles.
Dealerships (and retail owners) can use this insight to improve returns. To maximize utility, in economics jargon.
Let's set this up with some numbers. For accounting purposes a Toyota RAV4 XLE loses value at roughly $550/month (straight-line depreciation). We see from the chart above however that using calendar time makes it easier for bean counters, but in reality cars depreciate at different rates over their life. Sometimes practically independent of time. The above chart, for example, shows about 7.5% of car value was "consumed" between miles 34,000 and 50,000 (from 65% to 58.5%).
What are those 16,000 miles worth if we get creative with them instead of mechanically flipping the car to a new owner?
Double Sales: Rent (and Share) to Expand Revenues
Our comparison will be between selling the car right away and using some miles to operate an old fashioned car rental first. However we’re only using cars during the special phase of life described above, the depreciation sweet spot as our fleet.
For a car worth $26,667, this means it will lose 7.5%, or $2,000 during this 16,000 miles.
On the rental side, Hertz has a handy resource called Renting a Car for a Family Road Trip for us. They suggest a 2,000 mile trip would cost about $35/day ignoring fees and tax. We'll use $45/day because our example uses a RAV4 XLE and not a compact.
In the Hertz example, the vacation takes 10 days, netting $450 total. Renters could buy 8 of these trips inside our 16,000 mile window, yielding $3,600 in revenue ($450 x 8). Subtracting out $600 for maintenance, fees, and "turn around" (i.e. the cost to set up and re-rent 7 times) nets $3,000. We just beat depreciation by 50%, bringing in $1,000 more than the value of our car lost over those 16,000 miles. But it gets even better.
Dealerships will see much better returns because their vehicle costs are far less than depreciation. They have operating leverage.
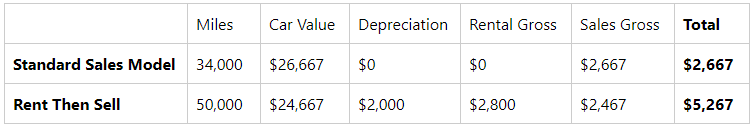
Gross margins on used cars average 10%. For an off-lease $26,667 used car like the RAV4 XLE in our example, that means $2,667 gross profit per sale. If a dealership delays selling and instead rents that car out during the 16,000 mile depreciation sweet spot and then sells it for $24,667, the gross profit drops to $2,467. So the cost of rental inventory is actually just the cost of holding the car a bit longer, or $200 ($2,667 minus $2,467). What?!
That's right, understanding real-world depreciation data enables our clever dealership, over one summer let's say, to make an extra $2,800 per car. It's as if they can sell the same car twice, given the right inventory.
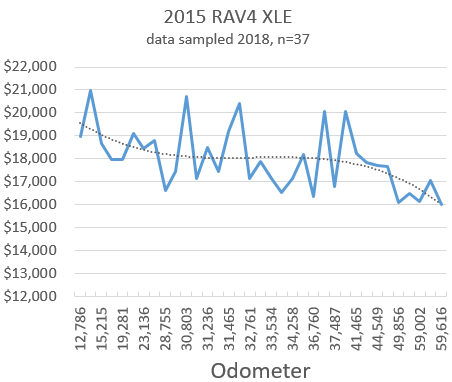
Not bad! Not crazy either. Actual dealership book values from a few years back (2018) for a large dealership network in CA and PA, show the depreciation sweet spot for a 2015 RAV4 XLE below. This is the same car as used in our example (data for two other cars in the Appendix). Note that book values tend to run $2,000-4,000 less than retail advertised price. If these prices look low, the are from 2018, before Covid inflation.
Car Sharing
A car owner can also run this strategy, independently or through a peer-to-peer listing site like GetAround or Turo. The rate of return will be lower though, because the comparison is actual depreciation rather than the carrying cost before flipping the car. In the above example, they'll make $1,600 ($3,600 minus $2,000) less their time to manage the rentals. Shorter term rentals have a far higher daily rate however, which should improve results.
Start Building Business Intelligence Now
This is just one opportunity from a very simple analysis. No doubt many other opportunities are available for clever dealerships who understand the value of their data and are willing to take control of some portion of it rather than giving it away free.
In addition, managing this idea as it evolves over time will require follow up sampling of data and ongoing analytics from businesses with abundant information about prices and sales. Yes the information is publicly available if you don’t mind waiting for state records to update, but those closer to the data will have an inherent advantage.
You don’t have to use the phrase data science, feel free to call it business intelligence or data analysis. You may not even like the rental idea. But gaining and maintaining an edge on your competition comes from deeply understanding your business, analyzing the data, and unlocking new opportunities to operate.
Risks and Opportunities
Executing new business plans comes with risk and will never be straight forward. In our example, dealerships can’t “just start renting”. They are regulated on the products and services they can sell so they may have to open subsidiary companies to run this strategy, which increases costs. In addition the new business comes with price risk. Specifically: the vehicle value curve could shift for the worse if the rental strategy gets widely used (though the curve may also shift favorably, as was the case during Covid when reduced availability made prices shoot higher).
Larger dealerships and dealership networks can control risk, at least partially, because they have abundant price data and can stay on top of changes. But dealerships are also risk-averse. They run well tuned cash-cow businesses and don't like the idea of damaging their returns. What might help is an insurance policy to mitigate the risk of cars depreciating faster than expected. A way to hedge the depreciation sweet spot, not unlike a farmer protecting their crop before harvest.
This article gets into depth proposing a new financial product that allows for the creation of such an insurance policy to manage risk: Futures contracts for cars.
Futures are contracts that allow producers of commodities like wheat, corn, gold and copper to lock-in a sales price in advance of delivery. Using car futures, dealerships can protect the portion of car inventory designated for the rentals described above against unexpected depreciation.
Please get in touch to discuss this idea further, or to educate me on real-world examples and how to make this idea work in practice.
Like this idea or the subject? Here are two related pieces: Car Ticker Price Network and a how new financial tools are necessary to help dealerships manage risk and innovate.
Header image credit:
Appendix
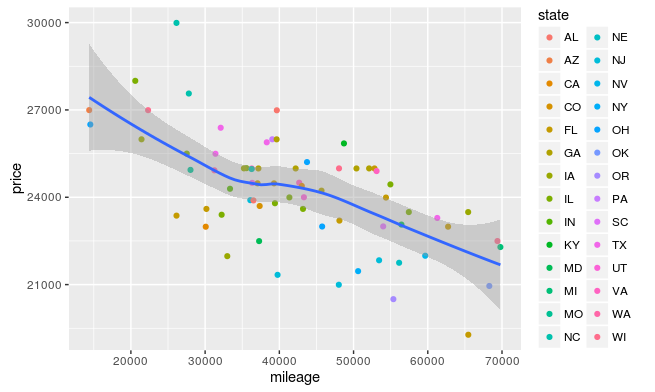
The folks at Revolutions Analytics did a statistical study with publicly available data about 5 years ago which clearly shows the sweet spot, and takes into account geographic distribution.
A bit dated, but the below charts show two more cars with vintages similar to our RAV4 example holding value steadily between 35,000 to 50,000 miles and then starting to drop toward the "value auto" category. Data from 2018.
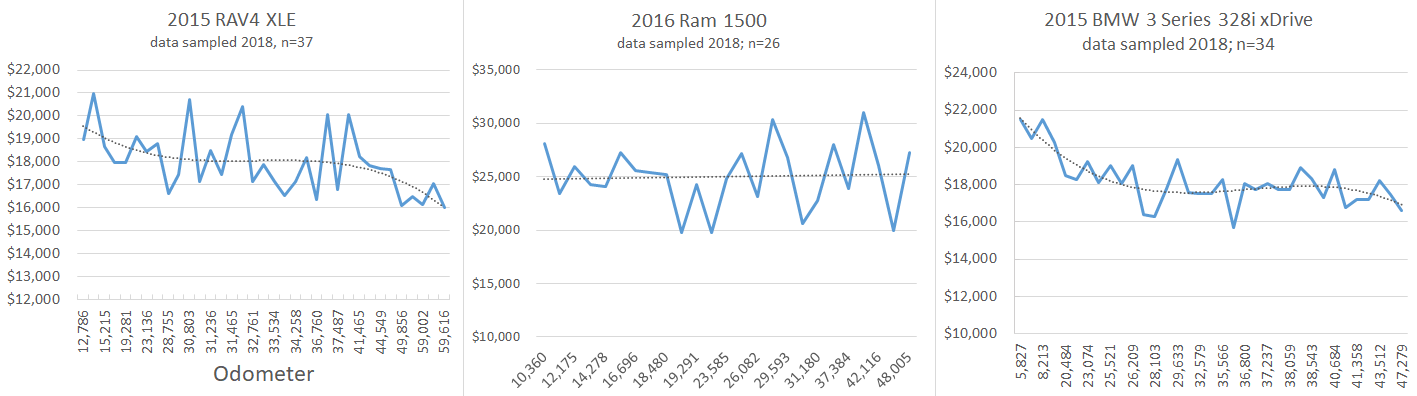
Note how the pickup truck value appears to almost rise during the sweet spot! I no longer have access to such data, but I'd guess this is what value curves looked like during the Covid inflation.